Bitcoin Price Momentum Stalls at $106K: Key Technical Indicators Flash Warning
Bitcoin faces technical resistance at $106K as multiple indicators including RSI divergence and MACD crossover signal potential momentum slowdown. Key suppor…
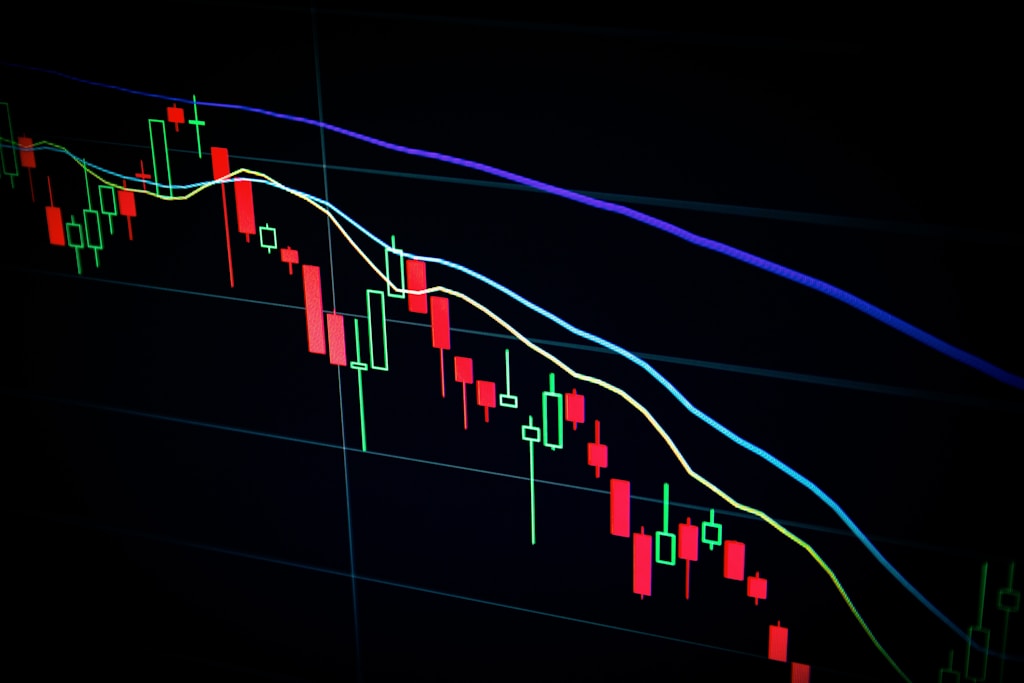
Bitcoin’s recent surge toward new all-time highs faces significant technical resistance, with multiple indicators suggesting a potential slowdown in momentum. As BTC continues to hold above the crucial $103K support level, analysts are closely monitoring several bearish divergences that could impact short-term price action.
Technical Analysis Reveals Concerning Patterns
Renowned crypto analyst Ali Martinez has identified three critical technical patterns that may signal a temporary pause in Bitcoin’s upward trajectory:
- A parallel channel formation showing price action approaching strong resistance
- RSI divergence indicating potential momentum weakness
- Bearish MACD crossover suggesting possible trend reversal
Parallel Channel Pattern Signals Resistance
The most prominent technical formation currently affecting Bitcoin’s price action is a parallel channel pattern, which has contained BTC’s movements for several months. The cryptocurrency has recently touched the upper boundary of this channel, historically a point of rejection.
RSI Divergence Raises Red Flags
The Relative Strength Index (RSI) has formed a concerning bearish divergence pattern. While Bitcoin’s price has continued making higher highs, the RSI has failed to confirm these moves, creating lower highs instead. This technical discord often precedes price corrections.
SPONSORED
Trade Bitcoin with up to 100x leverage and maximize your profit potential
MACD Signals Potential Trend Shift
The Moving Average Convergence Divergence (MACD) indicator has recently displayed a bearish crossover, with the MACD line dropping below the signal line. This technical event typically suggests decreasing bullish momentum and could indicate an impending price correction.
Price Action and Support Levels
Bitcoin currently trades at $105,300 after failing to maintain momentum above $106,000. The $106K level has emerged as a critical resistance point, with multiple rejection wicks visible on recent daily candles.
FAQ Section
What does the parallel channel pattern suggest for Bitcoin’s price?
The parallel channel pattern indicates that Bitcoin may face significant resistance at current levels, with historical data showing previous rejections at the upper boundary.
How reliable are RSI divergences as trading signals?
RSI divergences are considered reliable technical indicators, particularly when confirmed by other signals. However, they should not be used in isolation for trading decisions.
What’s the next major support level if Bitcoin corrects?
Based on recent price action and technical analysis, the $103,000 level serves as the next major support zone, followed by the parallel channel’s lower boundary.
Traders and investors should maintain careful position management and consider these technical warnings while planning their trading strategies. As always, proper risk management remains crucial in volatile market conditions.


