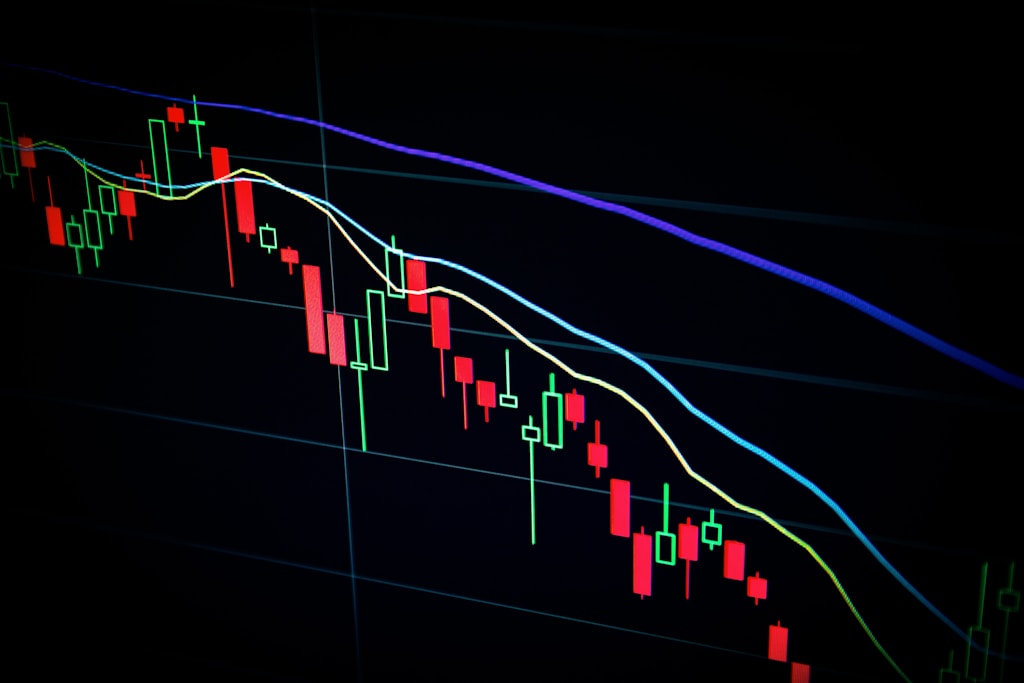
XRP Price Alert: Technical Analysis Signals Major Support Test at $2
XRP faces critical technical test as head-and-shoulders pattern emerges alongside similar formations in major altcoins. Key support at $2 could determine nex…

Multiple cryptocurrencies including XRP, Ethereum Classic (ETC), Bitcoin Cash (BCH), and yearn.finance (YFI) are showing remarkably similar technical patterns that could signal significant price movements ahead. Let’s analyze what these patterns mean for XRP and the broader altcoin market.
Critical Technical Patterns Emerge Across Major Altcoins
According to renowned crypto analyst Ali Martinez, XRP is currently testing a crucial support level after forming what appears to be a textbook head-and-shoulders pattern. This development comes as XRP tests the critical $2 support level, making this technical analysis particularly timely for traders.
Understanding the Head-and-Shoulders Pattern
The head-and-shoulders pattern in XRP’s chart consists of three distinct peaks:
- Left shoulder: Initial price peak
- Head: Higher central peak
- Right shoulder: Final peak at similar height to left shoulder
Key Support Levels to Watch
| Asset | Current Price | Support Level | Pattern Type |
|---|---|---|---|
| XRP | $2.06 | $2.00 | Head & Shoulders |
| BCH | Current | Triangle Base | Symmetrical Triangle |
| ETC | Current | Channel Bottom | Parallel Channel |
Market Implications and Trading Considerations
The convergence of these patterns across multiple altcoins suggests a broader market trend that traders should monitor carefully. The current 16% weekly decline in XRP’s price adds weight to the bearish scenario suggested by the technical analysis.
Frequently Asked Questions
Q: What does a head-and-shoulders pattern typically indicate?
A: This pattern usually signals a potential trend reversal from bullish to bearish when completed.
Q: How reliable are these technical patterns?
A: While technical patterns provide valuable insights, they should be used alongside other analysis tools and indicators for confirmation.
Q: What’s the next major support level if $2 breaks?
A: Traders should watch the previous consolidation zone around $1.80 as the next significant support level.
Conclusion
As XRP and its peers approach critical technical junctures, traders should maintain strict risk management practices and watch for confirmation of these patterns before making trading decisions. The next few days will be crucial in determining whether these technical signals result in the predicted market movements.


