Author: Defx Intern

  • Bitcoin Alert: 8,000 Dormant BTC Worth $674M Suddenly Moves, Market Tenses

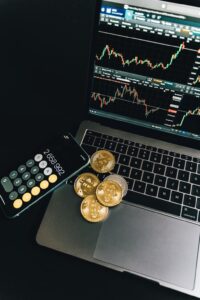
    In a significant development that has caught the crypto market’s attention, approximately 8,000 Bitcoin (BTC) worth $674 million, dormant for 5-7 years, have suddenly become active. This movement comes at a crucial time as Bitcoin struggles with resistance at the $89,000-$90,000 range, raising concerns about potential market impact.

    Key Takeaways:

    • 8,000 BTC ($674M) moved after 5-7 years of inactivity
    • Transaction occurred in a single block
    • Follows recent pattern of dormant wallet activations
    • Market shows increased sensitivity to large transfers

    Analysis of the Dormant Bitcoin Movement

    According to CryptoQuant analyst Maartunn, the Spent Output Age Bands metric revealed this substantial movement of previously inactive Bitcoin. This transfer is particularly noteworthy as it follows a series of smaller dormant wallet activations, including a 14-year-old wallet that moved 100 BTC ($8.5M) on March 24.

    SPONSORED

    Trade Bitcoin with up to 100x leverage and maximize your profit potential

    Trade Now on Defx

    Market Implications and Technical Analysis

    The timing of this movement is particularly crucial as Bitcoin exchange flows show significant changes. Current market indicators suggest:

    • Price currently at $83,693
    • 24-hour decline of 4.00%
    • Weekly decline of 0.72%
    • Trading volume up 19.38% at $31.58B

    External Factors Affecting Bitcoin Price

    The market is currently dealing with additional pressure from U.S. policy developments, including new tariff announcements affecting global trade. These factors have contributed to recent price volatility and market uncertainty.

    FAQ Section

    What does dormant Bitcoin movement indicate?

    Dormant Bitcoin movement often signals potential selling pressure, though it can also represent internal transfers or cold storage reorganization.

    How might this affect Bitcoin price?

    While large transfers can create short-term volatility, the impact depends on the holder’s intentions and market conditions.

    What’s the current market outlook?

    The market shows mixed signals with strong fundamentals but faces short-term pressure from macro factors and large transfers.

    Market Outlook and Conclusion

    While the movement of dormant Bitcoin typically raises concerns about potential selling pressure, the current market structure and institutional interest may help absorb any potential impact. Traders should monitor wallet movements and exchange flows for further market direction signals.

  • Crypto Stocks Plunge 10%+ as Market Sheds $150B in Major Selloff

    Key Takeaways:

    • Crypto market cap drops $150 billion since Monday
    • Crypto-related stocks experience double-digit percentage losses
    • Market downturn shows strong correlation between crypto and traditional markets

    The cryptocurrency market is experiencing a significant correction, with crypto-related stocks bearing the brunt of a massive $150 billion market contraction since Monday. This downturn mirrors broader market pressures as Bitcoin tests critical support levels, highlighting the growing interconnectedness between digital assets and traditional financial markets.

    Understanding the Market Meltdown

    The synchronized selloff across crypto stocks demonstrates the maturing relationship between digital asset markets and traditional equities. Major crypto-focused companies have seen their share prices decline dramatically, reflecting investor concerns about market stability and regulatory uncertainties.

    SPONSORED

    Protect your portfolio with up to 100x leverage on perpetual contracts

    Trade Now on Defx

    Impact on Major Crypto Stocks

    Leading crypto companies have experienced significant valuation drops:

    Company Percentage Decline
    Crypto-focused stocks 10-15% average decline
    Mining companies 12-18% decline
    Crypto exchanges 15-20% decline

    Market Correlation Analysis

    The current market dynamics reveal a strong correlation between crypto assets and traditional markets, suggesting that institutional involvement has strengthened these connections. This relationship has become particularly evident during periods of market stress.

    Expert Insights

    Market analysts suggest that this correction could present buying opportunities for long-term investors, though caution is advised given the current market volatility.

    Frequently Asked Questions

    • What caused the crypto market selloff?
      A combination of broader market pressures, regulatory concerns, and technical factors contributed to the decline.
    • How long might this downturn last?
      Market analysts suggest monitoring key support levels and broader economic indicators for potential recovery signals.
    • What does this mean for crypto investors?
      Diversification and risk management remain crucial during periods of market volatility.

    Investors should closely monitor market indicators and maintain appropriate risk management strategies during this period of increased volatility.

  • Terra Claims Portal Opens March 31: How to Recover LUNA Losses

    Terra Claims Portal Opens March 31: How to Recover LUNA Losses

    Terraform Labs is launching a critical claims portal on March 31, 2025, offering hope to investors affected by the historic Terra/LUNA collapse. This comprehensive guide explains how eligible investors can file claims and potentially recover losses from one of crypto’s largest financial disasters.

    Key Takeaways:

    • Claims portal opens March 31 at claims.terra.money
    • Deadline for submissions is April 30, 2025, at 11:59 PM ET
    • Proof of ownership required via exchange API keys
    • Initial claim decisions expected within 90 days

    This development comes as major institutions like Galaxy Digital face their own LUNA-related settlements, highlighting the far-reaching impact of the Terra collapse.

    Eligibility Requirements for Terra Claims

    Not all Terra ecosystem participants will qualify for claims. Here are the key eligibility criteria:

    • Must have held specific listed cryptocurrencies during the collapse period
    • Assets must have had minimum $100 on-chain liquidity
    • Terra 2.0’s LUNA tokens are not eligible
    • Must provide verifiable proof of ownership

    SPONSORED

    Trade with confidence using up to 100x leverage on perpetual contracts

    Trade Now on Defx

    How to Submit Your Claim

    Follow these steps to maximize your chances of claim approval:

    1. Visit claims.terra.money starting March 31
    2. Prepare read-only API keys from your exchanges
    3. Document all eligible cryptocurrency holdings
    4. Submit before the April 30 deadline
    5. Monitor email for verification requests

    Important Timeline

    Event Date
    Portal Launch March 31, 2025
    Submission Deadline April 30, 2025
    Initial Decisions By July 29, 2025

    Frequently Asked Questions

    What happens if I miss the deadline?

    Claims submitted after April 30, 2025, will not be considered, resulting in forfeiture of recovery rights.

    Which proof of ownership is best?

    Exchange API keys are preferred over screenshots or manual documentation.

    How long until I receive compensation?

    Initial decisions will be communicated within 90 days, with distributions following claim verification.

    Historical Context: The Terra Collapse

    The Terra ecosystem’s collapse in 2022 marked a devastating moment in crypto history, with LUNA’s market cap plummeting from $41 billion to $6 million in just three days. This claims process represents a crucial step toward resolution for affected investors.

    Looking Forward

    While the claims process offers hope for recovery, it also serves as a reminder of the importance of risk management in crypto investments. The Terra collapse has led to significant regulatory changes and improved security measures across the industry.

  • Bitcoin Miner MARA Launches $2B Stock Sale to Boost BTC Holdings

    MARA Holdings, one of the largest Bitcoin mining companies, has announced an ambitious $2 billion stock offering aimed at expanding its Bitcoin treasury. This strategic move comes as the company continues to strengthen its position as the second-largest holder of Bitcoin among publicly traded companies, following closely behind Michael Saylor’s MicroStrategy.

    Strategic Expansion of Bitcoin Holdings

    According to SEC filings, MARA has entered into an at-the-market (ATM) equity program with several major investment banks, including Barclays, BMO Capital Markets, and BTIG. This latest initiative follows their previous $1.5 billion ATM offering, demonstrating the company’s aggressive approach to Bitcoin acquisition. Recent challenges in the Bitcoin mining sector have pushed miners to explore alternative strategies for BTC accumulation.

    MARA’s Bitcoin Treasury Strategy

    The company currently holds 46,376 BTC, making it a dominant force in the institutional Bitcoin landscape. This latest capital raise signals MARA’s commitment to its “Hodl” strategy, despite the challenging post-halving environment for miners.

    SPONSORED

    Trade Bitcoin with up to 100x leverage and maximize your profit potential

    Trade Now on Defx

    Market Impact and Industry Implications

    The move comes at a crucial time for the Bitcoin mining industry, which has faced significant challenges following the recent halving event. MARA’s strategy of direct market purchases, rather than relying solely on mining operations, represents a shift in traditional mining business models.

    FAQ Section

    Why is MARA raising $2 billion through stock sales?

    MARA plans to use the proceeds primarily for Bitcoin acquisition and general corporate purposes, following the successful strategy pioneered by MicroStrategy.

    How does this affect MARA’s position in the Bitcoin mining industry?

    This move strengthens MARA’s position as a leading institutional Bitcoin holder and demonstrates adaptation to post-halving market conditions.

    What are the implications for other Bitcoin miners?

    MARA’s strategy could set a precedent for other mining companies looking to diversify their Bitcoin acquisition methods beyond traditional mining operations.

  • XRP Price Forms Bullish Pattern: $3.90 Target Within 120 Days

    XRP’s price action is showing promising signs of a major bullish reversal, with technical analysis revealing a potentially lucrative setup for investors. Despite a recent 4.7% decline pushing the price to $2.12, a powerful inverse head and shoulders pattern is forming that could catapult XRP to new heights.

    Technical Analysis Reveals Bullish Setup

    Renowned crypto analyst Egrag Crypto has identified an inverse head and shoulders pattern on XRP’s daily timeframe, a formation historically associated with significant price reversals. This technical setup, which has been developing since early March, suggests a potential surge to the $3.70-$3.90 range upon completion.

    The pattern is particularly significant given XRP’s recent price action, which saw a decline from $2.47 and a 13.8% drop over three days. However, this retracement may be the final piece needed to complete the pattern’s right shoulder, setting the stage for a powerful breakout.

    SPONSORED

    Trade XRP with up to 100x leverage on perpetual contracts

    Trade Now on Defx

    RSI Analysis Supports Bullish Thesis

    The bullish case is further strengthened by XRP’s Relative Strength Index (RSI) patterns. Historical data shows a consistent trend where XRP experiences two distinct RSI peaks during bull cycles, separated by 90-120 days. The first peak of this cycle reached 85.17 in late 2024, suggesting a second peak could materialize around June 2025.

    This timing aligns perfectly with recent technical analysis showing XRP’s golden pocket pattern, adding another layer of confirmation to the bullish outlook.

    Key Price Levels to Watch

    For traders looking to capitalize on this setup, several critical price levels demand attention:

    • Current Support: $2.10
    • Pattern Neckline: $2.47
    • First Target: $3.70
    • Maximum Target: $3.90

    Market Implications and Trading Strategy

    The confluence of technical indicators suggests XRP is positioning for a significant move upward. Traders should watch for:

    • Completion of the right shoulder formation
    • Break above the neckline at $2.47
    • Increasing volume during breakout
    • RSI momentum confirmation

    FAQ Section

    Q: When is the inverse head and shoulders pattern expected to complete?
    A: Based on current formation, completion is anticipated within the next 2-3 weeks.

    Q: What could invalidate this bullish setup?
    A: A decisive break below $2.00 would likely invalidate the pattern.

    Q: How reliable are inverse head and shoulders patterns?
    A: These patterns have a historical success rate of approximately 75% in crypto markets when accompanied by strong volume.

    At the time of writing, XRP trades at $2.12, with technical indicators suggesting accumulation at these levels could prove profitable for patient investors targeting the $3.90 price objective.

  • Bitcoin Price Dips Below $84K: Critical Support Levels Revealed

    Bitcoin’s price has entered a critical phase after dropping below $84,000, following one of its strongest weekly performances that saw the cryptocurrency reach $88,000. The latest market movement, triggered by February’s core inflation data, has left investors questioning the strength of key support levels.

    As Bitcoin continues testing crucial support zones, on-chain data from Glassnode provides essential insights into potential price floors that could determine BTC’s next major move.

    Understanding Bitcoin’s Current Support Structure

    Glassnode’s cost basis distribution analysis reveals several critical support levels that could influence Bitcoin’s price trajectory:

    • $84,100: 40,000 BTC accumulated
    • $82,090: 50,000 BTC accumulated
    • $80,920: 20,000 BTC accumulated

    SPONSORED

    Trade Bitcoin with up to 100x leverage and maximize your profit potential

    Trade Now on Defx

    Deeper Support Zones and Risk Analysis

    The analysis identifies additional support levels that could become crucial if current levels fail:

    • $74,000: Strong support with 49,000 BTC accumulated
    • $71,000: Major accumulation zone with 41,000 BTC

    Notably, the previously strong $78,000 support level has weakened following recent sell-offs, potentially creating vulnerability in the short term.

    Market Impact and Trading Implications

    The current 4% decline brings several key considerations for traders:

    • Short-term volatility expected around $84,000
    • Increased trading volume at support levels
    • Potential for quick rebounds from accumulation zones

    Frequently Asked Questions

    What caused Bitcoin’s recent price drop?

    The decline was primarily triggered by February’s core inflation data release and subsequent market reactions.

    Where is the strongest support level for Bitcoin?

    According to Glassnode data, the $82,090 level shows the strongest support with 50,000 BTC accumulated.

    Could Bitcoin fall to $71,000?

    While possible, multiple strong support levels would need to break first, with $74,000 serving as a major buffer zone.

    As the market continues to digest these developments, traders should maintain close attention to these key support levels and corresponding volume patterns for potential entry and exit points.

  • XRP Price Struggles at $2: Key Support Levels Signal Potential Reversal

    XRP Price Struggles at $2: Key Support Levels Signal Potential Reversal

    Key Takeaways:

    • XRP currently trading between $2.11-$2.13
    • Market cap stands at $123 billion
    • 24-hour trading volume reaches $3.39 billion
    • Price range: $2.06-$2.22

    XRP’s price action has entered a critical phase as the digital asset struggles to maintain its position near the $2 mark. As recent analysis suggested a $3 breakout target would be needed to invalidate the bearish pattern, traders are closely monitoring key support levels for potential reversal signals.

    Current Market Conditions

    The cryptocurrency is experiencing significant pressure from sellers, with price action confined to a narrow range between $2.11 and $2.13. With a substantial market capitalization of $123 billion, XRP remains one of the top cryptocurrencies by value, though recent price action suggests mounting bearish pressure.

    Technical Analysis

    The hourly chart reveals several critical support and resistance levels:

    • Immediate Support: $2.06
    • Key Resistance: $2.22
    • Volume Profile: $3.39 billion in 24-hour trading volume indicates active market participation

    Trading Volume Analysis

    The current trading volume of $3.39 billion suggests significant market interest, though the price compression indicates potential accumulation at these levels. Traders should watch for volume spikes as potential indicators of trend direction.

    SPONSORED

    Trade XRP with up to 100x leverage on perpetual contracts

    Trade Now on Defx

    FAQ

    Q: What’s causing XRP’s current price struggle?
    A: Technical indicators suggest a combination of profit-taking and broader market uncertainty are contributing to the current price action.

    Q: What are the key levels to watch?
    A: Traders should monitor the $2.06 support and $2.22 resistance levels for potential breakout signals.

    Q: Could XRP reverse its current trend?
    A: While bearish pressure remains dominant, increased buying volume above $2.22 could signal a potential trend reversal.

  • Bitcoin Leaders Unite: Trump to Host El Salvador’s Bukele in Historic Meeting

    In a significant development for the cryptocurrency world, former U.S. President Donald Trump is set to host El Salvador’s Bitcoin-championing President Nayib Bukele at the White House this April. This historic meeting brings together two influential figures with potentially aligned interests in the cryptocurrency space, particularly given El Salvador’s groundbreaking Bitcoin adoption.

    The meeting, first reported by Bloomberg, comes at a crucial time for both nations and the broader cryptocurrency landscape. This development follows recent economic tensions between the U.S. and Venezuela, adding another layer of complexity to the regional dynamics.

    Strategic Implications for Bitcoin Adoption

    El Salvador’s pioneering move to adopt Bitcoin as legal tender in 2021 has positioned the country as a global leader in cryptocurrency adoption. Under Bukele’s leadership, El Salvador has accumulated significant Bitcoin reserves and launched various crypto-friendly initiatives, including the country’s first tokenized warehouse complex.

    SPONSORED

    Trade Bitcoin with up to 100x leverage on perpetual contracts

    Trade Now on Defx

    Beyond Cryptocurrency: A Multi-Faceted Partnership

    While Bitcoin adoption may be a point of discussion, the meeting’s primary focus appears to center on immigration and security cooperation. Bukele has agreed to accept hundreds of Venezuelan deportees from the United States, demonstrating El Salvador’s willingness to align with U.S. immigration policies.

    Market Implications and Future Outlook

    The cryptocurrency market could see significant movement depending on the outcome of this high-level meeting. With El Salvador’s Bitcoin-friendly policies and Trump’s previous statements about cryptocurrency, any joint announcements could impact market sentiment.

    Frequently Asked Questions

    What is the significance of this meeting for Bitcoin?

    This meeting represents the first high-level discussion between a pro-Bitcoin nation’s leader and a former U.S. president who has shown interest in cryptocurrency regulation.

    Could this meeting affect Bitcoin prices?

    While direct price impact is uncertain, positive developments from this meeting could influence market sentiment and institutional adoption.

    What are the potential outcomes for cryptocurrency regulation?

    The meeting could signal shifting attitudes toward cryptocurrency adoption at the governmental level, potentially influencing future regulatory frameworks.

    As this story develops, market participants will be watching closely for any signals about future cryptocurrency adoption and regulation. The meeting’s outcome could have lasting implications for both countries’ approach to digital assets and international financial cooperation.

  • Bitcoin Price Shows Recovery Signs as Taker-Driven Selling Cools Off

    Bitcoin Price Shows Recovery Signs as Taker-Driven Selling Cools Off

    Bitcoin’s price action is showing early signs of stabilization after a period of intense selling pressure that pushed the leading cryptocurrency below $84,000. Recent on-chain data suggests the heavy taker-driven dumps that dominated market activity may be losing momentum, potentially setting the stage for a recovery phase.

    This analysis comes as Bitcoin tests critical support levels around $83,000, with market participants closely monitoring whether current price levels can hold against bearish pressure.

    Market Structure Analysis

    The recent price action has been characterized by three significant taker-driven dumps that culminated in a low of $83,600. However, according to renowned analyst Maartunn, these aggressive selling spikes are showing signs of exhaustion, potentially indicating a shift in short-term market dynamics.

    SPONSORED

    Trade Bitcoin with up to 100x leverage on perpetual contracts

    Trade Now on Defx

    Technical Overview

    Key technical levels to watch:

    • Current Price: $84,000
    • Critical Resistance: $90,000
    • Key Support: $81,000
    • 4H 200 MA: $87,000

    On-Chain Metrics

    CryptoQuant’s Net Taker Volume metric reveals:

    • Declining sell-side pressure
    • Early signs of accumulation
    • Reduced aggressive selling activity

    Market Outlook

    While the immediate trend remains bearish below $90,000, several factors suggest a potential shift in momentum:

    • Exhaustion of aggressive sellers
    • Stabilizing price action near support
    • Improving market sentiment

    FAQ Section

    What caused the recent Bitcoin price drop?

    The decline was primarily driven by aggressive taker-driven selling on major exchanges, combined with broader market uncertainty and resistance at the $90,000 level.

    What are the key levels to watch?

    Traders should monitor the $87,000 level (4H 200 MA) as immediate resistance and $81,000 as crucial support. A break above $90,000 would signal renewed bullish momentum.

    Is this a good time to buy Bitcoin?

    While early recovery signs are emerging, investors should consider their risk tolerance and watch for confirmation of trend reversal before making investment decisions.

  • Dogecoin Mining Profitability Surges as Small Businesses Enter DOGE Market

    Dogecoin Mining Profitability Surges as Small Businesses Enter DOGE Market

    The once-joke cryptocurrency Dogecoin (DOGE) is seeing unprecedented growth in its mining sector, with small businesses increasingly turning to DOGE mining as a profitable alternative to Bitcoin. As revealed at the recent Mining Disrupt conference, this shift signals a maturing market for the meme-inspired cryptocurrency.

    According to recent analysis of Dogecoin’s supply metrics, miners are positioning themselves strategically as the asset approaches critical price levels. This growing interest in DOGE mining comes at a pivotal time for the cryptocurrency market.

    Why Small Businesses Are Turning to Dogecoin Mining

    • Lower barrier to entry compared to Bitcoin mining
    • Reduced hardware requirements and operational costs
    • Consistent profitability metrics despite market volatility
    • Growing institutional acceptance of DOGE as a payment method

    Mining Economics: DOGE vs Bitcoin

    Metric Dogecoin Bitcoin
    Initial Investment $5,000-$15,000 $20,000-$50,000
    Power Consumption Lower Higher
    Daily Rewards More frequent Less frequent

    SPONSORED

    Trade Dogecoin with up to 100x leverage on perpetual contracts

    Trade Now on Defx

    Expert Insights on DOGE Mining Profitability

    Industry experts at Mining Disrupt highlighted several key factors driving the increased interest in Dogecoin mining:

    • Scalable operations with lower capital requirements
    • Growing merchant adoption increasing DOGE utility
    • Community support and network effects
    • Potential for long-term value appreciation

    FAQ: Dogecoin Mining for Businesses

    What initial investment is needed for Dogecoin mining?

    Most small businesses can start with $5,000-$15,000 for basic mining operations.

    How does DOGE mining profitability compare to Bitcoin?

    While individual rewards are smaller, more frequent blocks and lower costs can make DOGE mining more accessible and profitable for smaller operations.

    What are the primary risks of Dogecoin mining?

    Market volatility, equipment depreciation, and energy costs remain key considerations.

    Looking Ahead: The Future of DOGE Mining

    As the cryptocurrency market continues to evolve, Dogecoin’s mining ecosystem shows signs of sustained growth and professionalization. Small businesses entering the space are contributing to increased network security and decentralization, while potentially creating new revenue streams for themselves.