Author: Defx Intern

  • Solana Price Shows Bullish TD Signal Despite 13% Drop – Key Levels

    Solana Price Shows Bullish TD Signal Despite 13% Drop – Key Levels

    Solana (SOL) has entered a critical technical phase, with a key indicator suggesting a potential trend reversal despite recent bearish price action. The cryptocurrency, which has seen a 13% decline over the past week, is now showing signs of a possible recovery according to respected technical analysis patterns.

    TD Sequential Signals Potential SOL Price Reversal

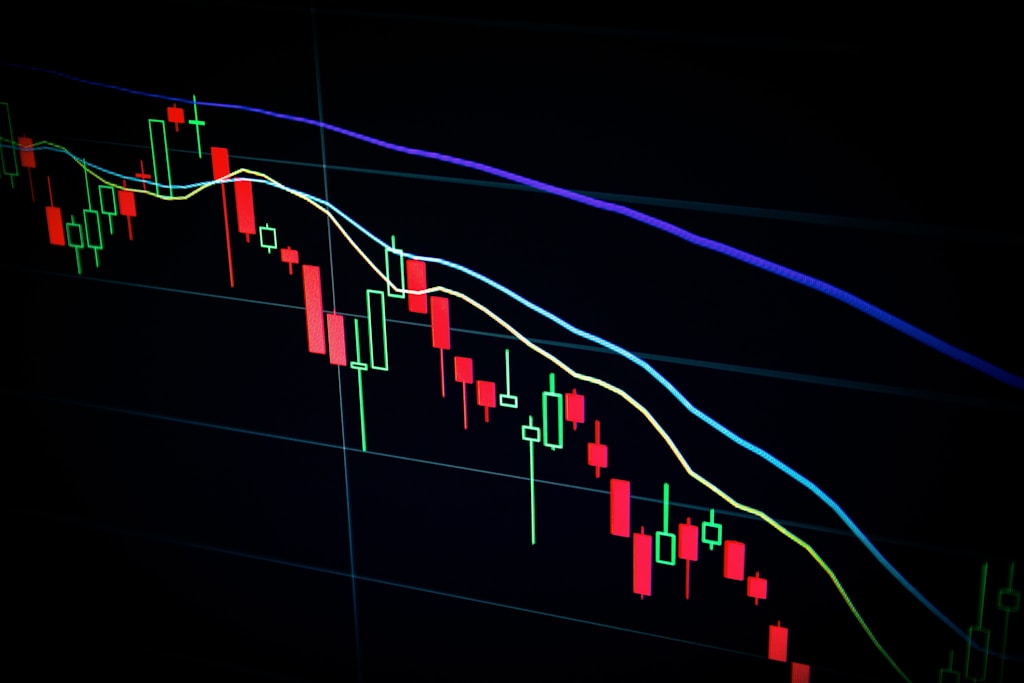
    Crypto analyst Ali Martinez has identified a significant technical development on Solana’s 12-hour chart. The Tom DeMark (TD) Sequential indicator, a widely-respected technical analysis tool, has just flashed a buy signal after completing a sequence of nine red candles.

    This technical formation is particularly noteworthy as it comes after Solana’s recent DeFi developments and could signal a shift in market sentiment.

    Understanding the TD Sequential Pattern

    The TD Sequential operates through two distinct phases:

    • Setup Phase: Counts nine consecutive candles of the same color
    • Countdown Phase: Extends to thirteen candles for confirmation

    In Solana’s case, the completion of nine red candles typically suggests an exhaustion of selling pressure and a potential buying opportunity.

    SPONSORED

    Trade Solana with up to 100x leverage on perpetual contracts

    Trade Now on Defx

    Whale Activity Adds Market Uncertainty

    However, on-chain data presents a potentially conflicting narrative. A significant SOL whale has transferred 2.86 million tokens (valued at $441 million) to Binance, raising concerns about potential selling pressure. This massive transfer represents one of the largest single-wallet movements in recent weeks.

    Key Price Levels to Watch

    Current critical levels for Solana:

    • Current Price: $153.90
    • Immediate Resistance: $165.00
    • Key Support: $150.00

    FAQ Section

    What does the TD Sequential buy signal mean for Solana?

    The TD Sequential buy signal suggests a potential trend reversal after nine consecutive red candles, indicating possible price recovery ahead.

    How significant is the whale transfer to Binance?

    The $441 million transfer represents a substantial position that could impact market dynamics if the whale decides to sell.

    What are the key price levels traders should monitor?

    Traders should watch the $150 support level and $165 resistance level for potential breakout or breakdown scenarios.

    As the market digests these mixed signals, traders should maintain careful position sizing and implement proper risk management strategies. The confluence of technical indicators and whale movements suggests increased volatility may lie ahead for Solana.
  • AI Jailbreaking Contest Offers $50K Bounty for ChatGPT Exploits

    In a groundbreaking development at the intersection of artificial intelligence and cybersecurity, renowned AI researcher ‘Pliny the Prompter’ has joined forces with HackAPrompt 2.0 to launch a $50,000 competition focused on AI system vulnerabilities. This initiative, which comes as AI computing power demands continue to grow, transforms AI security testing into a competitive sport.

    Understanding the HackAPrompt 2.0 Competition

    The competition challenges participants to discover and exploit vulnerabilities in ChatGPT’s security mechanisms. With a substantial $50,000 prize pool, this contest represents one of the largest bounties ever offered for AI prompt engineering and security research.

    Key Competition Details

    • Prize Pool: $50,000
    • Focus: ChatGPT vulnerability discovery
    • Format: Competitive jailbreaking challenges
    • Duration: Open submission period

    The Rise of AI Security Research

    As artificial intelligence systems become increasingly integrated into critical infrastructure and financial services, the importance of identifying and addressing security vulnerabilities has never been more crucial.

    SPONSORED

    Trade with confidence using advanced AI-powered analytics

    Trade Now on Defx

    Impact on AI Development

    This competition represents a significant shift in how the AI community approaches security testing, moving from closed-door research to open, competitive formats that encourage broader participation and innovation.

    FAQ Section

    What is AI jailbreaking?

    AI jailbreaking refers to the process of bypassing an AI system’s built-in safety constraints and restrictions to make it perform actions outside its intended parameters.

    Who can participate in the competition?

    The competition is open to security researchers, AI developers, and ethical hackers with demonstrated expertise in prompt engineering and AI systems.

    How are submissions evaluated?

    Entries are judged based on technical sophistication, reproducibility, and potential impact on AI system security.

  • XRP Treasury Strategy: Vivopower’s $100M BitGo Partnership Signals Corporate Adoption

    XRP Treasury Strategy: Vivopower’s $100M BitGo Partnership Signals Corporate Adoption

    In a groundbreaking move for corporate crypto adoption, Nasdaq-listed Vivopower International PLC (VVPR) has announced a strategic $100 million XRP treasury initiative in partnership with institutional crypto custodian BitGo. This development comes as XRP approaches key price resistance levels, highlighting growing institutional interest in the digital asset.

    Key Highlights of the Vivopower-BitGo Partnership

    • $100 million XRP acquisition planned
    • Institutional-grade custody solution through BitGo
    • First Nasdaq-listed company to implement XRP treasury strategy
    • Strategic timing amid growing corporate crypto adoption

    Strategic Implications for Corporate Treasury Management

    This partnership represents a significant shift in corporate treasury management strategies, as more publicly traded companies explore cryptocurrency allocations. BitGo’s involvement provides crucial institutional-grade security and compliance infrastructure, essential for corporate adoption.

    SPONSORED

    Trade XRP with up to 100x leverage on perpetual contracts

    Trade Now on Defx

    Market Impact and Analysis

    The announcement has significant implications for XRP’s market position and corporate adoption potential. Recent technical analysis suggests potential upside for XRP prices, with this institutional backing potentially catalyzing further gains.

    FAQ Section

    Why did Vivopower choose XRP for their treasury strategy?

    Vivopower selected XRP for its established market position, regulatory clarity compared to other cryptocurrencies, and potential for cross-border payment efficiency.

    What role does BitGo play in this partnership?

    BitGo provides institutional-grade custody solutions, security infrastructure, and compliance frameworks essential for corporate treasury operations.

    How does this affect XRP’s market position?

    This corporate adoption signals growing institutional confidence in XRP, potentially influencing both price action and broader market adoption.

    Looking Ahead: Implications for Corporate Crypto Adoption

    This partnership could set a precedent for other publicly traded companies considering cryptocurrency treasury strategies, particularly in the XRP ecosystem. The involvement of a regulated custodian like BitGo addresses key concerns around security and compliance that have historically deterred corporate adoption.

  • Bitcoin Warning Signs Mount as Long-Term Holders Exit $100K Level

    Bitcoin’s recent surge to $111,814 shows signs of weakening as key on-chain metrics flash warning signals. Long-term holders are reducing exposure while retail traders rush to buy the all-time high – a pattern that historically precedes market corrections.

    Critical Market Signals Point to Potential Correction

    As noted in recent analysis of whale behavior at the $100K level, several concerning trends have emerged in Bitcoin’s on-chain data:

    • Over $1 billion in stablecoins withdrawn from Binance
    • Long-term holder Net Position Realized Cap dropped from $28B to $2B
    • Large wallet holders (1,000-10,000 BTC) steadily reducing positions

    SPONSORED

    Trade Bitcoin with up to 100x leverage on perpetual contracts

    Trade Now on Defx

    Retail FOMO vs Institutional Caution

    While smaller retail traders holding 100-1,000 BTC are aggressively accumulating, institutional players appear more cautious. This divergence often signals a market top, as retail FOMO historically peaks near cycle highs.

    Bullish Indicators Remain

    Despite warning signs, several metrics suggest continued upside potential:

    • Bitcoin Net Realized Profit/Loss (NRPL) shows modest profit-taking compared to previous peaks
    • Recent 7,883 BTC withdrawal from Coinbase indicates possible institutional accumulation
    • Exchange reserves continue declining, suggesting strong hodler sentiment

    Key Price Levels to Watch

    Bitcoin currently trades at $103,854, with critical support at $100,000. A break below this psychological level could trigger accelerated selling. Resistance remains at the recent ATH of $111,814.

    FAQ

    What does the stablecoin outflow indicate?

    Large stablecoin outflows from exchanges typically signal reduced buying power and potential shift toward risk-off sentiment.

    Why are long-term holders selling?

    LTH selling often indicates profit-taking at major psychological levels and can precede market corrections.

    Is retail buying sustainable?

    Historical patterns suggest retail-driven rallies without institutional support are often unsustainable long-term.

  • Bitcoin Price Target $200K: Analyst Predicts 50x Altcoin Rally

    The cryptocurrency market is showing strong signs of a major breakout, with analysts projecting Bitcoin (BTC) to reach $200,000 and Ethereum (ETH) hitting $10,000 by the end of 2025. This bullish outlook coincides with growing institutional confidence in Ethereum’s trajectory, setting the stage for what could be the largest altcoin season in crypto history.

    Market Analysis Points to Massive Crypto Rally

    According to prominent analyst Ash Crypto, the crypto market is entering a new phase of its bull cycle, with Bitcoin positioned to more than double its current value. This prediction aligns with recent analysis suggesting a $130,000 Bitcoin price target by September, driven by increasing M2 liquidity.

    SPONSORED

    Trade Bitcoin with up to 100x leverage and maximize your profit potential

    Trade Now on Defx

    Bitcoin Dominance Signals Altcoin Opportunity

    The Bitcoin Dominance index (BTC.D) has reached a critical peak at 64.35%, historically a trigger point for altcoin season. Market expert CryptoElites suggests this metric could spark a rotation of capital from Bitcoin into altcoins, potentially generating returns of up to 50x for select cryptocurrencies.

    Key Investment Opportunities

    Current market conditions present several compelling opportunities:

    • Bitcoin trading 50% below projected $200,000 target
    • Ethereum positioned for 100% growth toward $10,000
    • Altcoins trading 70-90% below previous highs
    • Potential 10-20x returns on select assets

    FAQ Section

    When will the altcoin season begin?

    Analysts predict the altcoin season could begin once Bitcoin breaks key resistance levels and BTC.D starts declining from its current peak of 64.35%.

    Which factors support the $200,000 Bitcoin prediction?

    The prediction is supported by increasing institutional adoption, improving market fundamentals, and historical post-halving price patterns.

    What should investors consider before entering the market?

    Investors should focus on assets with strong utility, active development, real-world use cases, and supportive communities while maintaining proper risk management.

  • Solana, XRP, Dogecoin Prices Slump as Market Sentiment Weakens

    Leading altcoins Solana (SOL), XRP, and Dogecoin (DOGE) have experienced significant downward pressure this week, underperforming Bitcoin amid growing trade tensions and diminishing retail interest. This market movement follows a broader cryptocurrency sector pullback that has particularly impacted alternative digital assets.

    Market Analysis: Why Are Altcoins Underperforming?

    The recent decline comes as Dogecoin struggles to maintain key support levels, while XRP faces resistance in its attempt to reach higher price targets. Solana, despite its strong technological fundamentals, has not been immune to the market-wide correction.

    Key Factors Driving the Decline:

    • Escalating trade tensions affecting global markets
    • Reduced retail trading volume
    • Bitcoin dominance increasing during market uncertainty
    • Institutional investors favoring BTC over altcoins

    SPONSORED

    Trade meme coins with up to 100x leverage and maximize your potential returns

    Trade Now on Defx

    Technical Analysis and Price Levels

    Recent price action suggests key support levels are being tested:

    Asset Key Support Weekly Change
    Solana (SOL) $95 -8.5%
    XRP $1.85 -6.2%
    Dogecoin $0.187 -12.3%

    Expert Outlook and Market Predictions

    Market analysts suggest this could be a temporary correction before a potential recovery. XRP’s price structure indicates a possible breakout once market conditions improve.

    FAQ Section

    Why are altcoins falling more than Bitcoin?

    During periods of market uncertainty, investors typically move capital from riskier assets (altcoins) to more established cryptocurrencies like Bitcoin.

    When might we see a recovery?

    Technical indicators suggest a potential reversal once global trade tensions ease and retail interest returns to the market.

    What should investors watch for?

    Key indicators include trading volume, Bitcoin dominance ratio, and global macro events affecting risk assets.

  • Strategy IPO: Bitcoin Giant Plans $2.5B Stock Offering for BTC Expansion

    Strategy IPO: Bitcoin Giant Plans $2.5B Stock Offering for BTC Expansion

    Key Takeaways:

    • Strategy (formerly MicroStrategy) announces plans for STRD stock IPO
    • IPO proceeds targeted for aggressive Bitcoin acquisition strategy
    • Move follows company’s recent $75M Bitcoin purchase

    Strategy, the company formerly known as MicroStrategy, has unveiled an ambitious plan to launch an initial public offering (IPO) of its STRD stock, marking a significant evolution in corporate Bitcoin adoption strategy. This development comes as the firm continues its aggressive pursuit of Bitcoin accumulation.

    Strategic Evolution: From Software to Bitcoin Powerhouse

    The transformation from MicroStrategy to Strategy reflects the company’s laser focus on Bitcoin acquisition and holding. This strategic pivot has positioned the firm as the largest corporate Bitcoin holder, with its holdings consistently expanding through strategic purchases.

    IPO Details and Bitcoin Acquisition Plans

    The planned stock offering represents a novel approach to funding Bitcoin acquisitions in the corporate treasury space. Strategy’s move could set a precedent for other companies considering similar Bitcoin-focused treasury strategies.

    SPONSORED

    Trade Bitcoin with up to 100x leverage on perpetual contracts

    Trade Now on Defx

    Market Impact and Industry Response

    The announcement has generated significant interest from both traditional finance and crypto markets, potentially setting the stage for increased institutional Bitcoin adoption. This move aligns with the broader trend of growing Bitcoin treasury adoption among major corporations.

    FAQ Section

    • Q: How will the IPO proceeds be used?
      A: The primary focus will be on Bitcoin acquisition and expanding Strategy’s digital asset holdings.
    • Q: What impact might this have on Bitcoin’s price?
      A: The increased institutional demand could potentially contribute to price appreciation, especially given the scale of planned purchases.
    • Q: How does this compare to other corporate Bitcoin strategies?
      A: This represents one of the most aggressive corporate Bitcoin acquisition strategies to date.

    Looking Ahead

    Strategy’s bold move signals a new phase in corporate Bitcoin adoption, potentially inspiring other companies to consider similar strategies. The success of this IPO could establish a new paradigm for corporate treasury management in the digital age.

  • XRP Price Trigger Point at $2.56 Could Launch 50% Rally, Wave Analysis Shows

    XRP appears poised for a significant breakout according to comprehensive technical analysis combining Elliott Wave Theory and Wyckoff principles. After months of consolidation, analysts have identified $2.56 as the critical trigger level that could ignite XRP’s next major rally phase.

    Technical Analysis Points to Major XRP Price Breakout

    A detailed wave count analysis by crypto analyst ‘Charting Prodigy’ reveals that XRP has completed Wave 1 of a new impulse cycle following April’s lows, with a subsequent WXY corrective Wave 2 pattern now resolved. The analysis suggests XRP is entering sub-wave 3 of Macro Wave 5 – typically the strongest wave in Elliott Wave sequences.

    This analysis aligns with recent technical indicators showing XRP approaching key resistance levels that could trigger accelerated price movement.

    SPONSORED

    Trade XRP with up to 100x leverage on perpetual contracts

    Trade Now on Defx

    Multiple Technical Indicators Support Bullish Outlook

    The confluence of technical signals supporting this potential breakout includes:

    • Wyckoff reaccumulation pattern completion
    • Bullish MACD divergence formation
    • Fibonacci extension targets aligned with $2.90-$3.40 range
    • Classic accumulation phases including PSY, AR, and ST identified

    Double-Digit Price Targets Emerge

    Adding weight to the bullish case, analyst Egrag Crypto’s analysis of the 2-week chart projects potential targets at $10, $18, $27, and even $55 in the coming months. This forecast is based on XRP’s historical performance within a macro ascending channel dating back to 2016.

    Key Support and Resistance Levels

    Level Significance
    $2.56 Primary trigger point
    $2.65 Secondary confirmation level
    $2.90-$3.40 Initial target range

    Frequently Asked Questions

    What is the key price level to watch for XRP?

    The critical trigger point is $2.56, with confirmation above $2.65 potentially signaling the start of a major rally phase.

    What technical indicators support the bullish outlook?

    Multiple indicators including Elliott Wave patterns, Wyckoff accumulation, MACD divergence, and Fibonacci extensions all align to support the bullish case.

    What are the potential price targets if XRP breaks out?

    Initial targets range from $2.90-$3.40, with longer-term projections suggesting possible moves to $10, $18, $27, and $55 based on macro chart patterns.

  • AI Power Usage to Surpass Bitcoin’s Energy Consumption in 2025

    AI Power Usage to Surpass Bitcoin’s Energy Consumption in 2025

    A groundbreaking study reveals that artificial intelligence (AI) systems are on track to consume nearly half of all data center electricity by the end of 2025, significantly overshadowing Bitcoin’s energy footprint. This development comes as AI adoption continues to accelerate across industries, raising new questions about energy consumption in the digital age.

    Key Findings on AI Energy Consumption

    The research highlights several critical points about AI’s growing energy demands:

    • AI systems projected to use 45-50% of data center electricity by end of 2025
    • Current Bitcoin network consumption represents less than 10% of projected AI usage
    • Machine learning training costs expected to double every 3.4 months

    Implications for Bitcoin’s Environmental Narrative

    This revelation challenges the long-standing criticism of Bitcoin’s energy consumption, putting it into perspective against the broader technological landscape. While Bitcoin’s energy usage has been a constant target for environmental critics, AI’s rapidly growing power demands present a more significant environmental challenge.

    SPONSORED

    Trade with confidence using advanced AI-powered analytics

    Trade Now on Defx

    Comparative Analysis: AI vs. Bitcoin Energy Usage

    Metric AI (Projected 2025) Bitcoin (Current)
    Annual Energy Consumption ~450 TWh ~110 TWh
    Growth Rate 200% annually 10-15% annually

    FAQ Section

    How does AI energy consumption compare to Bitcoin mining?

    AI systems are projected to consume over four times more energy than Bitcoin mining by the end of 2025.

    Will this impact Bitcoin’s environmental criticism?

    The findings suggest that environmental concerns may need to be redirected toward the broader technology sector, particularly AI development.

    What solutions are being proposed?

    Researchers recommend developing more energy-efficient AI algorithms and exploring renewable energy sources for data centers.

  • Bitcoin Price Drops 7% as Binance Sell Pressure Mounts – Key Levels to Watch

    Bitcoin Price Drops 7% as Binance Sell Pressure Mounts – Key Levels to Watch

    Bitcoin (BTC) has entered a notable correction phase, retreating 7% from its recent all-time high of $111,000 to current levels around $104,115. This price action comes as Bitcoin continues to trade sideways near the $105K level, with mounting sell pressure from Binance’s institutional traders signaling potential near-term volatility.

    Binance Trading Metrics Signal Bearish Sentiment

    According to recent analysis from CryptoQuant, Binance’s Taker Buy/Sell ratio has declined below the crucial 1.0 threshold, currently sitting at 0.98. This represents a significant 12% weekly decline and a concerning 25% monthly drop. As Binance commands roughly 60% of global Bitcoin spot trading volume, this metric carries substantial weight for overall market direction.

    SPONSORED

    Trade Bitcoin with up to 100x leverage and maximize your profit potential

    Trade Now on Defx

    Historical Context and Market Implications

    The current market dynamics mirror previous corrections from February 2024 and August 2023, where similar divergences in Binance’s trading patterns preceded Bitcoin price drops of 5-10%. This historical correlation suggests increased probability of continued downward pressure in the immediate term.

    Key Support Levels and Technical Outlook

    While the broader market shows some buying interest, with aggregate Taker Buy/Sell ratios reaching 1.35 across other exchanges, Binance’s dominant position means its bearish stance could overshadow these positive signals. Despite recent whale accumulation of 78,000 BTC, short-term technical indicators suggest increased volatility ahead.

    Expert Analysis and Price Targets

    CryptoQuant’s analysis warns of a potential bull trap unless Binance’s Taker Buy/Sell ratio can decisively break above 1.05. The current market structure suggests traders should prepare for heightened volatility and possible further downside as market sentiment aligns with institutional flows.

    FAQ Section

    What is the Taker Buy/Sell ratio?

    The Taker Buy/Sell ratio measures the relationship between buy and sell orders executed at market price. A ratio below 1.0 indicates more selling than buying pressure.

    Why is Binance’s trading activity significant?

    Binance accounts for approximately 60% of global Bitcoin spot trading volume, making its trading patterns a crucial indicator of market direction.

    What are the key support levels to watch?

    Current technical analysis suggests strong support at $100,000, with secondary support at $98,500 and $95,000 levels.