Author: Defx Intern

  • Bitcoin Price Tests $103K: Critical Support Level Could Trigger Rally

    Bitcoin Price Tests $103K: Critical Support Level Could Trigger Rally

    Bitcoin continues to demonstrate resilience above the psychological $100,000 mark, currently trading at $103,700 despite recent market turbulence. Recent on-chain analysis suggests the broader rally may not be over, with key indicators pointing to potential upside ahead.

    Long-Term Bitcoin Indicators Signal Strength

    According to renowned crypto analyst Willy Woo, the Bitcoin Risk Signal – one of the most reliable long-term indicators – is showing encouraging signs. The metric’s downward trend suggests growing buy-side liquidity, potentially setting up Bitcoin for another leg higher.

    Key long-term bullish factors include:

    • Declining risk readings indicating a favorable accumulation environment
    • Strong buy-side liquidity dominance
    • Price holding firmly above six figures
    • Local risk model in mid-range with room for growth

    SPONSORED

    Trade Bitcoin with up to 100x leverage on perpetual contracts

    Trade Now on Defx

    Short-Term Caution Signs Emerge

    While the long-term outlook remains positive, several short-term metrics warrant attention:

    • SOPR (Spent Output Profit Ratio) showing signs of weakness
    • Flat capital inflows over the past 72 hours
    • Rally momentum from $75,000 to $112,000 losing steam
    • Critical support test at $100,000 level

    Key Price Levels to Watch

    Traders should monitor these crucial price points:

    • Immediate resistance: $114,000
    • Major liquidity zone: $118,000-$120,000
    • Critical support: $100,000
    • Current trading range: $103,000-$105,000

    Expert Analysis and Market Outlook

    The market stands at a critical juncture, with two possible scenarios emerging:

    Bullish Case:

    • Strong buying pressure could trigger a break above $114,000
    • Short position liquidations could accelerate upward momentum
    • Target zone between $118,000-$120,000

    Bearish Case:

    • Weak spot buying could lead to consolidation
    • Risk of bearish divergence formation
    • Potential retest of lower support levels

    Frequently Asked Questions

    What is causing Bitcoin’s current price action?

    The current price action is influenced by a combination of long-term accumulation patterns and short-term profit-taking, with institutional flows playing a significant role.

    Will Bitcoin break above $120,000?

    While long-term indicators suggest potential for higher prices, immediate momentum will depend on spot buying pressure and institutional participation in the coming weeks.

    What are the key support levels to watch?

    The primary support zone lies at $100,000, with secondary support at $103,000. These levels are crucial for maintaining bullish momentum.

    At time of writing, Bitcoin trades at $103,700, showing a 1.5% decline over 24 hours and a 3.9% drop over the past week.

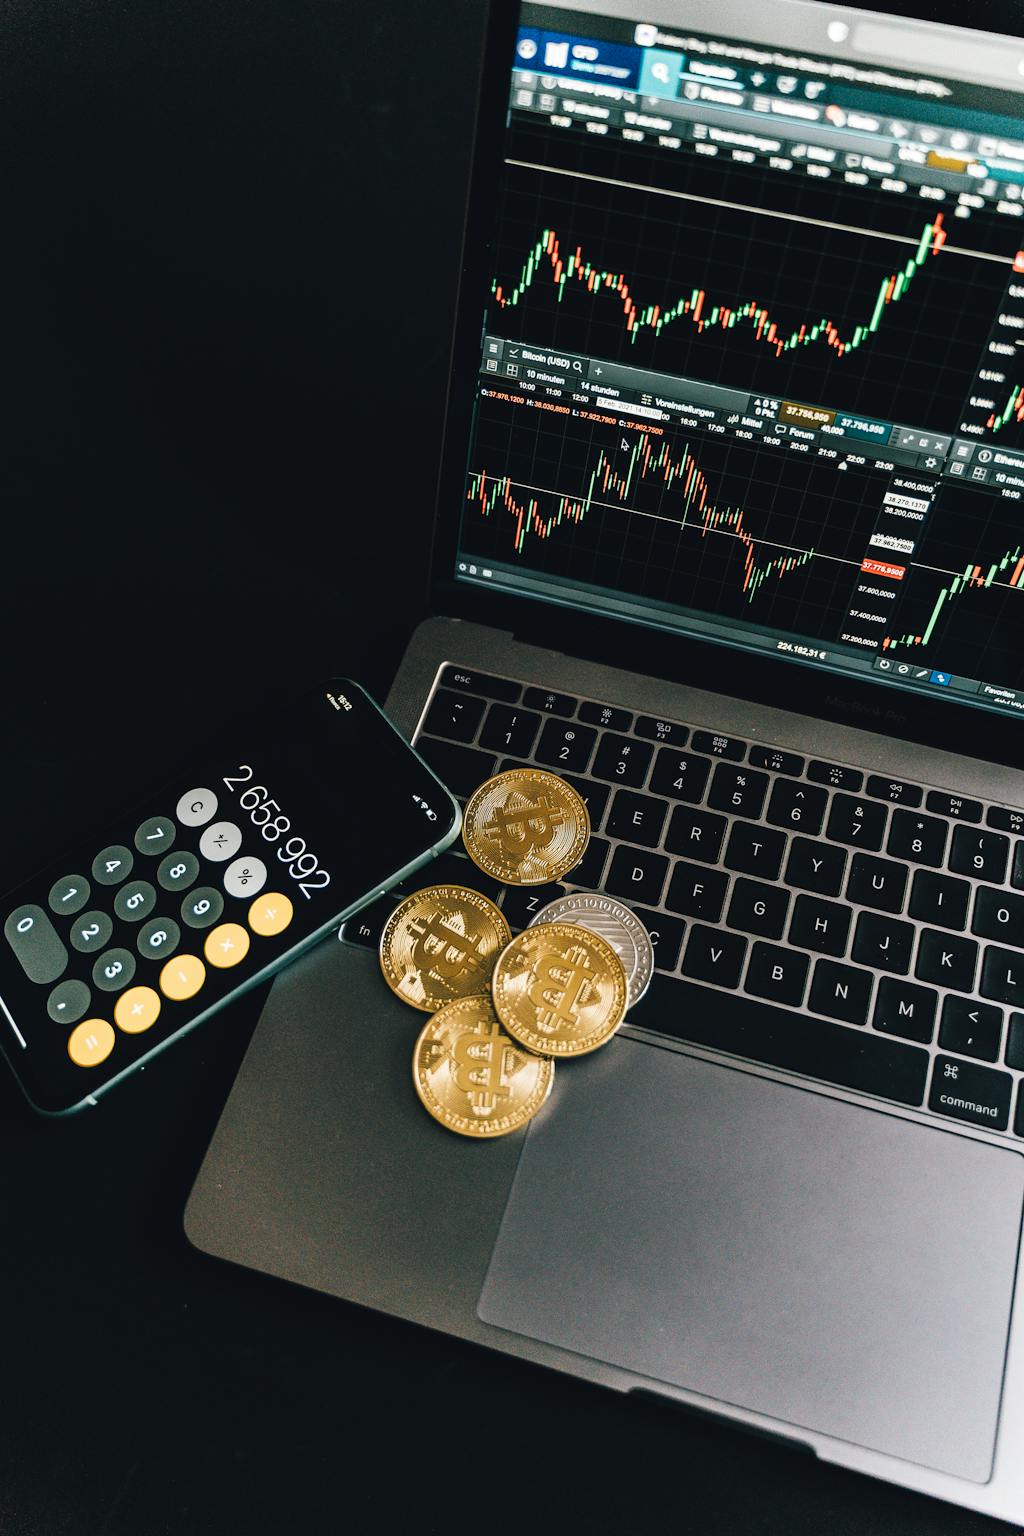
  • Bitcoin Price Could Soar: Kiyosaki Says 0.01 BTC May Make You Rich

    Bitcoin Price Could Soar: Kiyosaki Says 0.01 BTC May Make You Rich

    Key Takeaways:

    • Robert Kiyosaki predicts even small Bitcoin holdings could generate significant wealth
    • Rich Dad Poor Dad author warns of impending hyperinflation
    • Bitcoin’s scarcity and network effects highlighted as key value drivers

    Robert Kiyosaki, the renowned author of ‘Rich Dad Poor Dad’, has made a bold prediction about Bitcoin’s potential to create wealth, suggesting that even a fraction as small as 0.01 BTC could generate significant returns for investors. This comes as Bitcoin’s price shows signs of a potential massive rally ahead.

    Why Kiyosaki Is Bullish on Bitcoin

    Kiyosaki’s latest statements emphasize Bitcoin’s unique position as a hedge against what he sees as impending hyperinflation. The financial educator points to several key factors:

    • Bitcoin’s fixed supply of 21 million coins
    • Growing institutional adoption
    • Network effect strengthening over time

    SPONSORED

    Trade Bitcoin with up to 100x leverage and maximize your potential returns

    Trade Now on Defx

    The Case for Small Bitcoin Holdings

    According to Kiyosaki, even a modest investment in Bitcoin could yield substantial returns due to several factors:

    Bitcoin Amount Current Value ($105K) Potential Value ($1M)
    0.01 BTC $1,050 $10,000
    0.1 BTC $10,500 $100,000
    1 BTC $105,000 $1,000,000

    Market Context and Analysis

    This prediction comes as Bitcoin ETFs continue to see significant inflows, suggesting growing institutional confidence in the cryptocurrency. The market has shown remarkable resilience, despite recent volatility.

    FAQ Section

    Q: How much Bitcoin should I buy according to Kiyosaki?
    A: Kiyosaki suggests that even 0.01 BTC could be significant, though he advocates for acquiring as much as one’s risk tolerance allows.

    Q: When does Kiyosaki expect hyperinflation to occur?
    A: While he hasn’t specified an exact timeframe, he warns that current monetary policies could accelerate the process.

    Q: Is it too late to invest in Bitcoin?
    A: According to Kiyosaki, Bitcoin is still in its early adoption phase, suggesting significant upside potential remains.

    Expert Opinions and Market Sentiment

    Market analysts align with Kiyosaki’s bullish outlook, citing several supporting factors:

    • Increasing institutional adoption
    • Growing regulatory clarity
    • Technological improvements in the Bitcoin network
    • Rising inflation concerns globally

    Conclusion

    While Kiyosaki’s predictions may seem ambitious, the underlying thesis of Bitcoin as a hedge against inflation and a wealth creation vehicle continues to gain traction. As always, investors should conduct their own research and invest only what they can afford to lose.

  • XRP Price Alert: $2.13 Support Level Critical for 5% Relief Rally

    XRP Price Alert: $2.13 Support Level Critical for 5% Relief Rally

    XRP faces a crucial moment as the fourth-largest cryptocurrency tests a vital support level at $2.13, with technical analysis suggesting potential for a quick relief rally pending successful defense of this key price point. Recent bearish patterns have put increased pressure on XRP holders, making this support level particularly significant.

    Technical Analysis Points to Short-Term Relief Opportunity

    Prominent crypto analyst CasiTrades has identified a promising scalp setup that could lead to a swift price recovery. The analysis highlights several key technical levels:

    • Current support: $2.13
    • Fibonacci retracement level: 0.118 at $2.196
    • Initial target: $2.253 (0.236 Fibonacci level)
    • Extended targets: $2.333, $2.395, and $2.456

    SPONSORED

    Trade XRP with up to 100x leverage on perpetual contracts

    Trade Now on Defx

    Market Indicators and Volume Analysis

    The current market structure shows concerning signals:

    • 24-hour decline: 4.86%
    • 30-day performance: -3.01%
    • Trading volume surge: +57.32%
    • RSI reading: 36.47 (approaching oversold)

    This technical setup aligns with broader wave analysis predictions that suggest significant upside potential for XRP, though immediate price action remains dependent on the defense of current support levels.

    Expert Outlook and Price Targets

    Market analyst Crypto V maintains a bullish long-term stance, projecting a substantial market cap expansion to $790 billion by year-end. However, short-term price action hinges on:

    • Defense of $2.13 support level
    • Volume profile at key resistance points
    • Overall market sentiment shift

    Frequently Asked Questions

    Q: What happens if XRP breaks below $2.13?
    A: A break below this level could trigger further decline toward $1.77, invalidating the current relief rally setup.

    Q: What’s the immediate upside target?
    A: The primary target is $2.253, with potential extension to $2.456 if momentum builds.

    Q: How does this align with XRP’s long-term outlook?
    A: While short-term volatility persists, analysts maintain bullish long-term projections, with some targeting significant market cap expansion.

  • Bitcoin Dominance Hits 64%: Altcoin Season Signals Emerge

    Bitcoin Dominance Hits 64%: Altcoin Season Signals Emerge

    Bitcoin’s market dominance has reached a critical threshold of 64%, potentially signaling an imminent altcoin season as technical indicators suggest exhaustion in BTC’s dominance rally. Recent market data shows significant altcoin liquidations as Bitcoin continues to exert pressure across the crypto market.

    Bitcoin Dominance Analysis: Key Technical Levels

    The cryptocurrency market is witnessing a crucial turning point as Bitcoin’s dominance encounters strong resistance between 64.00% and 64.40%. This technical barrier has repeatedly rejected upward movements throughout May, suggesting potential exhaustion in Bitcoin’s market control.

    SPONSORED

    Trade with up to 100x leverage on perpetual contracts

    Trade Now on Defx

    Technical Indicators Point to Altcoin Opportunity

    Despite Bitcoin testing critical support levels, several technical indicators suggest an approaching shift in market dynamics:

    • Resistance zone: 64.00-64.40% showing repeated rejections
    • Current dominance: 63.5% testing crucial support
    • Ethereum dominance: 9.4% with recent 2.01% increase

    Altcoin Market Outlook

    The potential decline in Bitcoin dominance could trigger significant movements in major altcoins:

    • Ethereum: Positioned for potential breakout
    • Solana: Testing key support levels
    • Dogecoin: Showing accumulation patterns

    FAQ Section

    What is Bitcoin dominance?

    Bitcoin dominance represents BTC’s total market capitalization as a percentage of the entire cryptocurrency market cap.

    Why is 64% a critical level?

    Historical data shows that 64% has acted as a strong resistance level, often preceding significant altcoin rallies when breached.

    What triggers an altcoin season?

    Altcoin seasons typically begin when Bitcoin dominance shows sustained decline and capital flows from BTC into alternative cryptocurrencies.

    Traders should monitor the 63.45% support level closely, as a breakdown below this threshold could confirm the start of an altcoin season. However, a monthly close above 64% could invalidate this scenario and maintain Bitcoin’s market control.

  • Bitcoin Reserve: Pakistan’s Bold Move Sparks IMF Concern

    Bitcoin Reserve: Pakistan’s Bold Move Sparks IMF Concern

    In a groundbreaking development that signals the growing mainstream adoption of cryptocurrency, Pakistan has announced plans to establish a national bitcoin reserve, drawing immediate concern from the International Monetary Fund (IMF). This bold initiative, revealed at the Bitcoin Vegas 2025 conference, marks a significant shift in how developing nations approach digital asset strategy.

    Pakistan’s Bitcoin Reserve Initiative: Key Details

    The announcement comes at a crucial time, as similar initiatives emerge globally, including the UK’s recent consideration of a bitcoin reserve system. Pakistan’s plan includes:

    • Establishment of a dedicated digital asset authority
    • Initial allocation of 2,000 BTC to national reserves
    • Creation of regulatory framework for cryptocurrency operations

    IMF’s Response and Economic Implications

    The IMF’s immediate concern stems from several factors:

    Concern Area Impact
    Monetary Policy Potential interference with traditional currency management
    Economic Stability Volatility risks in national reserves
    Regulatory Oversight Challenges in maintaining compliance standards

    SPONSORED

    Trade Bitcoin with up to 100x leverage on perpetual contracts

    Trade Now on Defx

    Market Impact and Expert Analysis

    The announcement has significant implications for both regional and global crypto markets. With Bitcoin currently testing critical support levels, this development could provide additional momentum for institutional adoption.

    Frequently Asked Questions

    How will Pakistan’s bitcoin reserve affect the global crypto market?

    The initiative could set a precedent for other developing nations and potentially influence Bitcoin’s global adoption rate.

    What are the risks associated with national bitcoin reserves?

    Key risks include price volatility, custody security, and potential conflicts with traditional monetary policy.

    How might this affect Pakistan’s relationship with the IMF?

    The move could complicate ongoing economic negotiations and potentially impact future financial assistance programs.

    As this situation develops, market observers will be closely monitoring both the implementation details and the IMF’s formal response. The outcome could set important precedents for cryptocurrency adoption at the national level.

  • PEPE Price Surges 5% After Trump’s Truth Social Post Sparks Speculation

    The meme coin market saw unexpected volatility today as PEPE experienced a dramatic 5% surge following former US President Donald Trump’s cryptic Truth Social post. This price action, reminiscent of recent meme coin rallies following regulatory shifts, highlights the continuing influence of social media on crypto markets.

    Market Impact and Technical Analysis

    PEPE’s initial 5% surge quickly reversed into a 15% decline, demonstrating the characteristic volatility of meme tokens. Technical indicators suggest a complex market structure:

    • Cup-and-handle pattern formation over five months
    • Potential price target of $0.000026 if resistance breaks
    • MACD showing bearish divergence below signal line
    • RSI approaching critical 52 level
    • Key Fibonacci support at $0.00001

    SPONSORED

    Trade meme coins with up to 100x leverage on perpetual contracts

    Trade Now on Defx

    Broader Market Context

    The PEPE price movement coincides with significant macro events, including a US Court of International Trade ruling on tariffs. This regulatory backdrop, combined with the social media catalyst, creates a complex trading environment that could impact future price action.

    Trading Outlook and Key Levels

    Traders should monitor these critical levels:

    • Primary resistance: $0.000026
    • Key support: $0.00001 (0.618 Fibonacci level)
    • Secondary support: $0.000008

    FAQ Section

    Q: What caused PEPE’s price surge?
    A: Trump’s Truth Social post containing a Pepe-related image triggered speculative buying.

    Q: What are the key resistance levels for PEPE?
    A: The primary resistance target is $0.000026, representing a potential 100% gain from current levels.

    Q: How does this compare to previous meme coin rallies?
    A: While similar to Dogecoin’s reactions to Elon Musk’s tweets, the impact appears more limited in scale.

  • Cloud Mining Warning: BTC Holder’s $27,700 Profit Claim Raises Red Flags

    Cloud Mining Warning: BTC Holder’s $27,700 Profit Claim Raises Red Flags

    A recent claim of earning $27,700 in just 7 days through cloud mining has sparked concern in the cryptocurrency community, particularly as regulators continue to crack down on crypto investment schemes. While the purported profits may seem attractive during Bitcoin’s recent surge to all-time highs above $111,000, investors should exercise extreme caution.

    Critical Analysis of Cloud Mining Claims

    The promoted returns of up to 1.75% daily yield through cloud mining contracts raise significant red flags that warrant investor attention. Such returns are typically unsustainable and characteristic of potential Ponzi schemes rather than legitimate mining operations.

    Understanding Legitimate Cloud Mining

    Genuine cloud mining operations typically offer much more modest returns due to:

    • Equipment depreciation costs
    • Electricity expenses
    • Maintenance requirements
    • Market volatility impact

    Warning Signs to Watch For

    Several concerning elements appear in this promotion:

    • Unrealistic guaranteed daily returns
    • Pressure to recruit others
    • Promises of immediate profits
    • Lack of verifiable mining infrastructure

    SPONSORED

    Trade Bitcoin safely with institutional-grade security

    Trade Now on Defx

    How to Identify Legitimate Mining Operations

    When considering cloud mining investments, verify:

    • Company registration and licensing
    • Proof of actual mining facilities
    • Transparent fee structures
    • Realistic return projections
    • Clear risk disclosures

    Frequently Asked Questions

    Is cloud mining profitable in 2025?

    Legitimate cloud mining operations typically offer 5-15% annual returns, not daily returns.

    How can I verify a cloud mining platform’s legitimacy?

    Check regulatory registrations, physical infrastructure evidence, and independent audits.

    What are typical red flags for mining scams?

    Guaranteed returns, pressure to recruit, and unrealistic profit claims are common warning signs.

  • NFT Innovation: Performance Art Duo Makes Movement Collectible

    NFT Innovation: Performance Art Duo Makes Movement Collectible

    In a groundbreaking development for the NFT space, experiential artist duo Operator is revolutionizing the intersection of performance art and blockchain technology by transforming movement-based art into collectible NFTs. This innovative approach allows collectors to own choreographed performances as digital assets, marking a significant evolution in how we preserve and trade ephemeral art forms.

    Revolutionizing Performance Art Through Blockchain Technology

    The artistic duo, comprising Dejha Ti and Ania Catherine, is pioneering a new frontier in the NFT space by tokenizing their performance-based artworks. This groundbreaking initiative addresses one of the most challenging aspects of performance art: its traditionally temporary nature.

    How Movement Becomes Digital Asset

    Operator’s innovative approach involves capturing carefully choreographed movements and converting them into unique digital tokens. This process not only preserves the artistic performance but also creates a new category of collectible digital assets that bridges the gap between physical performance and blockchain technology.

    SPONSORED

    Trade NFTs with up to 100x leverage on perpetual contracts

    Trade Now on Defx

    Implications for the Future of Digital Art

    This development represents a significant milestone in the evolution of both performance art and NFT technology. By making movement collectible, Operator is opening new possibilities for artists to monetize and preserve their ephemeral works while creating unique investment opportunities for collectors.

    FAQ Section

    How do movement-based NFTs work?

    Movement-based NFTs capture performance art through digital recording and tokenization, creating unique blockchain-based assets that can be owned and traded.

    What makes these NFTs valuable?

    These NFTs combine the uniqueness of performance art with the permanence of blockchain technology, creating scarce digital assets that preserve otherwise temporary artistic expressions.

    Can collectors resell movement-based NFTs?

    Yes, like traditional NFTs, these performance art tokens can be traded on secondary markets, potentially appreciating in value over time.

  • XRP Price Tests $2.15 Support: Multi-Timeframe Analysis Signals Bear Trap

    XRP Price Tests $2.15 Support: Multi-Timeframe Analysis Signals Bear Trap

    XRP’s price action is showing critical weakness across multiple timeframes, with technical indicators suggesting a potential bear trap formation. As the sixth-largest cryptocurrency by market cap faces increased selling pressure, a comprehensive analysis reveals both bearish signals and potential bullish reversal scenarios that could reshape XRP’s trajectory in the coming weeks.

    In a notable development that connects to recent bullish predictions targeting $22, the current price action may be setting up for a significant reversal despite immediate bearish pressure.

    Technical Breakdown: Descending Triangle Formation

    Prominent crypto analyst Gowanus Monster has identified a bearish Descending Triangle pattern across multiple timeframes, with the measured move suggesting a potential drop to $1.90. However, this technical formation could be setting up a classic bear trap scenario, particularly as oversold conditions emerge.

    SPONSORED

    Trade XRP with up to 100x leverage on perpetual contracts

    Trade Now on Defx

    Key Support and Resistance Levels

    Current price action shows:

    • Critical support: $2.15
    • Major resistance: $2.25
    • Moving averages (5, 10, 20-period) aligned bearishly
    • RSI indicating oversold conditions
    • MACD remaining below signal line

    Volume Analysis and Market Structure

    Recent volume patterns suggest accumulation at lower levels, while the price structure maintains higher lows despite the apparent bearish setup. This divergence between price action and market structure could signal an imminent trend reversal.

    Expert Analysis and Predictions

    According to GemXBT’s analysis, while short-term indicators remain bearish, the confluence of oversold conditions and strong support levels could trigger a significant bounce. This aligns with growing institutional interest in XRP, potentially providing additional buying pressure.

    FAQ Section

    What are the key levels to watch for XRP?

    Primary support sits at $2.15, with major resistance at $2.25. A break below support could trigger a move to $1.90, while breaking resistance could signal a trend reversal.

    Is XRP currently oversold?

    Yes, the RSI indicates oversold conditions, suggesting a potential bounce or consolidation period ahead.

    What could trigger a bullish reversal?

    A combination of oversold conditions, strong support defense, and increased buying volume could catalyze a trend reversal.

  • Ethereum Price Tests $2,604 Support as Market Volatility Looms

    Ethereum Price Tests $2,604 Support as Market Volatility Looms

    Ethereum (ETH) has joined Bitcoin in bearish territory, with analysts warning of increased market volatility ahead. This synchronized decline mirrors the broader crypto market turbulence, raising concerns about potential price swings in the coming week.

    Market Analysis: ETH at Critical Support Level

    According to crypto analyst CRYPTOWZRD, Ethereum’s price action has reached a crucial juncture at the $2,604 support level. This price point could determine the direction of ETH’s next major move, with significant implications for traders and investors.

    SPONSORED

    Trade Ethereum with up to 100x leverage on perpetual contracts

    Trade Now on Defx

    Technical Indicators and Market Sentiment

    The daily chart shows:

    • Bearish daily candle formation
    • ETHBTC ratio showing weakness
    • Monthly candle closed bullish after five months of decline
    • Weekly timeframe remains indecisive

    Key Price Levels to Watch

    Critical support and resistance levels:

    Level Significance
    $2,604 Immediate resistance turned support
    $2,550 Secondary support level
    $2,650 Next resistance target

    Market Outlook and Trading Strategy

    While short-term indicators suggest caution, the medium to long-term outlook remains cautiously optimistic. Traders should consider:

    • Waiting for clear price action signals
    • Managing risk during increased volatility
    • Monitoring traditional market transitions

    Frequently Asked Questions

    What’s causing the current Ethereum price volatility?

    The volatility is attributed to broader market uncertainty, synchronized movements with Bitcoin, and the monthly market transition phase.

    What are the key levels to watch for Ethereum?

    The critical level is $2,604, with a break above potentially triggering further upside movement.

    How should traders approach the current market conditions?

    Experts recommend patience and careful position sizing during this period of increased volatility.

    As the market enters a crucial transition phase, traders should remain vigilant and prepare for potential sharp moves in either direction. The coming days could prove decisive for Ethereum’s short-term price trajectory.