Author: Smart Articles

  • Finding the best crypto hardware wallet in 2025. A detailed review.

    Finding the best crypto hardware wallet in 2025. A detailed review.

    Looking for the best hardware wallet in 2025? Here’s a quick breakdown of the top options based on security, features, and price:

    • Ledger Flex: Best for tech-savvy users and DeFi enthusiasts. Features a 2.84" E Ink touchscreen, supports 5,500+ assets, and costs $249.
    • ELLIPAL Titan: Prioritizes security with air-gapped technology and self-destruct features. Supports 10,000+ assets and is priced at $159.
    • Cypherock X1: Unique seedless recovery system using Shamir’s Secret Sharing with NFC cards. Supports 1,500+ assets and costs $199.
    • NGRAVE ZERO: Offers the highest security (EAL7 certification) and durable steel backups. Best for institutional investors, priced at $430.

    Quick Comparison Table

    Wallet Security Level Display Supported Assets Price (2025) Best For
    Ledger Flex CC EAL6+ 2.84" E Ink 5,500+ $249 Active traders, DeFi
    ELLIPAL Titan Air-gapped design 4" touchscreen 10,000+ $159 Security-focused users
    Cypherock X1 Shamir’s Secret Sharing 3.5" touchscreen 1,500+ $199 Long-term HODLers
    NGRAVE ZERO EAL7-certified 4" touchscreen 1,500+ $430 Institutional investors

    Each wallet caters to specific needs, from beginners to institutions. Read on to find the best one for you.

    The BEST Cold Wallets for 2025

    1. Ledger Flex
    Ledger Flex

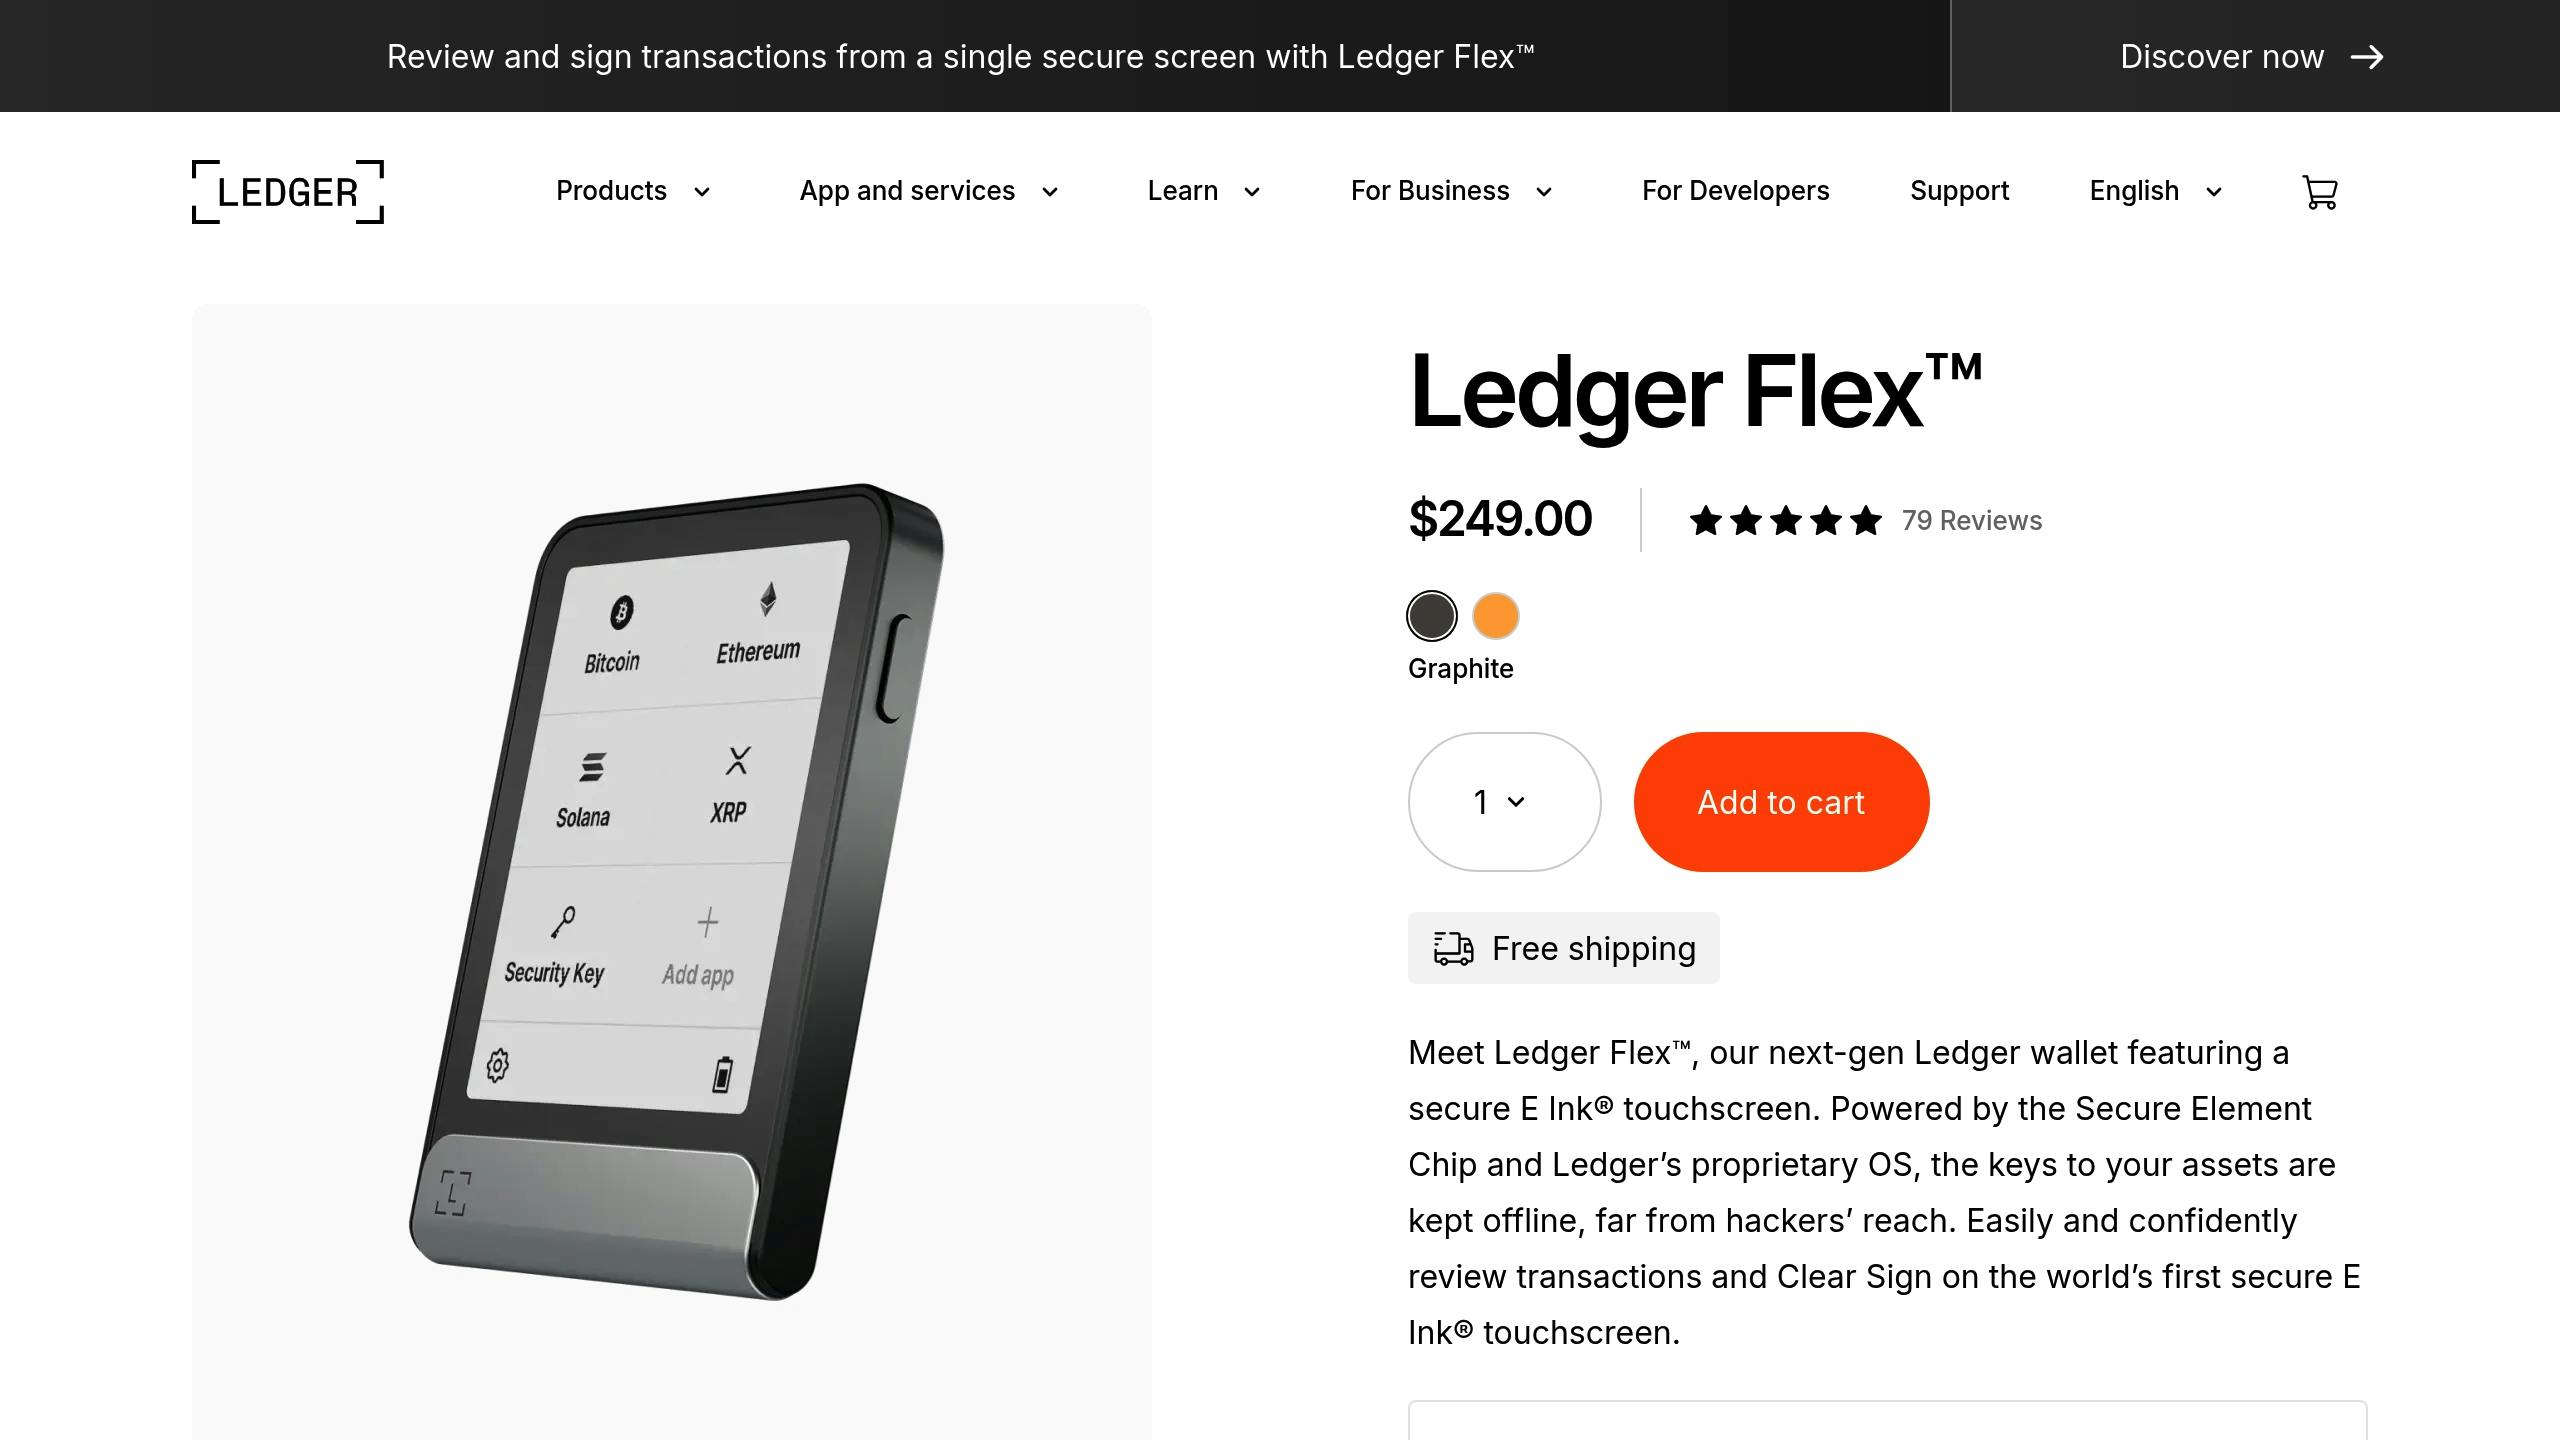
    The Ledger Flex is a step forward in hardware wallet design, blending top-notch security with a focus on ease of use. Its 2.84-inch E Ink touchscreen stands out, offering better visibility and energy efficiency compared to older wallet models [9]. This design directly addresses key factors like security, asset variety, and user experience.

    Supporting over 5,550 digital assets, the Flex caters to a wide range of investment needs [1]. It works with major cryptocurrencies, altcoins, and even NFTs, making it ideal for users managing diverse portfolios. The energy-efficient E Ink screen enhances the user experience while keeping the device secure by reducing its vulnerability to attacks.

    Feature Category Details
    Display 2.84" E Ink® touchscreen (16 grayscale)
    Connectivity USB-C, Bluetooth, NFC
    Build Material Aluminum frame with plastic back cover
    Price $249

    The Ledger Live app adds functionality by allowing users to track their portfolios and interact with DeFi platforms, all while keeping private keys offline. Multiple connectivity options – USB-C, Bluetooth, and NFC – ensure secure and convenient access to the wallet [9].

    One standout feature is the ability to display NFTs even when the wallet is turned off [1]. This is especially useful for NFT traders who need both accessibility and strong security.

    The Flex also integrates with protocols for yield farming and liquidity provision, combining advanced features with a strong security foundation [1][2]. This makes it a solid choice for users seeking both cutting-edge tools and dependable protection.

    2. ELLIPAL Titan
    ELLIPAL Titan

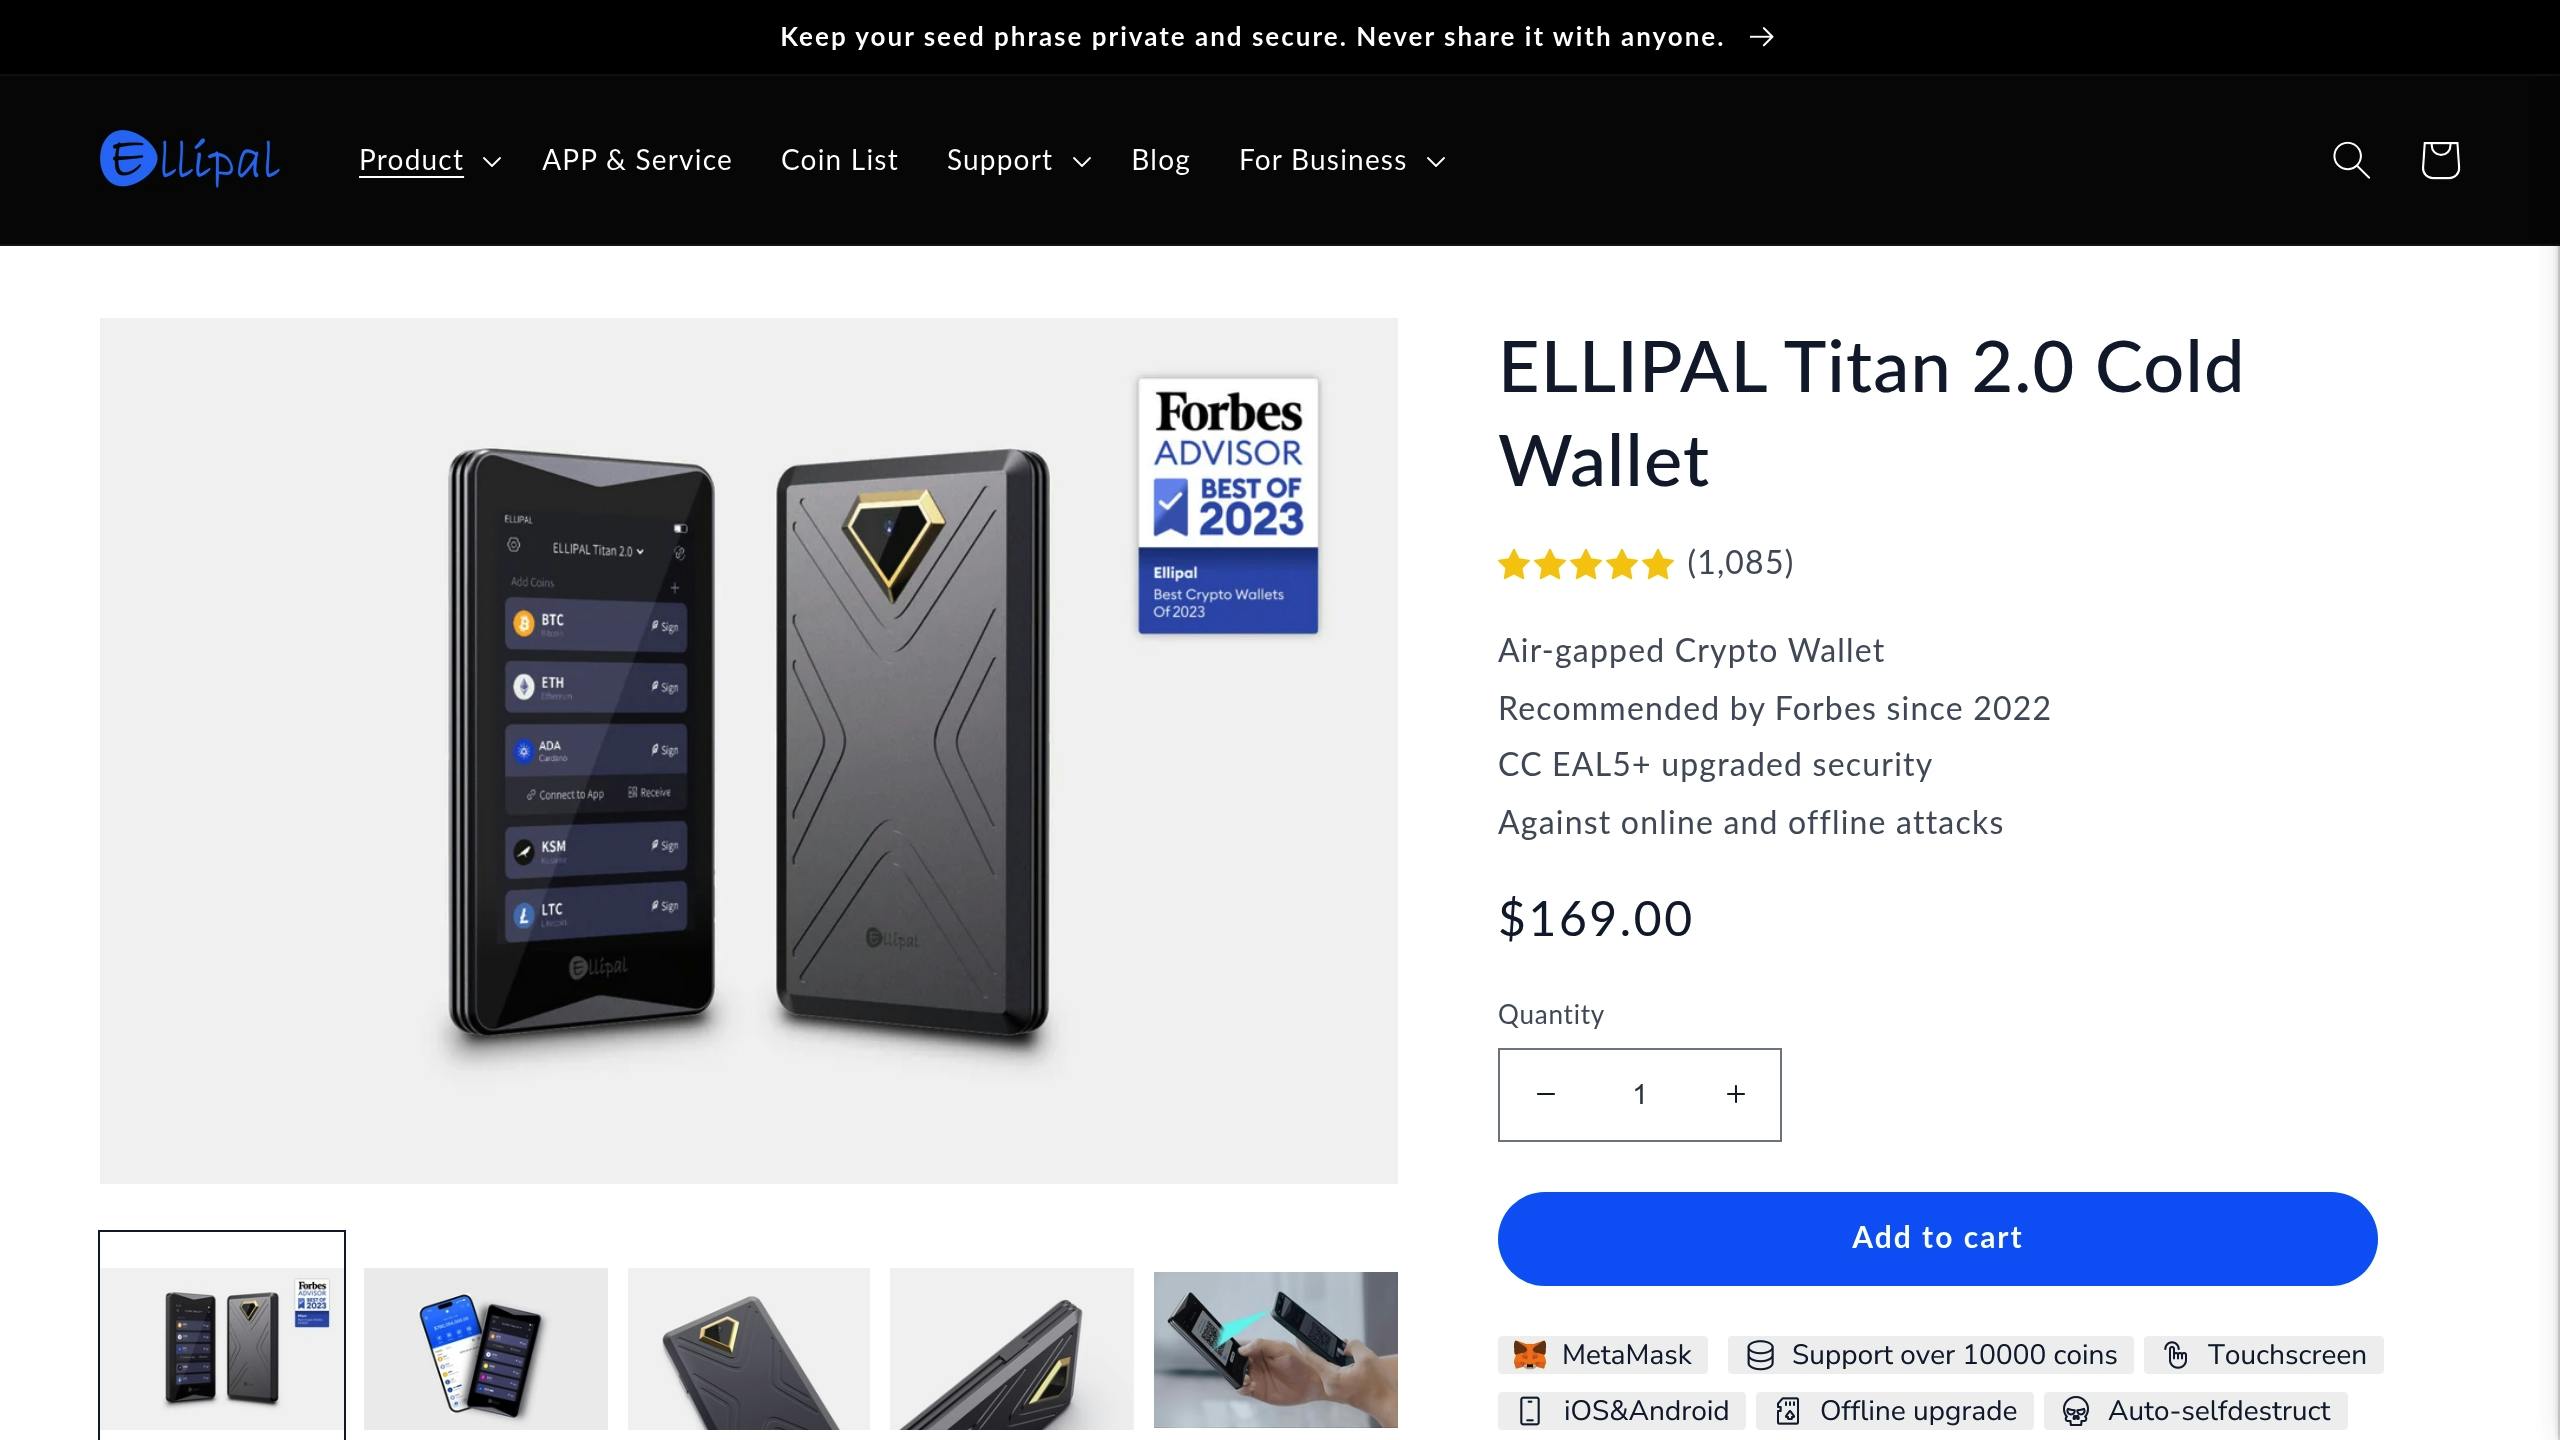
    The ELLIPAL Titan stands out with its focus on air-gapped technology, emphasizing complete isolation from external connections. Unlike the Ledger Flex, it avoids USB, Bluetooth, Wi-Fi, or cellular connectivity entirely. Instead, it relies on QR codes to transfer data, keeping private keys offline and secure [2][7].

    This hardware wallet has a 4-inch touchscreen display encased in a sturdy metal body, offering both durability and ease of use [2].

    Feature Specification
    Display 4-inch touchscreen [7][11]
    Dimensions 118 x 66 x 9.7 mm [11]
    Battery Life Up to 14 days standby [11]
    Supported Assets Over 10,000 cryptocurrencies [1]
    Price $159 (2025) [11]

    One of its standout features is a built-in self-destruct mechanism that wipes all data if tampering is detected, making it a strong choice for individuals managing high-value assets [2]. The Titan also supports secure DeFi interactions by approving transactions through air-gapped QR codes.

    The wallet’s interface is highly intuitive, comparable to modern smartphones [2], and includes a built-in cryptocurrency exchange for asset swaps within its ecosystem [10]. However, updates must be installed manually via an SD card, as the device doesn’t allow wireless patching [1].

    The ELLIPAL Titan has earned a 4.5/5 rating from over 1,200 Amazon reviews as of February 2025 [8]. Its compatibility with Layer 2 solutions like Polygon and Optimism [10] ensures it stays relevant for blockchain scaling needs, aligning with the focus on future-proofing.

    3. Cypherock X1
    Cypherock X1

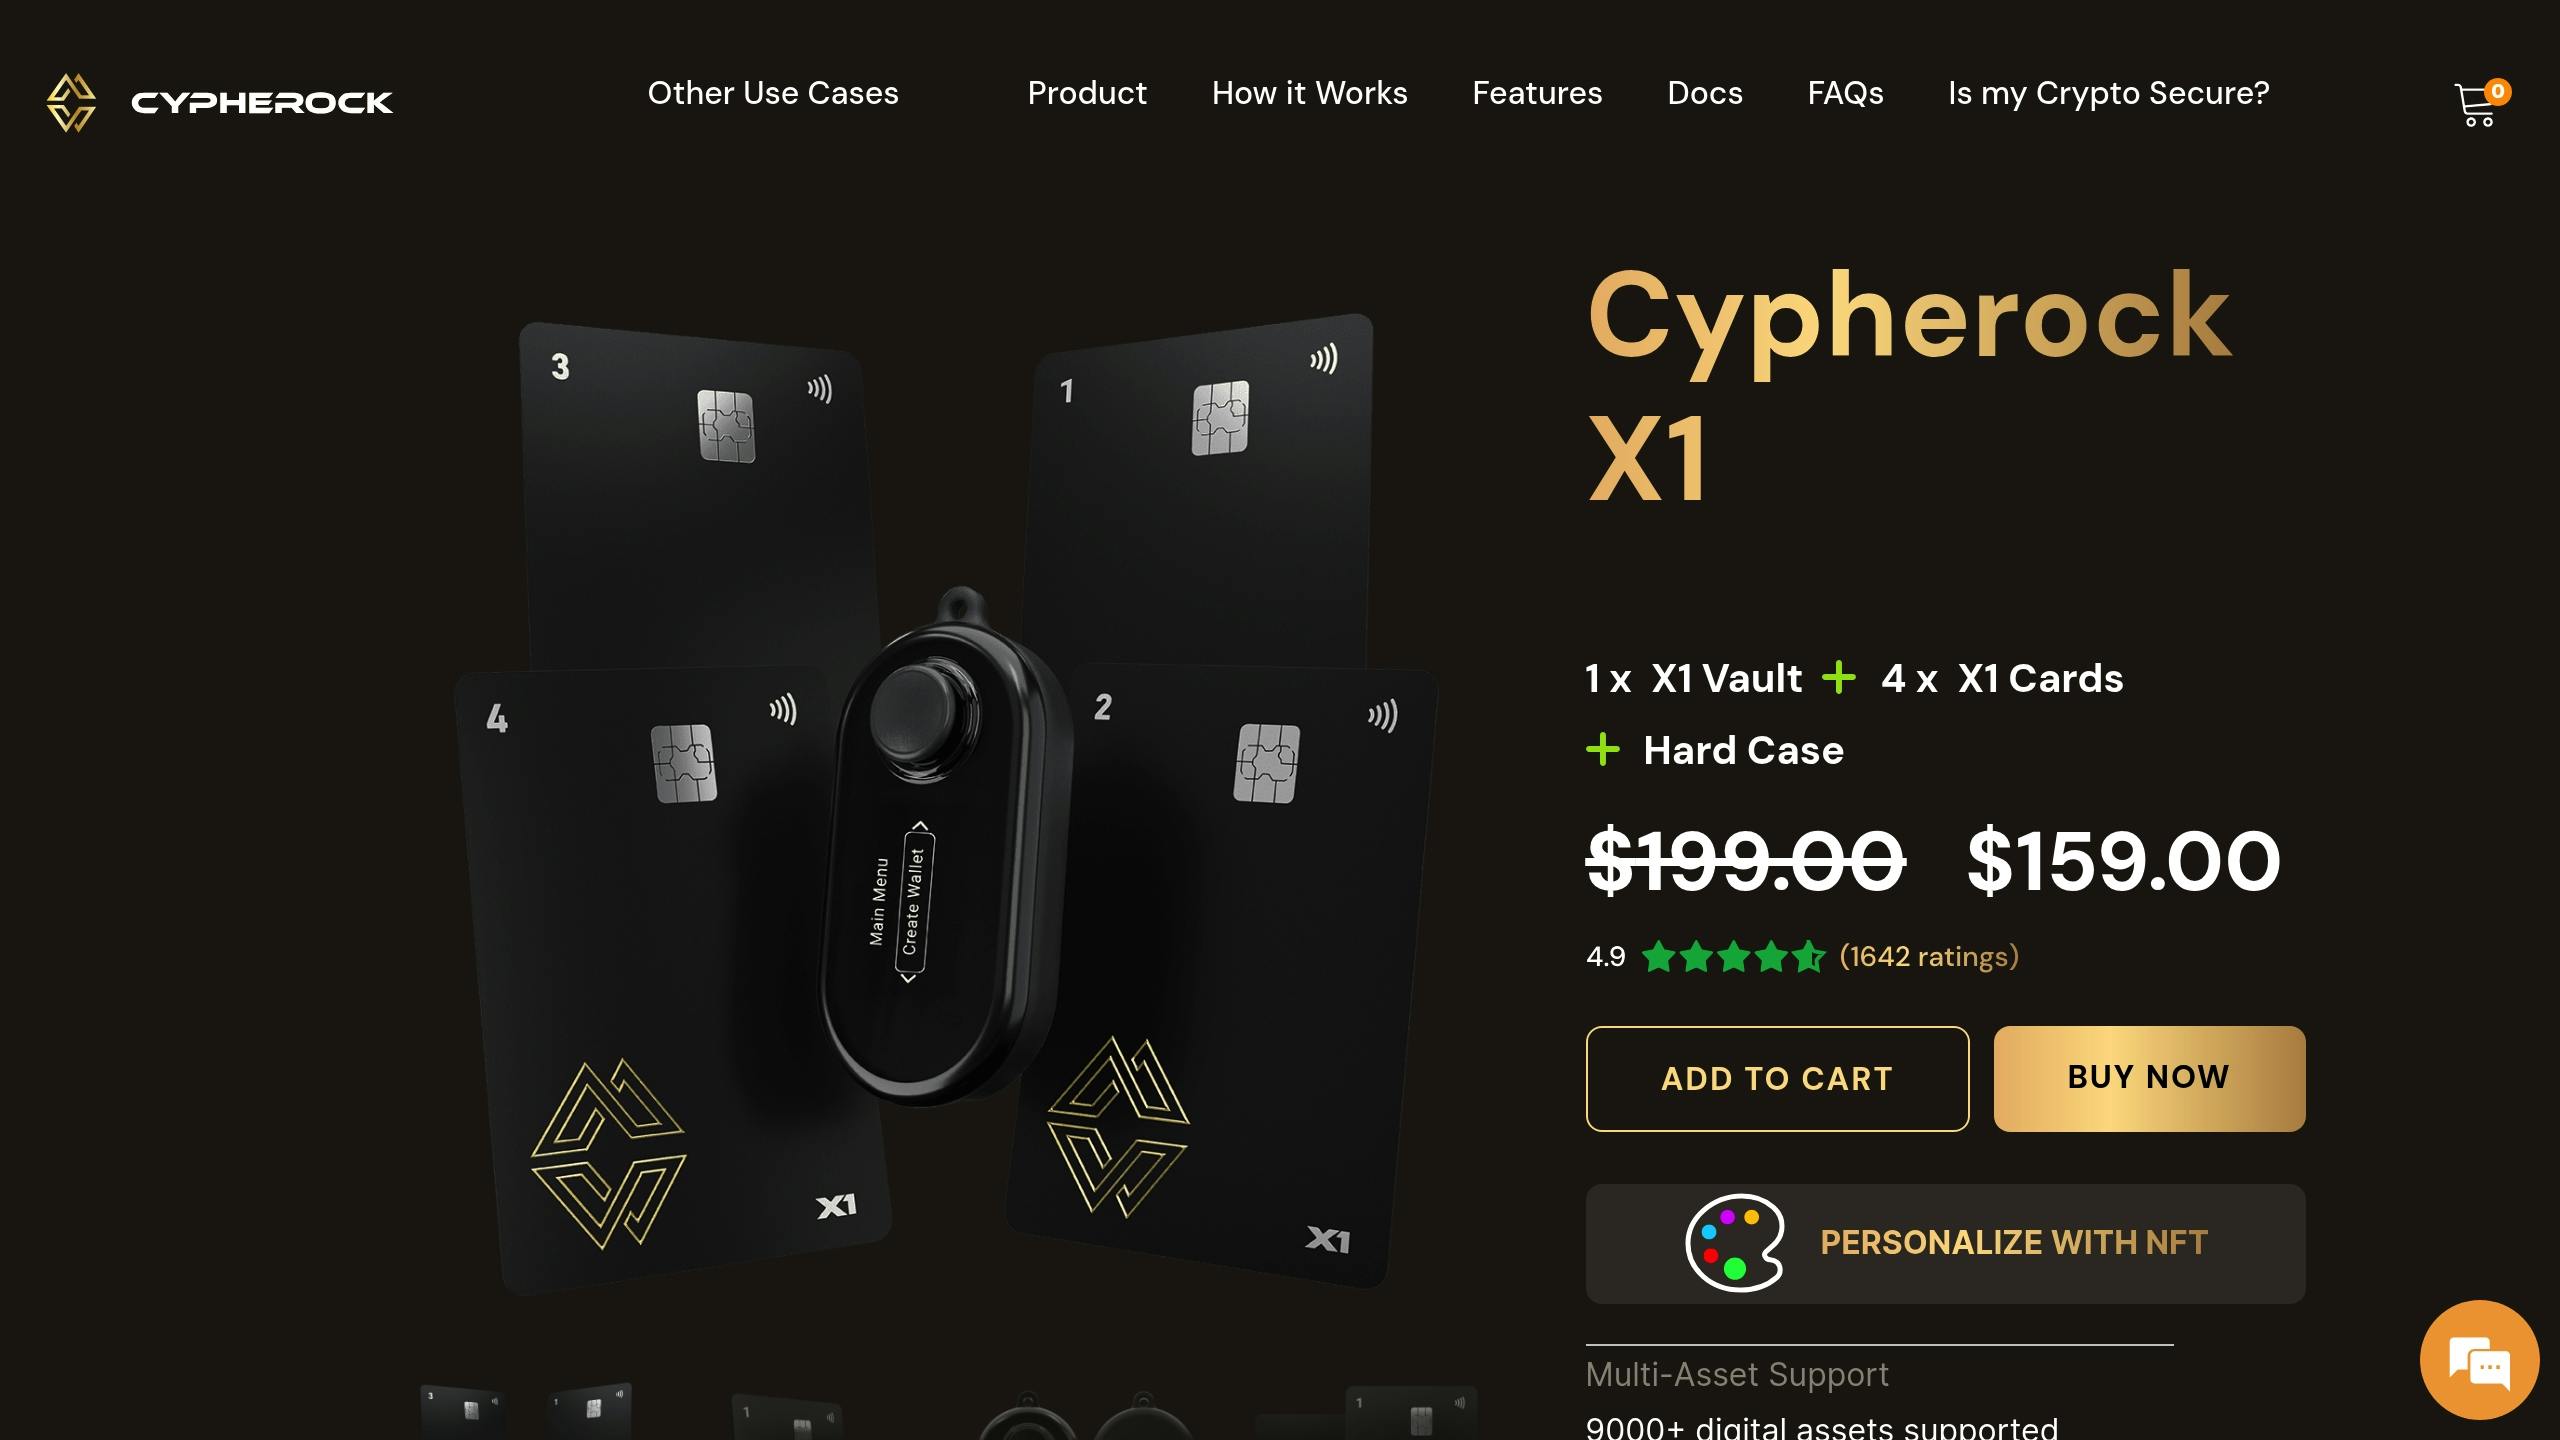
    Cypherock X1 takes a different approach to crypto storage by completely removing the need for seed phrases, tackling a common weakness in key management. Instead, it uses the Shamir’s Secret Sharing (SSS) protocol to split private keys across four NFC cards. This design reduces the risk of a single point of failure while still allowing recovery through physical card combinations [6][7].

    Feature Specification
    Display 3.5-inch touchscreen [2]
    Supported Assets 1,500+ cryptocurrencies [6][2]
    Price $199 (2025) [2]

    The device is built with EAL 5+ certified chips, NFC-based air-gapping, and hardware resistant to electromagnetic pulses. Unlike QR-based systems, it uses NFC card authentication for air-gapped security. Additional protections include AES-256 encryption and a casing designed to withstand physical tampering. Its EAL 5+ chip sets a high bar for commercial security [1][4].

    For DeFi users, the Cypherock X1 integrates with WalletConnect, allowing secure interaction with decentralized exchanges while maintaining the benefits of cold storage [4][5]. The companion app uses QR codes for asset management, ensuring security remains intact [2][5]. An inheritance feature lets users assign beneficiaries for their digital assets, adding another layer of utility [1][4].

    The card-based system is also forward-thinking, addressing potential regulatory needs for asset recovery solutions. Automatic security updates keep it aligned with the latest DeFi standards. However, its semi-open-source firmware has raised some transparency concerns, even though the device has undergone audit certifications [4].

    sbb-itb-dd9e24a

    4. NGRAVE ZERO

    NGRAVE ZERO

    NGRAVE ZERO stands out in 2025 as one of the most secure wallets, boasting an EAL7 certification – the highest security rating in the industry [6][2].

    Feature Specification
    Display 4-inch touchscreen [2]
    Security Level EAL7 certification [6][2]
    Supported Assets 1,500+ cryptocurrencies [6]
    Price $430 [6]

    Instead of Cypherock’s NFC-based approach, NGRAVE takes a different route with its proprietary biometric security system, BASH, and a tamper-proof design [2]. Its key generation process combines user biometrics with environmental data to ensure random and secure key creation [3]. For long-term holders, NGRAVE addresses backup concerns with GRAPHENE – a stainless steel plate system designed to protect recovery phrases from fire and water damage [6].

    The ZERO also integrates seamlessly with DeFi platforms via its companion app, LIQUID. The app manages transaction broadcasting while keeping the main device offline for added security [6]. The wallet employs quantum-resistant encryption and supports multi-device multi-signature setups, making it ideal for high-value transactions.

    Its 4-inch touchscreen and QR code functionality strike a balance between ease of use and security, though its larger size (126 x 68 x 10 mm) makes it less portable. Priced at $430, the wallet’s advanced security and user-friendly design justify the premium cost. It has received a strong 4.7/5 rating on Trustpilot [1].

    However, the need for physical replacement to perform major updates may inconvenience users who frequently upgrade their devices [6].

    Direct Comparison: Strengths and Limitations

    This table breaks down how each solution matches the needs of different user profiles based on our evaluation criteria.

    Feature Category Ledger Flex ELLIPAL Titan Cypherock X1 NGRAVE ZERO
    Security Certification CC EAL6+ Air-gapped design Shamir’s Secret Sharing EAL7 (Highest)
    Key Features Interchangeable security modules, E Ink display Air-gapped system, Self-destruct mechanism Distributed key storage, NFC cards Steel plate backup, Perfect Key generation
    Supported Assets 5,500+ 10,000+ 1,000+ 1,500+
    Price (2025) $279.99 $169 $199 $398
    Best For Tech-savvy users, DeFi enthusiasts Security-focused users Long-term holders Institutional investors

    Ledger Flex is ideal for users who value flexibility. Its interchangeable security modules and extensive DeFi integrations make it a strong choice for active portfolio managers and tech-savvy traders [11].

    ELLIPAL Titan prioritizes security with its air-gapped design and self-destruct mechanism, which adds an extra layer of protection against physical tampering. This makes it a top pick for users focused on safeguarding their assets [7].

    Cypherock X1 takes a unique approach to long-term storage with its distributed key system. Using NFC cards, it requires 3 out of 5 cards for recovery, ensuring secure and reliable access. Its audited firmware strikes a balance between transparency and protection, making it an excellent option for HODLers [12].

    NGRAVE ZERO offers the highest security rating (EAL7) among crypto devices. Its key generation process uses environmental randomness, and the steel plate backup ensures durability. This device is tailored for institutional investors managing large portfolios, as highlighted in our security certification analysis [8].

    Each device addresses specific user needs: Ledger Flex caters to active traders with its DeFi capabilities, NGRAVE ZERO provides top-tier security for institutional users, ELLIPAL Titan combines affordability with strong protection, and Cypherock X1 reimagines long-term storage for crypto enthusiasts.

    Best Picks for Different Users

    Here’s how these wallets cater to various user needs:

    For Beginners
    The Ledger Flex is a great option for those new to crypto. Its simple interface, paired with the Ledger Live app, makes managing crypto straightforward [1].

    For Active Traders
    If you trade frequently, you’ll want a wallet that combines security with ease of access. The ELLIPAL Titan fits the bill, thanks to its air-gapped security and compatibility with DeFi platforms [5].

    For Long-term Investors
    For those focused on long-term security, the NGRAVE ZERO is worth considering. Its air-gapped design and fireproof steel backups provide peace of mind for multi-year holdings. Plus, it boasts NGRAVE’s EAL7 certification, ensuring top-tier protection [1][2].

    For Privacy and Institutional Users
    Privacy-conscious users and institutions can rely on the NGRAVE ZERO’s biometric security. Meanwhile, the Cypherock wallet offers an NFC card system for those needing anonymous recovery options. At $430, the NGRAVE ZERO stands out with features like device-generated randomness and a tamper-proof build, making it a strong choice for institutional use [1][2].

    For Multi-Currency Enthusiasts
    If you manage a wide range of cryptocurrencies, the ELLIPAL Titan is a solid pick. It works seamlessly with DeFi platforms, making it ideal for diverse portfolios [1][5].

    Choose a wallet that fits your specific needs and preferences.

    FAQs

    Which hardware wallet is the best for crypto?

    Based on a detailed comparison of security certifications and use cases, here are the top picks:

    Wallet Best For Key Feature
    Ledger Flex Overall Choice Advanced DeFi Integration
    Cypherock X1 Backup & Recovery Distributed Key Storage
    NGRAVE ZERO High Security EAL7-certified cold storage with GRAPHENE backups

    For most users, Ledger Flex strikes a great balance between security and ease of use. Cypherock X1 stands out for its innovative recovery system, using distributed key storage to eliminate single points of failure. Meanwhile, NGRAVE ZERO offers unmatched security, making it ideal for managing large, institutional-level crypto portfolios.

    NGRAVE ZERO’s EAL7-certified security architecture, combined with GRAPHENE backups, sets a new bar for cold storage protection. Cypherock X1, on the other hand, introduces a unique approach to wallet security by spreading key storage across multiple locations.

    Related Blog Posts

  • What is FUD?

    What is FUD?

    FUD stands for Fear, Uncertainty, and Doubt – a tactic often used in cryptocurrency markets to spread negative sentiment, causing panic and price swings. It impacts traders, especially those using leverage on decentralized exchanges (DEXs), by triggering rapid liquidations and market volatility.

    Key Takeaways:

    • Definition: FUD manipulates market behavior through rumors or negative news.
    • Impact: Causes sharp price drops, liquidation cascades, and increased trading risks.
    • Examples: Binance‘s SEC troubles in 2023 led to a 20% BNB drop; Ripple‘s 2020 lawsuit erased $17 billion in XRP market cap.
    • Defense Strategies:
      • Use tools like on-chain metrics and social sentiment analysis.
      • Adopt safety measures like trailing stop-losses and tiered take-profits.
      • Verify information through reliable sources and blockchain data.

    Understanding FUD and preparing with the right strategies can help traders minimize losses and navigate volatile markets effectively.

    FUD Risks in DEX Leverage Trading

    Market Swings and Trader Psychology

    Leveraged traders on decentralized exchanges (DEXs) tend to react more strongly to market news compared to spot traders – about 28% more, in fact [1]. This heightened sensitivity, combined with leverage, often leads to rash decisions during uncertain times. When markets are volatile, this psychological strain adds to the risks already present in leveraged trading systems on DEXs.

    Market Manipulation Through FUD

    Decentralized systems are particularly vulnerable to manipulation through fear, uncertainty, and doubt (FUD). The decentralized nature of DEXs creates opportunities for bad actors, as demonstrated by the 2020 bZx protocol attacks. In this case, attackers exploited price feeds using flash loans, walking away with over $954,000 [2].

    "The permissionless nature of DEXs makes them particularly vulnerable to manipulation through FUD. During periods of high uncertainty, trading volumes can spike by 200-300%, creating opportunities for bad actors to exploit market fear." [8]

    Some common manipulation tactics include:

    • Spreading false claims through coordinated social media efforts
    • Triggering flash crashes with large sell orders
    • Inflating trading activity through wash trading

    Liquidation and Price Impact

    FUD-induced liquidation cascades are a major threat to leveraged traders. A stark example is the March 2020 "Black Thursday" crash, where Maker’s DAI stablecoin lost its peg, resulting in $8.32 million in liquidations [6]. These events typically unfold in four stages:

    Phase Impact Result
    Initial FUD Rapid price drop Increased selling pressure
    First Wave Liquidation triggers Forced selling begins
    Cascade 20-30% price drop Mass liquidations
    Peak Impact Extreme price deviations Complete position losses

    Leverage: How it Could Wreck Crypto Markets

    sbb-itb-dd9e24a

    FUD Defense Methods

    Blockchain analytics platforms provide traders with insights to identify and respond to FUD-driven market events before they escalate.

    Blockchain Analysis Tools

    Glassnode reported a 27% spike in Bitcoin outflows before a May 2023 FUD event, enabling traders to take action and reduce losses by 12% [8].

    Some essential tools for monitoring include:

    • On-chain metrics and exchange flow data
    • Social sentiment analysis and tracking whale activity
    • Exchange inflow/outflow patterns
    • DEX activity and wallet tracking

    These tools are especially useful when paired with strategies to safeguard trading positions.

    Position Safety Measures

    For DEX traders navigating FUD-induced market swings, the following strategies can help:

    • Trailing Stop-Loss Strategy: Set adjustable stop-losses that follow price movements, maintaining a buffer of 5-10% based on market volatility [10].
    • Tiered Take-Profit System: Secure partial profits by closing 25% of your position at 10% gains, another 25% at 20%, and letting the remaining 50% run with trailing protection [9].

    Information Checking Steps

    While automated tools are helpful, manual verification remains crucial to avoid acting on unreliable information:

    • Source Validation:

      • Check official project announcements.
      • Cross-reference multiple credible news outlets.
      • Use blockchain explorers to verify transaction claims.
    • Data Analysis:

      • Confirm market trends with on-chain metrics.
      • Compare social sentiment with actual price movements.
      • Monitor whale wallet activities that could signal manipulation.

    Relying on verified on-chain data rather than social media rumors provides a clearer picture of market conditions. Using multiple tools together ensures better accuracy when assessing FUD events [8].

    FUD Example: Regulation News Impact

    The March 2023 regulatory FUD event offers a clear example of how to put defense strategies into action.

    How Regulation Rumors Spread

    In March 2023, rumors about the SEC planning to ban retail crypto staking spread like wildfire. These rumors, based on misinterpreted SEC comments, quickly gained traction on crypto social media and news platforms within hours [1][4].

    The impact was immediate: major cryptocurrencies dropped 8-12% on decentralized exchanges (DEXs) and 10-15% on centralized exchanges (CEXs). Meanwhile, DEX trading volumes spiked by 30-40% within just six hours [2][6]. This behavior aligned with the liquidation cascade model discussed earlier.

    DEX vs CEX Response

    The event highlighted how DEXs and CEXs handle such situations differently. For instance, dYdX, a prominent DEX, acted swiftly to safeguard its users:

    Platform Type Response Time Volume Increase Price Drop Recovery Time
    DEX (dYdX) Under 5 minutes 30-40% 8-12% 12 hours
    CEX 15-30 minutes 20-25% 10-15% 18-24 hours

    dYdX’s quick response included measures such as boosting liquidity, sending real-time alerts to users, and adjusting liquidation parameters to prevent unnecessary closures [3].

    Key Trading Insights

    Traders who followed the safety measures outlined earlier managed to navigate the situation effectively:

    • Position Adjustments: Those who reduced leverage from 10x or more to 3-5x saw far fewer liquidations during the peak of the volatility [12].
    • Market Recovery: Within four hours of the rumors being debunked, asset prices recovered as much as 60-70% of their losses, showing the importance of disciplined trading [7].
    • Informed Decisions: Usage of blockchain analytics tools by dYdX traders increased by 25%, enabling smarter, data-backed decisions [11].

    This incident demonstrated the crypto market’s growing ability to handle shocks. Decentralized platforms like dYdX showed quicker recovery times compared to their centralized counterparts, reinforcing the advantages of DEXs in managing FUD-driven scenarios.

    Summary: FUD-Resistant Trading

    Handling FUD (Fear, Uncertainty, and Doubt) effectively requires a mix of verified information, risk management, and emotional discipline. Traders who prepare with these tools are better equipped to handle market volatility. A great example of this was during the March 2023 regulation rumors, where informed and disciplined traders avoided panic-driven liquidations.

    Key strategies for building FUD resistance include:

    • Verify information: Always cross-check details with multiple trustworthy sources to avoid reacting to false stories.
    • Stick to pre-defined rules: Emotional trading often leads to mistakes. Having clear trading rules helps you stay rational during chaotic market conditions.
    • Treat rumors as a signal, not a trigger: Use them as a cue to investigate further, rather than acting immediately, to protect your capital.

    The earlier discussion on decentralized exchange (DEX) strategies, like dYdX’s quick response systems, highlights how structured market analysis can turn uncertainty into opportunity. The March 2023 case study showed how sticking to systematic strategies helped traders stay steady during extreme market swings [5][9]. By staying disciplined and analytical, traders can transform uncertainty into a tactical edge.

    Related Blog Posts

  • Good tokenmonics/bad tokenomics. How does tokenomics design affect the long term price action of a token

    Good tokenmonics/bad tokenomics. How does tokenomics design affect the long term price action of a token

    Tokenomics can make or break a cryptocurrency. Well-designed tokenomics drive price stability, growth, and long-term success. Poorly designed tokenomics, on the other hand, lead to volatility, loss of trust, and even project failure.

    Key Takeaways:

    • Strong Tokenomics:
      • Controlled Supply: Fixed or deflationary models (e.g., Bitcoin, Ethereum post-EIP-1559) create scarcity and value.
      • Utility: Tokens with real use cases (e.g., Binance Coin for trading fees) sustain demand.
      • Fair Distribution: Transparent schedules and community-focused allocations prevent price manipulation.
    • Weak Tokenomics:
      • Uncapped Supply: Inflationary tokens (e.g., Dogecoin) face constant downward pressure.
      • Centralized Ownership: Large holders selling can crash prices.
      • Limited Utility: Tokens without practical use cases (e.g., BitConnect, TITAN) often fail.

    Quick Comparison:

    Aspect Strong Tokenomics Weak Tokenomics
    Supply Model Fixed/deflationary (e.g., Bitcoin) Unlimited/inflationary (e.g., Dogecoin)
    Utility Real-world use cases (e.g., Chainlink) Speculative only (e.g., TITAN)
    Distribution Fair and transparent (e.g., Uniswap) Centralized or hidden schedules
    Price Stability High during market downturns Low, prone to crashes

    To make smarter investment decisions, always analyze a token’s supply, utility, and distribution model. Strong tokenomics create long-term value, while weak designs often lead to collapse.

    How To Properly Evaluate Crypto Tokenomics

    1. Strong Token Design

    A solid token strategy is built on three key elements: controlled supply, practical use cases, and fair distribution.

    Managing supply is crucial for price stability. Ethereum’s adoption of EIP-1559 in 2021 is a prime example. By burning over 2.9 million ETH, Ethereum significantly boosted its market capitalization, which reached $417.87 billion (Source: Ethereum.org, 2022 Annual Report).

    Creating demand through practical use cases is just as important. Binance Coin (BNB) is a great example of this, offering:

    • Trading fee discounts for over 15 million users
    • Governance participation for 1.2 million token holders
    • Cross-chain gas fee payments, with 12.6 million daily transactions [4]

    Fair distribution also helps maintain price stability. Uniswap’s token distribution highlights this well. By allocating 60% of UNI tokens to its community and airdropping 400 UNI to early users, Uniswap achieved a market capitalization of $7.33 billion [1][4].

    Beyond distribution, automated mechanisms like burn-and-mint equilibrium (BME) introduce scarcity tied to usage. Inspired by Ethereum’s supply management, BME adjusts token supply based on activity metrics [4].

    Transparency in token release schedules is another factor in price stability. Binance’s quarterly BNB token burns and Uniswap’s vested team allocations are excellent examples of this approach [4][5].

    sbb-itb-dd9e24a

    2. Weak Token Design

    Strong tokenomics help maintain stability, but weak designs can lead to systemic risks and even project failure. Poorly structured tokenomics often result in price instability, eroding trust and causing significant market losses – like the $40 billion market cap destruction seen in some cases [4].

    Problematic Supply Management

    A poorly managed or uncapped token supply is a common issue. Projects with infinite supply, such as pre-EIP-1559 Ethereum and Dogecoin, often face constant inflationary pressure [6]. Without mechanisms like token burns or effective supply controls, these tokens struggle to retain value and avoid market oversaturation [3].

    Distribution Imbalances

    Centralized token ownership poses a major risk to price stability. When a small number of wallets hold most of the supply, it opens the door to pump-and-dump scenarios and undermines trust [5]. A clear example of this occurred during the ICO boom of 2017-2018, when many projects failed as early investors dumped their holdings after vesting periods ended [5].

    The effects of weak distribution patterns are clear:

    Distribution Issue Impact on Price Action
    Centralized Ownership Sudden price crashes when large holders sell
    Rapid Token Unlocks Oversupply in the market, leading to selling pressure
    Hidden Vesting Schedules Unpredictable supply increases causing volatility
    Limited Community Allocation Lower adoption rates and weaker engagement

    Limited Utility and Governance

    Tokens that serve no real purpose beyond speculative trading often fail. For instance, BitConnect (BCC) and TITAN collapsed due to their lack of practical use cases [1][5]. Iron Finance‘s TITAN token, which fell to nearly zero, is another example – it lacked substantial utility beyond yield farming [5].

    Flawed Incentive Structures

    Misaligned incentives are another hallmark of weak tokenomics. These designs often prioritize short-term speculation over long-term value. SafeMoon, for example, has faced issues because its model relies heavily on trading volume and speculative behavior rather than creating sustainable utility [2].

    These common flaws often signal impending failure:

    • Excessive initial supply without mechanisms to reduce it
    • No clear utility beyond speculation
    • Lack of transparency in vesting schedules
    • Absence of price stability measures
    • Poor liquidity planning

    When these issues combine, they create a destructive cycle: investor confidence drops, liquidity dries up, volatility spikes, and trust erodes further [4].

    Direct Comparison: Strong vs Weak Tokenomics

    The principles of tokenomics become crystal clear when you look at actual case studies from the crypto world:

    Real-World Examples Analysis

    Take Bitcoin (BTC) and BitConnect (BCC) as prime examples of how tokenomics design can make or break a project:

    Feature Bitcoin (BTC) BitConnect (BCC)
    Supply Model Fixed cap at 21M Unlimited, unclear issuance
    Utility Scope Global payment network, store of value Lending specific to its platform
    10-Year Price Trend +150,000% growth [4] -100% (complete collapse) [5]

    Supply and Utility Impact

    Consider SHIBA INU, which launched with an enormous supply of 589 trillion tokens but lacked a burn mechanism or meaningful use beyond meme-driven speculation. This combination led to a 92% price drop from its 2021 highs [4]. When supply is excessive and utility is minimal, downward price pressure becomes almost inevitable.

    Value Creation Through Utility

    On the other hand, tokens like Chainlink (LINK) take a different approach. LINK is required for essential network functions, which has driven a 320% price increase since 2020 [5]. This built-in demand for the token ensures its value is tied to real-world use rather than speculation.

    These examples clearly show that tokenomics design plays a huge role in market performance. Projects with controlled supply, practical utility, and fair distribution tend to deliver more stable prices and better growth compared to those without these features.

    The Role of Tokenomics in Long-Term Price Stability

    Tokenomics design plays a critical role in shaping the long-term performance of cryptocurrency projects. The difference between thriving projects and those that fail often comes down to how well their tokenomics are structured. Successful designs focus on controlled supply mechanisms, practical utility, and fair distribution. For example, Bitcoin’s enduring success contrasts sharply with Terra’s downfall, highlighting the importance of these factors.

    Research indicates that projects with strong tokenomics experience up to 73% greater price stability during market downturns [4]. This stability is driven by economic models that align the interests of the community and the token’s value.

    When analyzing tokenomics, investors should pay close attention to key metrics like these:

    Aspect Strong Features Weak Features
    Supply Model Fixed or decreasing supply Unlimited or poorly defined issuance
    Token Utility Multiple use cases within the ecosystem Limited or no practical utility
    Distribution Fair allocation with vesting schedules Over 20% allocated to team, no lockups
    Governance Community-driven decision-making Centralized control

    These comparisons show that effective tokenomics strike a balance between fostering growth and maintaining stability, ensuring the project’s long-term viability.

    Related Blog Posts

  • Crypto airdrops 101 – How to position yourself to receive the most value during airdrops season

    Crypto airdrops 101 – How to position yourself to receive the most value during airdrops season

    Crypto airdrops are events where blockchain projects distribute free tokens – sometimes worth thousands of dollars – to users who meet specific criteria. To maximize your chances of receiving these rewards, you’ll need the right strategies, tools, and wallet setups.

    Key Takeaways:

    • How to qualify: Engage with projects by staking, trading, or providing liquidity.
    • Best tools to track airdrops: Use platforms like AirdropAlert, CoinMarketCap, and DappRadar.
    • Wallet setup: Use secure, multi-chain wallets with consistent activity.
    • Avoid scams: Never pay upfront or share private keys.
    • Tax implications: Airdrops are taxable, so track fair market value and transactions.

    By staying active in crypto ecosystems and following these steps, you can position yourself to reap the most rewards during airdrop seasons.

    How to Find Airdrops in 2024

    Finding Quality Airdrop Opportunities

    Spotting legitimate and worthwhile airdrops takes a mix of reliable tools and solid research. The crypto world now offers several platforms and resources to help you track these opportunities.

    Best Tools for Tracking Airdrops

    The easiest way to find upcoming airdrops is by using established tracking platforms. AirdropAlert and CoinMarketCap are two trusted sources that provide curated lists of verified opportunities [7]. For broader coverage, DappRadar is a go-to for discovering new DeFi projects that might offer airdrops [7]. Tools like Etherscan and BscScan are also essential for verifying token contracts and tracking distribution events [2].

    Checking Project Quality

    Before jumping into an airdrop, it’s critical to assess the project’s credibility. Here are some key factors to consider:

    Evaluation Factor What to Look For
    Funding Sources Backing from well-known VCs or crypto investors [7]
    Smart Contracts Audits by firms such as CertiK or OpenZeppelin [2]
    Team Background A team with verifiable experience and a strong track record [3]
    Community Size Active participation on platforms like Discord, Telegram, and Reddit [3]

    Don’t forget to analyze tokenomics – look at how the tokens are distributed and their role within the project’s ecosystem [5].

    Following Project Updates

    For real-time updates, Twitter is your best bet, while platforms like Discord and Telegram allow for direct community interaction [2]. To stay on top of things, you can automate tracking with tools like IFTTT for alerts on key terms or project news [5].

    Pair these automated tools with manual efforts: keep an eye on blockchain explorers for activity, follow crypto news, and participate in project communities. A great example is the dYdX airdrop, where active users received tokens worth as much as $50,000 [2].

    Setting Up Wallets for Airdrops

    Once you’ve identified potential airdrops, it’s crucial to fine-tune your wallet setup to meet the eligibility criteria.

    Creating Cross-Chain Wallets

    Choose wallets that support multiple blockchains and emphasize security. Here are some key features to look for:

    Feature Purpose
    Multi-chain Access major blockchain networks
    Non-custodial Maintain full control of your assets
    DApp Browser Interact directly with protocols
    Hardware Support Integrate with cold storage for added security

    Consistent wallet activity can influence your reward tiers, so staying active is essential when targeting high-quality projects.

    Key Actions to Qualify

    Engaging meaningfully with protocols is a great way to position yourself for higher-value airdrops. Activities like staking and providing liquidity often earn better rewards due to their demonstration of long-term commitment [8].

    Here’s a breakdown of impactful activities:

    Activity Minimum Requirement Reward Potential
    Staking 2-4 weeks High
    Liquidity $100-$1000 Very High
    Governance 1-3 proposals Medium
    Bridging 5-20 transactions Medium-High

    Meeting Minimum Requirements

    Keep an eye on snapshot dates and ensure you meet the minimum activity thresholds. Most protocols require 30-90 days of consistent activity before taking their snapshots [2].

    "In 2023, the average value of crypto airdrops was estimated at $600-$1000 per qualified wallet" [4].

    To improve your chances of qualifying:

    • Stay active: Perform 5-20 transactions across protocols.
    • Track snapshots: Know when they occur to align your activity.
    • Use separate wallets: Dedicate specific wallets for airdrop farming to manage risks while staying active.

    This approach not only enhances your eligibility but also aligns with best practices for security and participation.

    sbb-itb-dd9e24a

    Getting More from Airdrops

    Once your wallet is set up, the next step is to focus on smart participation. This is where you can maximize rewards while keeping risks under control. Let’s break down some practical approaches.

    Participation Levels and Rewards

    How much you engage with a project often determines the size of your airdrop reward. For example, during the Arbitrum airdrop in September 2023, the most active 11% of users secured a massive 68.4% of the total rewards. Their secret? Higher transaction volumes and consistent activity over time [6].

    Tier Key Activities Reward Boost
    Basic Social follows 1x
    Active Trading, voting 2-3x
    Power User Liquidity, testing 4x
    Early Pre-launch activity 5x

    Boosting Results with Defx

    Defx

    Defx’s multi-chain platform is a powerful tool for improving your airdrop strategy. Here’s how it can help:

    • Cross-Chain Activity: Defx supports multiple blockchains, letting you diversify your trading and stay active across different networks. Its fast transaction speeds ensure you don’t miss out on opportunities.
    • Liquidity Provision: By participating in Defx’s liquidity pools, you show long-term commitment. Projects often prioritize liquidity providers when distributing rewards.

    Managing Token Claims

    Claiming tokens is just the beginning. What you do afterward can make or break your success. Here are some tips to handle your airdropped tokens wisely:

    • Market Timing: Keep an eye on token unlock schedules and market trends. Large unlocks can lead to price drops due to selling pressure.
    • Yield Opportunities: Use the tokens to generate returns, but stick to the separate wallet strategy for safety. Here are a few options:
    Strategy Returns Risk
    Governance Staking 5-15% APY Low
    Liquidity Mining 20-50% APY Medium
    Yield Farming 30-100% APY High
    • Portfolio Balance: Decide how much to sell immediately versus holding long-term. Base your decision on the project’s potential and current market conditions.

    Safety and Risk Management

    Maximizing rewards is only half the battle; protecting your assets is just as important. Without proper safeguards, the gains from your airdrop farming efforts could quickly disappear.

    Spotting Fake Airdrops

    Scammers are constantly evolving, and fake airdrops are one of their favorite tricks. In 2022, about 35% of all crypto scams were tied to fake token giveaways or fraudulent airdrops [5]. Be on the lookout for these warning signs:

    • Requests for upfront payments
    • Promises of guaranteed profits
    • Urgent pressure to act immediately

    Always double-check announcements on multiple verified channels and confirm the team’s credibility using blockchain explorers [1].

    Separate Wallets for Safety

    Having a clear wallet strategy is crucial for keeping your assets secure. A dedicated wallet setup works well alongside the cross-chain wallet strategy mentioned earlier. Here’s how you can organize it:

    Wallet Type Purpose
    Hardware Wallet Long-term holdings
    Hot Wallet Active trading
    Burner Wallet Testing airdrops

    Don’t forget to enable multi-factor authentication for an added layer of security [3].

    Airdrop Tax Rules

    Airdrops are treated as taxable income when received, according to IRS guidelines [2]. Here’s what you need to keep track of:

    Event Tax Implication Required Action
    Token Receipt/Sale Income tax + capital gains Record FMV (Fair Market Value) and sale timing
    Failed Claims Possible gas fee deductions Keep a record of failed claims

    Taking these steps ensures you protect the value you’ve worked hard to earn through your airdrop strategies.

    Conclusion

    The current airdrop landscape requires a mix of thorough research, technical know-how, and smart engagement strategies. As the cryptocurrency space evolves, projects are adopting more advanced distribution methods that reward real user involvement and long-term dedication.

    This shift highlights a deeper focus on community value. Instead of just looking at wallet balances, projects now assess user contributions in various areas:

    Focus Area Key Contribution
    Protocol Usage Regular transaction activity
    Community Impact Participation in governance and testing
    Network Support Providing liquidity and validation
    Development Submitting bug reports and suggesting improvements

    Take Uniswap and Optimism as examples. These projects show that success in the airdrop world is about more than just collecting tokens – active involvement in their ecosystems plays a crucial role. This trend rewards users who stick around and contribute meaningfully, rather than those aiming for quick gains.

    Looking ahead, airdrop strategies will likely continue to emphasize authentic engagement and ongoing participation. By using the wallet techniques and engagement tips discussed earlier – and balancing active involvement with careful risk management – you can position yourself to benefit from these evolving opportunities.

    FAQs

    How to avoid airdrop scams?

    Protecting yourself from airdrop scams starts with recognizing warning signs and taking the right precautions. Here’s a breakdown of what to watch out for and how to stay safe:

    Warning Sign What to Do
    Unsolicited Messages Stick to official project channels
    Urgency Claims Cross-check timelines on the official website
    Private Key Requests Never share your seed phrase or private keys
    Upfront Payments Steer clear of "pay-to-participate" offers

    Essential Security Tips:

    • Smart Contract Verification: Double-check contract addresses using blockchain explorers to ensure they’re legitimate.
    • SSL Certificate Checks: Before connecting your wallet, make sure the website uses a secure connection (look for "HTTPS" and a padlock icon).

    If you think you’ve encountered a scam, disconnect your wallet immediately and transfer your funds to a secure account. Don’t forget to report the incident to the appropriate authorities and share details within the community to help others avoid falling into the same trap. Always confirm legitimacy before getting involved. [7][9][10]

    Related Blog Posts

  • Polymarket and an introduction to Crypto prediction markets

    Polymarket and an introduction to Crypto prediction markets

    Crypto prediction markets, like Polymarket, let users trade tokens based on event outcomes, combining blockchain with forecasting. These platforms are part of the decentralized finance (DeFi) ecosystem, offering real-time probability estimates through crowd-driven trading.

    Key Takeaways:

    • How It Works: Users trade tokens (priced $0–$1) tied to "Yes" or "No" outcomes. Prices reflect the likelihood of events.
    • Core Features: Powered by smart contracts, oracles for event verification, and low-cost blockchain networks like Polygon.
    • Popular Markets: Include politics, cryptocurrency prices, sports, and entertainment.
    • Advantages: Decentralized platforms like Polymarket offer transparency, global access, and lower costs compared to centralized options.
    • Challenges: Regulatory hurdles, data feed security, and market volatility remain key risks.

    Quick Comparison: Centralized vs. Decentralized Prediction Markets

    Feature Centralized Markets Decentralized Markets
    Control Managed by a single entity Blockchain-based governance
    Verification Internal teams Oracle systems (e.g., UMA)
    Costs Fixed platform fees Gas fees + platform fees
    Access Region-restricted Open, global participation

    Polymarket stands out for its user-friendly design, low transaction costs, and diverse market options. However, users should be aware of risks like price swings and regulatory restrictions while exploring this growing space.

    Crypto Prediction Markets Explained

    Polymarket Platform Overview

    Polymarket

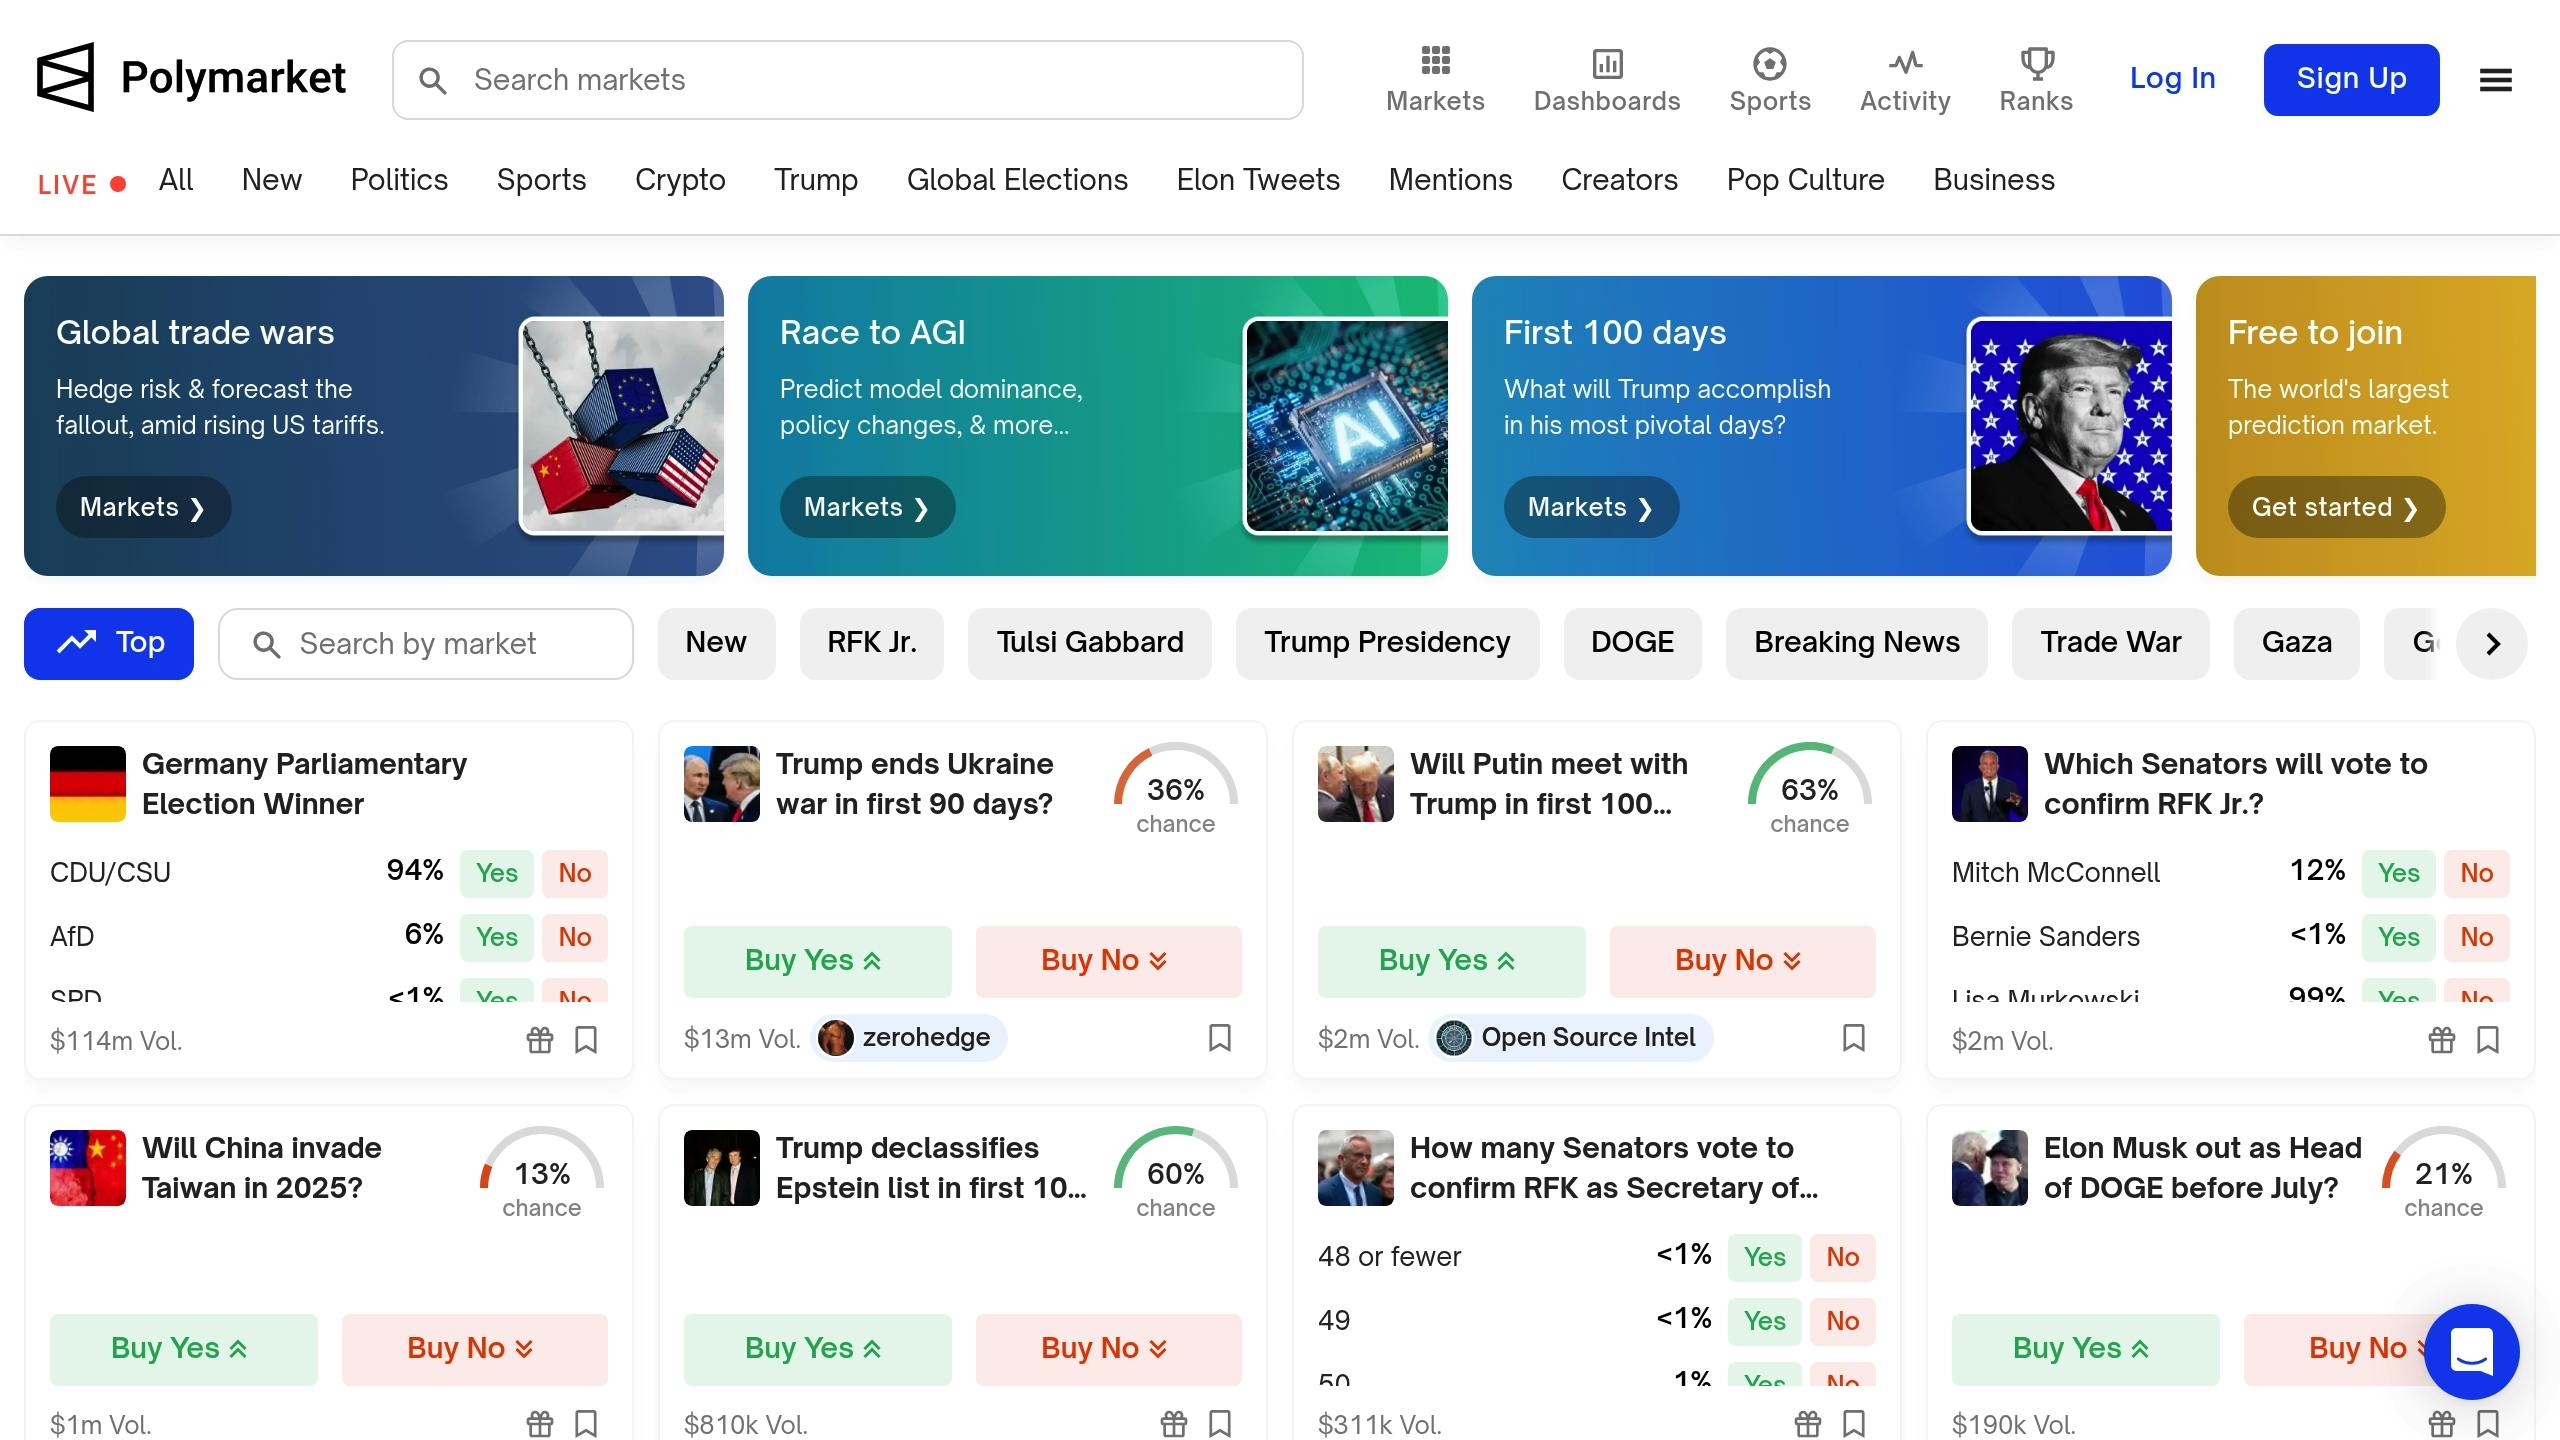
    Polymarket has established itself as a leading player in blockchain-based prediction markets, offering a unique approach to decentralized trading. By combining event derivatives with the principles of DeFi, Polymarket makes it possible to trade on the outcomes of real-world events.

    How Polymarket Works

    Polymarket operates as a decentralized platform for trading event derivatives, running on the Polygon network. This setup ensures low transaction costs while maintaining a seamless trading experience. All transactions on the platform are conducted in USDC (USD Coin), benefiting from Polygon’s reduced fees compared to Ethereum’s main network [1]. The use of ERC-1155 tokens allows users to participate in markets with greater flexibility, aligning with the broader concept of tokenization.

    Here are some of the platform’s key technical features:

    Component Details
    Oracle System Universal Market Access (UMA)
    Token Standard ERC-1155 on Polygon

    Market Types on Polymarket

    Polymarket provides a variety of market categories, enabling users to trade on binary outcomes tied to real-world events. These markets use USDC for transactions, offering a fresh angle to traditional crypto trading strategies. Popular market categories include:

    • Political elections
    • Economic indicators
    • Sports outcomes
    • Entertainment events
    • Financial metrics

    One standout example is the "Presidential Election Winner 2024" market, which saw exceptional activity. As of July 12, 2024, this market recorded nearly $250 million in bets [4].

    Platform Usage Stats

    Polymarket’s growth has been impressive, with data from October 2024 showcasing its expanding reach and user engagement:

    Metric Value Trend
    Monthly Trading Volume $2 billion Increasing
    Active Traders 191,000+ Steady growth
    Daily Active Users 30,000+ Record high
    Open Interest $46 million Growing

    June 2024 alone saw the platform attract 29,432 new users, maintaining an average of 3,590 daily active traders [4]. These figures highlight Polymarket’s growing influence in the decentralized prediction market landscape.

    Centralized vs Decentralized Markets

    Control and Verification Methods

    The main distinction between centralized and decentralized prediction markets lies in how they are governed. Centralized platforms are managed by a single entity, while decentralized ones rely on blockchain and smart contracts.

    Centralized platforms typically use internal teams to verify outcomes. In contrast, decentralized markets rely on blockchain-based oracle systems. For example, Polymarket uses the Universal Market Access (UMA) oracle system to ensure transparent and tamper-proof outcome verification [2]. This system builds on Polymarket’s earlier technical infrastructure, creating a system where market resolutions don’t require trust in a central authority.

    Advantages of Decentralized Markets

    Decentralized prediction markets bring several benefits that align with the principles of decentralized finance (DeFi). These include improved security, open access across the globe, and lower costs by cutting out intermediaries.

    Benefit Description Impact
    Self-Custody Users maintain direct control of assets Lowers counterparty risks
    Censorship Resistance Operates without central authority control Ensures market stability
    Global Access No location-based restrictions Encourages diverse participation
    Transparency Blockchain records all transactions Builds trust and verification

    Comparing Platforms

    The way centralized and decentralized prediction markets operate affects both user experience and platform functionality. Here’s a closer look at the differences:

    Feature Centralized Markets Decentralized Markets
    Transaction Speed Fast, near-instant settlements Dependent on blockchain speed
    Cost Structure Fixed platform fees Includes gas fees and platform fees
    Market Creation Controlled by the platform, traditional web User-driven, requires Web3 wallets
    Dispute Resolution Managed by internal support teams Automated through smart contracts

    Platforms like Polymarket have tackled scalability issues by leveraging Polygon’s Layer 2 solution. This approach allows Polymarket to handle large transaction volumes efficiently, proving that decentralized models can work effectively for large-scale prediction markets [2].

    sbb-itb-dd9e24a

    Common Market Applications

    Prediction markets are gaining traction through several practical uses that showcase their usefulness in everyday scenarios.

    Crypto Price Predictions

    One of the most active areas on Polymarket is cryptocurrency price prediction markets. These focus on specific price benchmarks or comparing the performance of different cryptocurrencies. For example, markets such as "Will Bitcoin reach $100,000 by December 31, 2025?" or "Will Ethereum outperform Bitcoin in Q1 2026?" are popular choices [2]. The pricing in these markets shifts dynamically, reflecting real-time sentiment as users buy shares tied to "Yes" or "No" outcomes.

    Election and Policy Markets

    Political prediction markets have shown a strong track record in accurately forecasting election results [4]. Beyond elections, policy-related markets tackle a range of topics:

    Market Type Examples Purpose
    Legislative Outcomes Carbon tax implementation by 2027 Anticipating policy shifts
    Environmental Goals EU 2030 emissions targets Tracking progress
    Regulatory Decisions Crypto regulation changes Analyzing policy impact

    These markets are valuable for policymakers and analysts, offering measurable insights into likely outcomes and aiding in informed decision-making [1].

    Business Use Cases

    Prediction markets have also found a place in corporate settings, where companies use them for internal forecasting and planning. For example, Google has adopted this approach to predict outcomes like:

    "Google has used prediction markets to forecast product launch dates, project completion times, and even office openings. These markets allow employees to ‘bet’ on various outcomes, leveraging the collective intelligence of the organization" [6].

    Hewlett-Packard has similarly used employee-driven prediction markets with virtual currency incentives to refine sales forecasts. This approach taps into frontline insights, helping identify potential risks early [6].

    In addition to these traditional uses, prediction markets also play a role in technological forecasting, offering insights into adoption trends and timelines for emerging technologies. These predictions guide resource allocation and investment strategies [1]. Platforms like Polymarket take this concept further by enabling decentralized participation through blockchain, opening access to a broader audience [1].

    Risks and Problems

    The rise of crypto prediction markets comes with a set of challenges that both users and platforms need to address. Being aware of these risks is key to navigating this space safely.

    Data Feed Security

    One major issue is ensuring the reliability of data feeds. Platforms like Polymarket depend on oracle systems to resolve markets, which introduces potential vulnerabilities. If these systems fail or are compromised, users could face irreversible financial losses. Polymarket, for instance, uses a UMA-based system, making it clear that strong security protocols are a must.

    Current measures to address these vulnerabilities include:

    Measure Purpose
    Reputation Systems Tracks oracle reliability
    Cryptographic Proofs Ensures data accuracy
    Cross-Chain Solutions Enables multi-blockchain use

    Regulatory issues also pose a major challenge for crypto prediction markets. In January 2022, Polymarket faced a $1.4 million penalty from the CFTC for running an unregistered market [3]. This enforcement action occurred during a period of rapid growth for the platform and led to restricted access for U.S. users and the adoption of stricter KYC procedures.

    These regulatory shifts create several operational hurdles for platforms, including:

    • Limited market access in certain regions
    • Higher compliance costs
    • Restrictions on the types of markets offered
    • Navigating complex and varying legal frameworks

    Price Swings and Risk

    Even with secure systems and regulatory compliance, the inherent volatility of these markets remains a concern. Unlike traditional financial markets, crypto prediction platforms lack mechanisms like circuit breakers to manage extreme price changes. For example, during the 2022 crypto market crash, many platforms faced severe liquidity issues and wild price swings [6].

    Some markets have seen daily price fluctuations exceeding 200% [5]. This level of volatility is especially problematic for long-term predictions, where numerous factors can shift over time. To address this, some platforms are exploring options-like structures to help limit potential losses.

    What’s Next for Prediction Markets

    Prediction markets are evolving quickly, with the sector expected to hit $14.8 billion by 2026 [2]. Advances in technology and growing interest from institutions are driving this growth, creating opportunities for platforms like Polymarket and its emerging competitors.

    New Platforms and Features

    New players like Augur v2 and Gnosis are bringing fresh tools and approaches to the table, complementing Polymarket’s focus on accessibility:

    Platform Key Features Target Market
    Augur v2 Smart contract automation Advanced traders
    Gnosis Developer tools, custom markets Platform builders
    Polymarket Easy-to-use interface Everyday users

    Technical Updates

    Recent upgrades are tackling past security issues while enabling broader use cases. Enhanced data verification systems and cross-chain compatibility are improving reliability and expanding application possibilities.

    Growing Institutional Interest

    Institutional players are starting to see the value of prediction markets for applications like risk management and decision-making. This growing interest boosts Polymarket’s appeal.

    "The integration of prediction markets with other DeFi protocols is opening up exciting possibilities for new financial products. Prediction market outcomes could be used as triggers for decentralized insurance products, allowing for more dynamic and responsive coverage" [7].

    Corporate adoption is taking shape through:

    • Integration with DeFi-based insurance products
    • Advanced risk modeling for institutions
    • Automated tools for supply chain forecasting

    The combination of better technology, institutional backing, and regulatory developments signals a major shift for crypto prediction markets. Polymarket is well-positioned to bridge decentralized speculation with traditional financial strategies.

    Summary

    Main Points

    Polymarket leads the decentralized prediction market space, offering high trading volumes and a wide range of event topics. These markets rely on crowd-sourced insights, decentralized access, and integration with DeFi protocols.

    Polymarket’s Position

    Polymarket’s dominance is built on three key strengths:

    • Efficient Infrastructure: Uses Layer 2 technology and an oracle system via Polygon, balancing costs and security.
    • Accessible Design: A user-friendly platform that attracts large liquidity pools.
    • Varied Market Options: Covers a broad spectrum of sectors and topics.

    Although facing regulatory hurdles, Polymarket continues to grow by advancing its technology and appealing to institutional users. This approach helps it connect speculative trading with professional forecasting tools while adhering to compliance standards and improving decentralized forecasting systems.

    Related Blog Posts

  • Explore Solana: Top DeFi apps on the Solana blockchain

    Explore Solana: Top DeFi apps on the Solana blockchain

    Solana is powering some of the fastest and most affordable DeFi platforms available today. With transaction fees under $0.01 and speeds of up to 65,000 transactions per second, it’s ideal for decentralized finance. Here’s a quick look at the top DeFi apps built on Solana and what they offer:

    • Raydium: A hybrid DEX with $1.2B TVL, offering advanced trading tools, dual yield opportunities, and token launch support.
    • Jupiter: Solana’s leading DEX aggregator, optimizing token swaps with smart routing and low costs.
    • Kamino Finance: Automated yield strategies with dynamic rebalancing and stop-loss features.
    • Drift Protocol: A perpetual trading platform with up to 10x leverage and portfolio-wide collateral.
    • Defx: High-leverage trading with up to 50x for futures and 20x for spot trades.
    • Solend: Lending and borrowing platform managing 65% of Solana’s lending market with isolated pools and flash loans.
    • Meteora: Concentrated liquidity pools for higher capital efficiency and reduced slippage.
    • Orca: A user-friendly DEX with tools like Fair Price Indicator and targeted liquidity positions.

    Quick Comparison

    Platform Key Feature Fees Best For
    Raydium AMM + order book integration 0.17-0.25% Liquidity providers & traders
    Jupiter Best swap rates across DEXs 0.0001 SOL Token swaps
    Kamino Automated yield strategies 10% on yields Yield optimization
    Drift Perpetual trading with 10x leverage 0.10% taker Leveraged trading
    Defx High-leverage trading (50x futures) 0.02-0.05% Experienced traders
    Solend Lending with isolated pools Dynamic Lenders & borrowers
    Meteora Concentrated liquidity pools Varies Liquidity providers
    Orca Easy-to-use DEX with tools 0.3% Beginners & casual traders

    Start by choosing a platform that matches your needs – whether it’s swapping tokens, earning yields, or trading with leverage. Solana’s speed and affordability make it a strong choice for DeFi enthusiasts.

    Top Decentralized Exchanges (DEXs) in the Solana Ecosystem

    Solana

    1. Raydium: Multi-Purpose DEX Platform

    Raydium

    Raydium plays a key role in Solana’s DeFi ecosystem by combining an automated market maker (AMM) system with direct integration into Serum’s central limit order book (CLOB). This hybrid model has helped the platform lock in $1.2 billion in Total Value Locked (TVL) across over 150 liquidity pools [5].

    Built on Solana’s fast infrastructure, Raydium offers advanced trading tools while staying user-friendly for casual traders. One of its standout features is Fusion Pools, which enhance project launches and liquidity incentives.

    Here are some of its main trading features:

    • Advanced Order Types: Includes TWAP orders and algorithmic trading via API [5][7].
    • Concentrated Liquidity: Allows for 0.01% price increments, improving capital efficiency [5].
    • Dual Yield Opportunities: Earn through trading fees (0.25%) and RAY token rewards [2].

    Fusion Pools combine trading fees and token rewards, providing a unique dual incentive for liquidity providers. Raydium’s AcceleRaytor launchpad has already supported over 85 token launches [5].

    For passive investors, Raydium offers multiple earning options:

    • Liquidity pools with fees ranging from 0.17-0.25% plus RAY rewards.
    • RAY staking, which offers 8-12% APY along with governance rights.
    • Time-limited farms with returns of up to 45% APR.

    Security is a priority for Raydium, with audits conducted by Ottersec and Kudelski. It also supports self-custody wallets like Phantom and Solflare [13][8].

    Recently, Circle integrated USDC yield products directly into Raydium’s platform [1][8]. While the platform has faced challenges, such as price slippage exceeding 5% during high-demand periods like meme coin trading frenzies [13], it continues to showcase Solana’s ability to handle complex DeFi applications.

    2. Jupiter: Advanced Token Swaps

    Jupiter

    Jupiter takes full advantage of Solana’s low-cost infrastructure, offering swaps at just 1/100th of the cost compared to Ethereum-based aggregators. As Solana’s top DEX aggregator, it handled over $2.1 billion in trading volume during the SOL price surge in October 2024 [8]. Its advanced swap aggregation algorithm scans multiple DEXs simultaneously, optimizing routes across 200+ trading pairs to secure the most favorable rates [5].

    One standout feature of Jupiter is its smart order routing system. This system splits large trades across different liquidity sources – for example, directing 40% through Raydium and 35% through Orca. This reduces price impact while ensuring transactions remain atomic.

    The platform also offers a range of advanced trading tools:

    Feature Capability Performance Metrics
    Limit Orders Expiration from 1 hour to 30 days 400ms median swap time [7]
    DCA Trading Automated recurring swaps 0.0001 SOL (~$0.015) per swap [7]

    Jupiter’s utility is further enhanced through integrations with other DeFi protocols. Users can swap directly into yield-generating positions via Kamino Finance vaults or use swapped assets as collateral on Solend – all within a single transaction [8]. Security is a priority, with quarterly audits conducted by OtterSec. The most recent v1.2 audit was completed in Q3 2024 [8].

    "Jupiter accounts for over 60% of all DEX volume on Solana, with more than 1.1 million unique users" [9][15].

    For developers and institutional traders, Jupiter offers a powerful API [8]. Features like real-time TradingView charts and visual route breakdowns improve transparency. Additionally, fee-free transaction simulations make it easier for new users to get started. All of this is built on Solana’s sub-second finality, maximizing efficiency and speed.

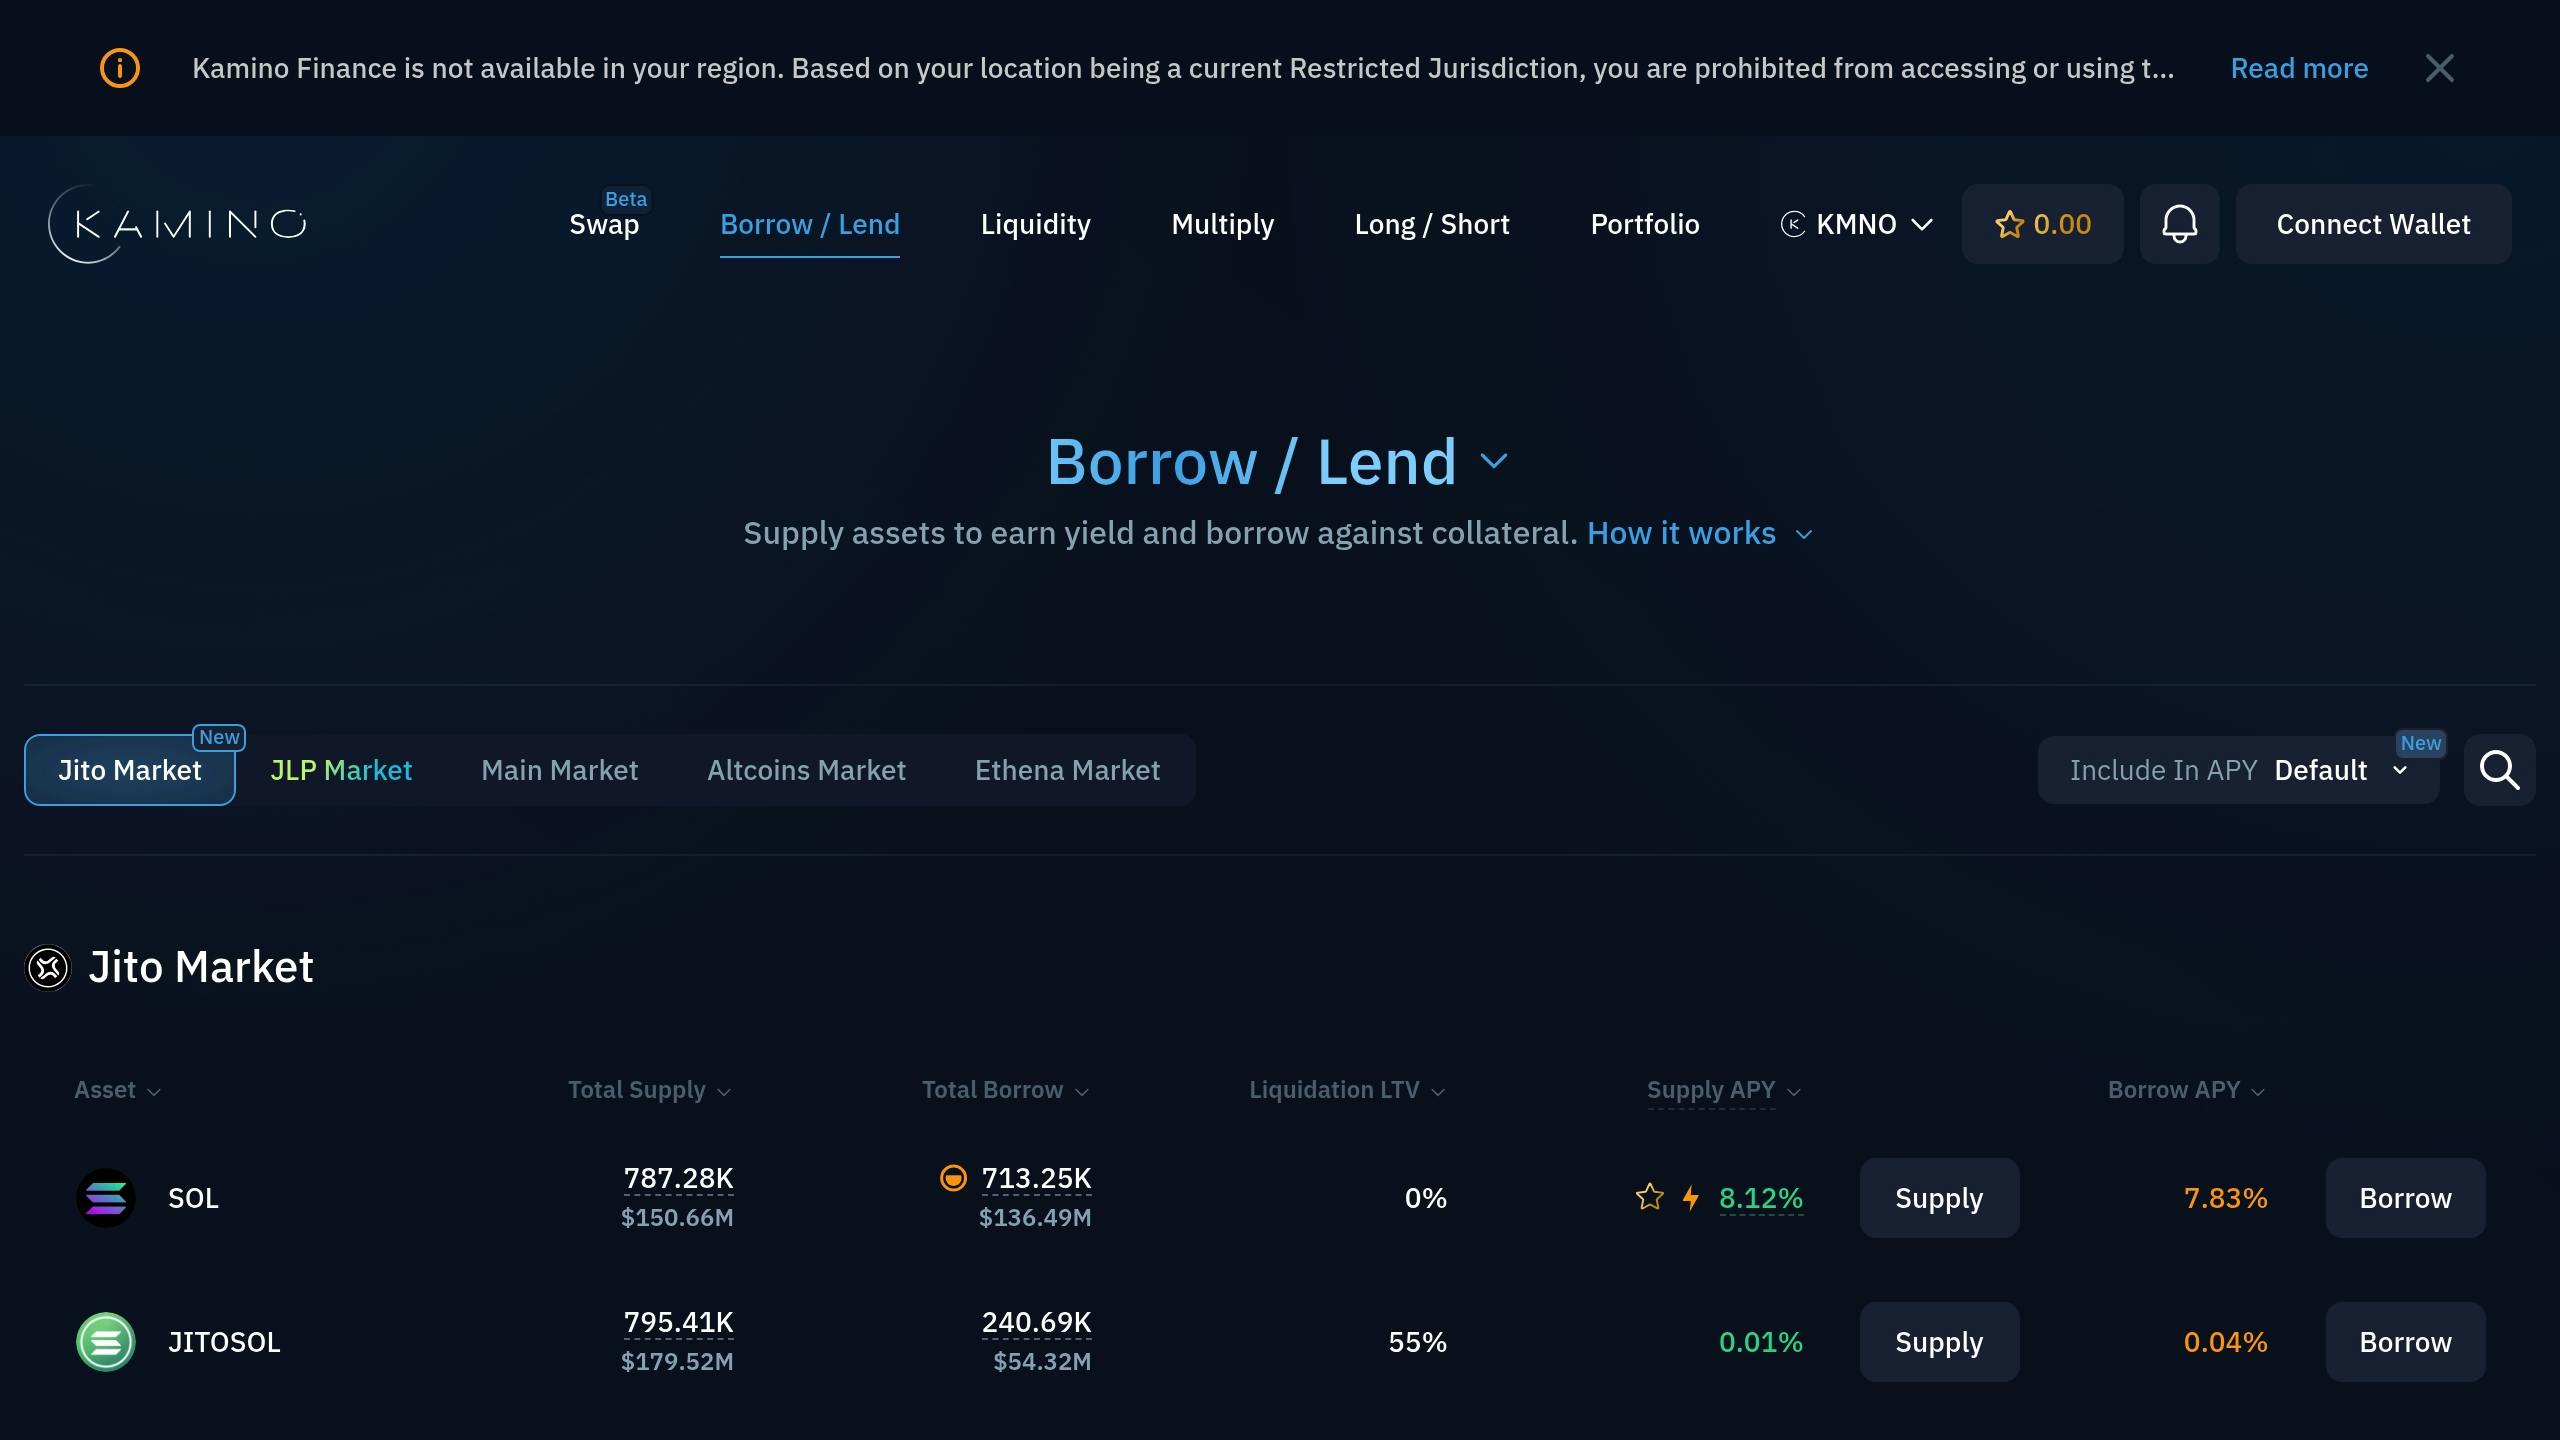
    3. Kamino Finance: Automated Yield Strategies

    Kamino Finance

    Kamino Finance takes Jupiter’s efficient swapping capabilities a step further by automating yield generation with algorithm-based strategies. It dynamically allocates funds across lending markets and liquidity pools, using Solana’s ultra-fast block times to enable frequent rebalancing.

    The platform’s system actively moves assets between protocols, such as lending platforms and DEX pools, while utilizing features like dynamic rebalancing and stop-loss mechanisms to manage risks effectively.

    Strategy Returns
    Concentrated Liquidity 189% APY [5]
    Yield Aggregation 213% annualized [5]

    Kamino stands out for its ability to optimize across multiple protocols. It incorporates several advanced risk management tools, including:

    • Dynamic rebalancing to adjust positions during market fluctuations
    • Automatic stop-loss features to limit potential losses
    • Portfolio diversification to reduce smart contract risks [5]

    By tightly integrating with Solana’s ecosystem, Kamino taps into Serum’s order book [3][16], Raydium’s AMM pools [2][6], and Solend’s lending markets. This interconnected approach helps achieve higher compound yields through sophisticated strategies.

    Kamino operates with a transparent fee structure, charging a 10% performance fee on generated yields. There are no extra fees for deposits or withdrawals [9].

    4. Drift Protocol: Perpetual Trading

    Drift Protocol

    Drift Protocol offers a powerful platform for perpetual futures trading, providing tools designed for serious traders. It allows users to trade major cryptocurrencies like SOL, BTC, and ETH with leverage up to 10x [2].

    The protocol uses a dynamic AMM liquidity model that adapts to market conditions, ensuring smooth price discovery and trade execution [3]. One of Drift’s standout features is its portfolio-wide collateral system, letting traders use their entire portfolio as collateral. This approach increases capital efficiency, similar to Kamino’s dynamic allocation, but tailored for leveraged trading [17].

    Feature Details
    Fees 0.10% taker / 0.05% maker
    Max Leverage 10x

    Drift also prioritizes risk management. It includes real-time margin tracking and a gradual liquidation process to reduce the risk of sudden market crashes. An insurance fund backs the system, protecting traders and maintaining platform stability [5].

    For advanced users, Drift supports a full suite of order types, including market and limit orders, stop-loss and take-profit triggers, trailing stops, and post-only execution [4].

    The platform’s security measures are thorough. A price oracle redundancy system ensures accurate, manipulation-resistant pricing, while its open-source code invites community feedback and bug fixes.

    "Drift’s cross-margined account system represents a significant innovation in Solana’s DeFi ecosystem, offering traders unprecedented capital efficiency while maintaining robust risk management", according to the platform’s documentation [15].

    Drift integrates seamlessly with other Solana DeFi platforms, boosting liquidity and enabling advanced trading strategies. Traders can explore options like basis trading, delta-neutral strategies, and arbitrage, all supported by Solana’s lightning-fast block times and ultra-low transaction costs of $0.0001.

    sbb-itb-dd9e24a

    5. Defx: High-Leverage DEX Trading

    Defx

    Defx takes leveraged trading on Solana to the next level, offering traders a way to maximize their market exposure. With up to 20x leverage for spot trading and 50x leverage for perpetual futures, it’s designed for those looking to execute bold trading strategies [1]. Unlike Kamino, which focuses on yield automation, Defx zeroes in on providing high-leverage trading options.

    Thanks to Solana’s ultra-fast infrastructure, Defx executes trades in under 400 milliseconds. This speed, combined with features like real-time position monitoring and auto-liquidation, ensures a seamless experience. By using portfolio-wide collateral and liquidity aggregation, Defx enables traders to execute complex strategies with confidence.

    Trading Feature Details
    Spot Trading Leverage Up to 20x
    Perpetual Futures Leverage Up to 50x
    Trading Fees 0.02% – 0.05%

    Defx’s liquidity aggregation pulls resources from multiple sources, creating deep markets with minimal slippage [18]. For experienced traders, the platform offers advanced tools like limit orders, stop-loss, and take-profit orders [3]. Accurate pricing is ensured through real-time price feeds, reducing the risk of manipulation [17]. Additionally, a dynamic funding rate system helps maintain market balance [19].

    On the security front, Defx employs multi-sig wallets, a dedicated insurance fund, and decentralized oracles to safeguard user assets. By combining high leverage with robust risk management and security features, Defx provides a powerful platform for traders to execute advanced strategies while keeping risks in check.

    6. Solend: Lending and Borrowing

    Solend

    Solend serves as a key platform for lending and borrowing, offering tools for efficient capital deployment. Built on Solana’s high-speed network, Solend supports instant loan approvals and repayments, which are essential for leveraged strategies on integrated decentralized exchanges (DEXs). It holds about 65% of Solana’s lending market, with $500 million in Total Value Locked (TVL) and over $20 billion in lifetime volume [9][15].

    The protocol uses an algorithmic interest rate model that adjusts automatically based on pool usage. This ensures competitive yields for lenders while keeping the market stable. Lenders typically earn 3-5% APY on stablecoins and 1-3% APY on major cryptocurrencies, while borrowers encounter rates ranging from 5-10% APR, depending on the asset and market conditions [9][10].

    Asset Type Lending APY Borrowing APR
    Stablecoins 3-5% 5-8%
    Major Cryptocurrencies 1-3% 6-10%
    Other Tokens Varies Varies

    Solend enhances capital efficiency with its partial liquidation system, which also safeguards lenders [15]. Security is a priority, with quarterly audits and automated risk management systems in place [9]. Liquidators are charged a 0.5% fee during liquidations, ensuring stability even in volatile markets [10].

    The January 2025 integration with Raydium significantly boosted activity on the platform, increasing daily users by 27% and borrowing volume by 42%, while adding $150 million in liquidity [9].

    One of Solend’s standout features is its isolated lending pools. These allow for separate risk parameters across different assets, giving users the flexibility to adjust their strategies without taking on unnecessary risk. Cross-margin accounts further optimize user strategies, and flash loans enable advanced DeFi activities like arbitrage and debt refinancing [1][4].

    7. Meteora: Concentrated Liquidity

    Meteora

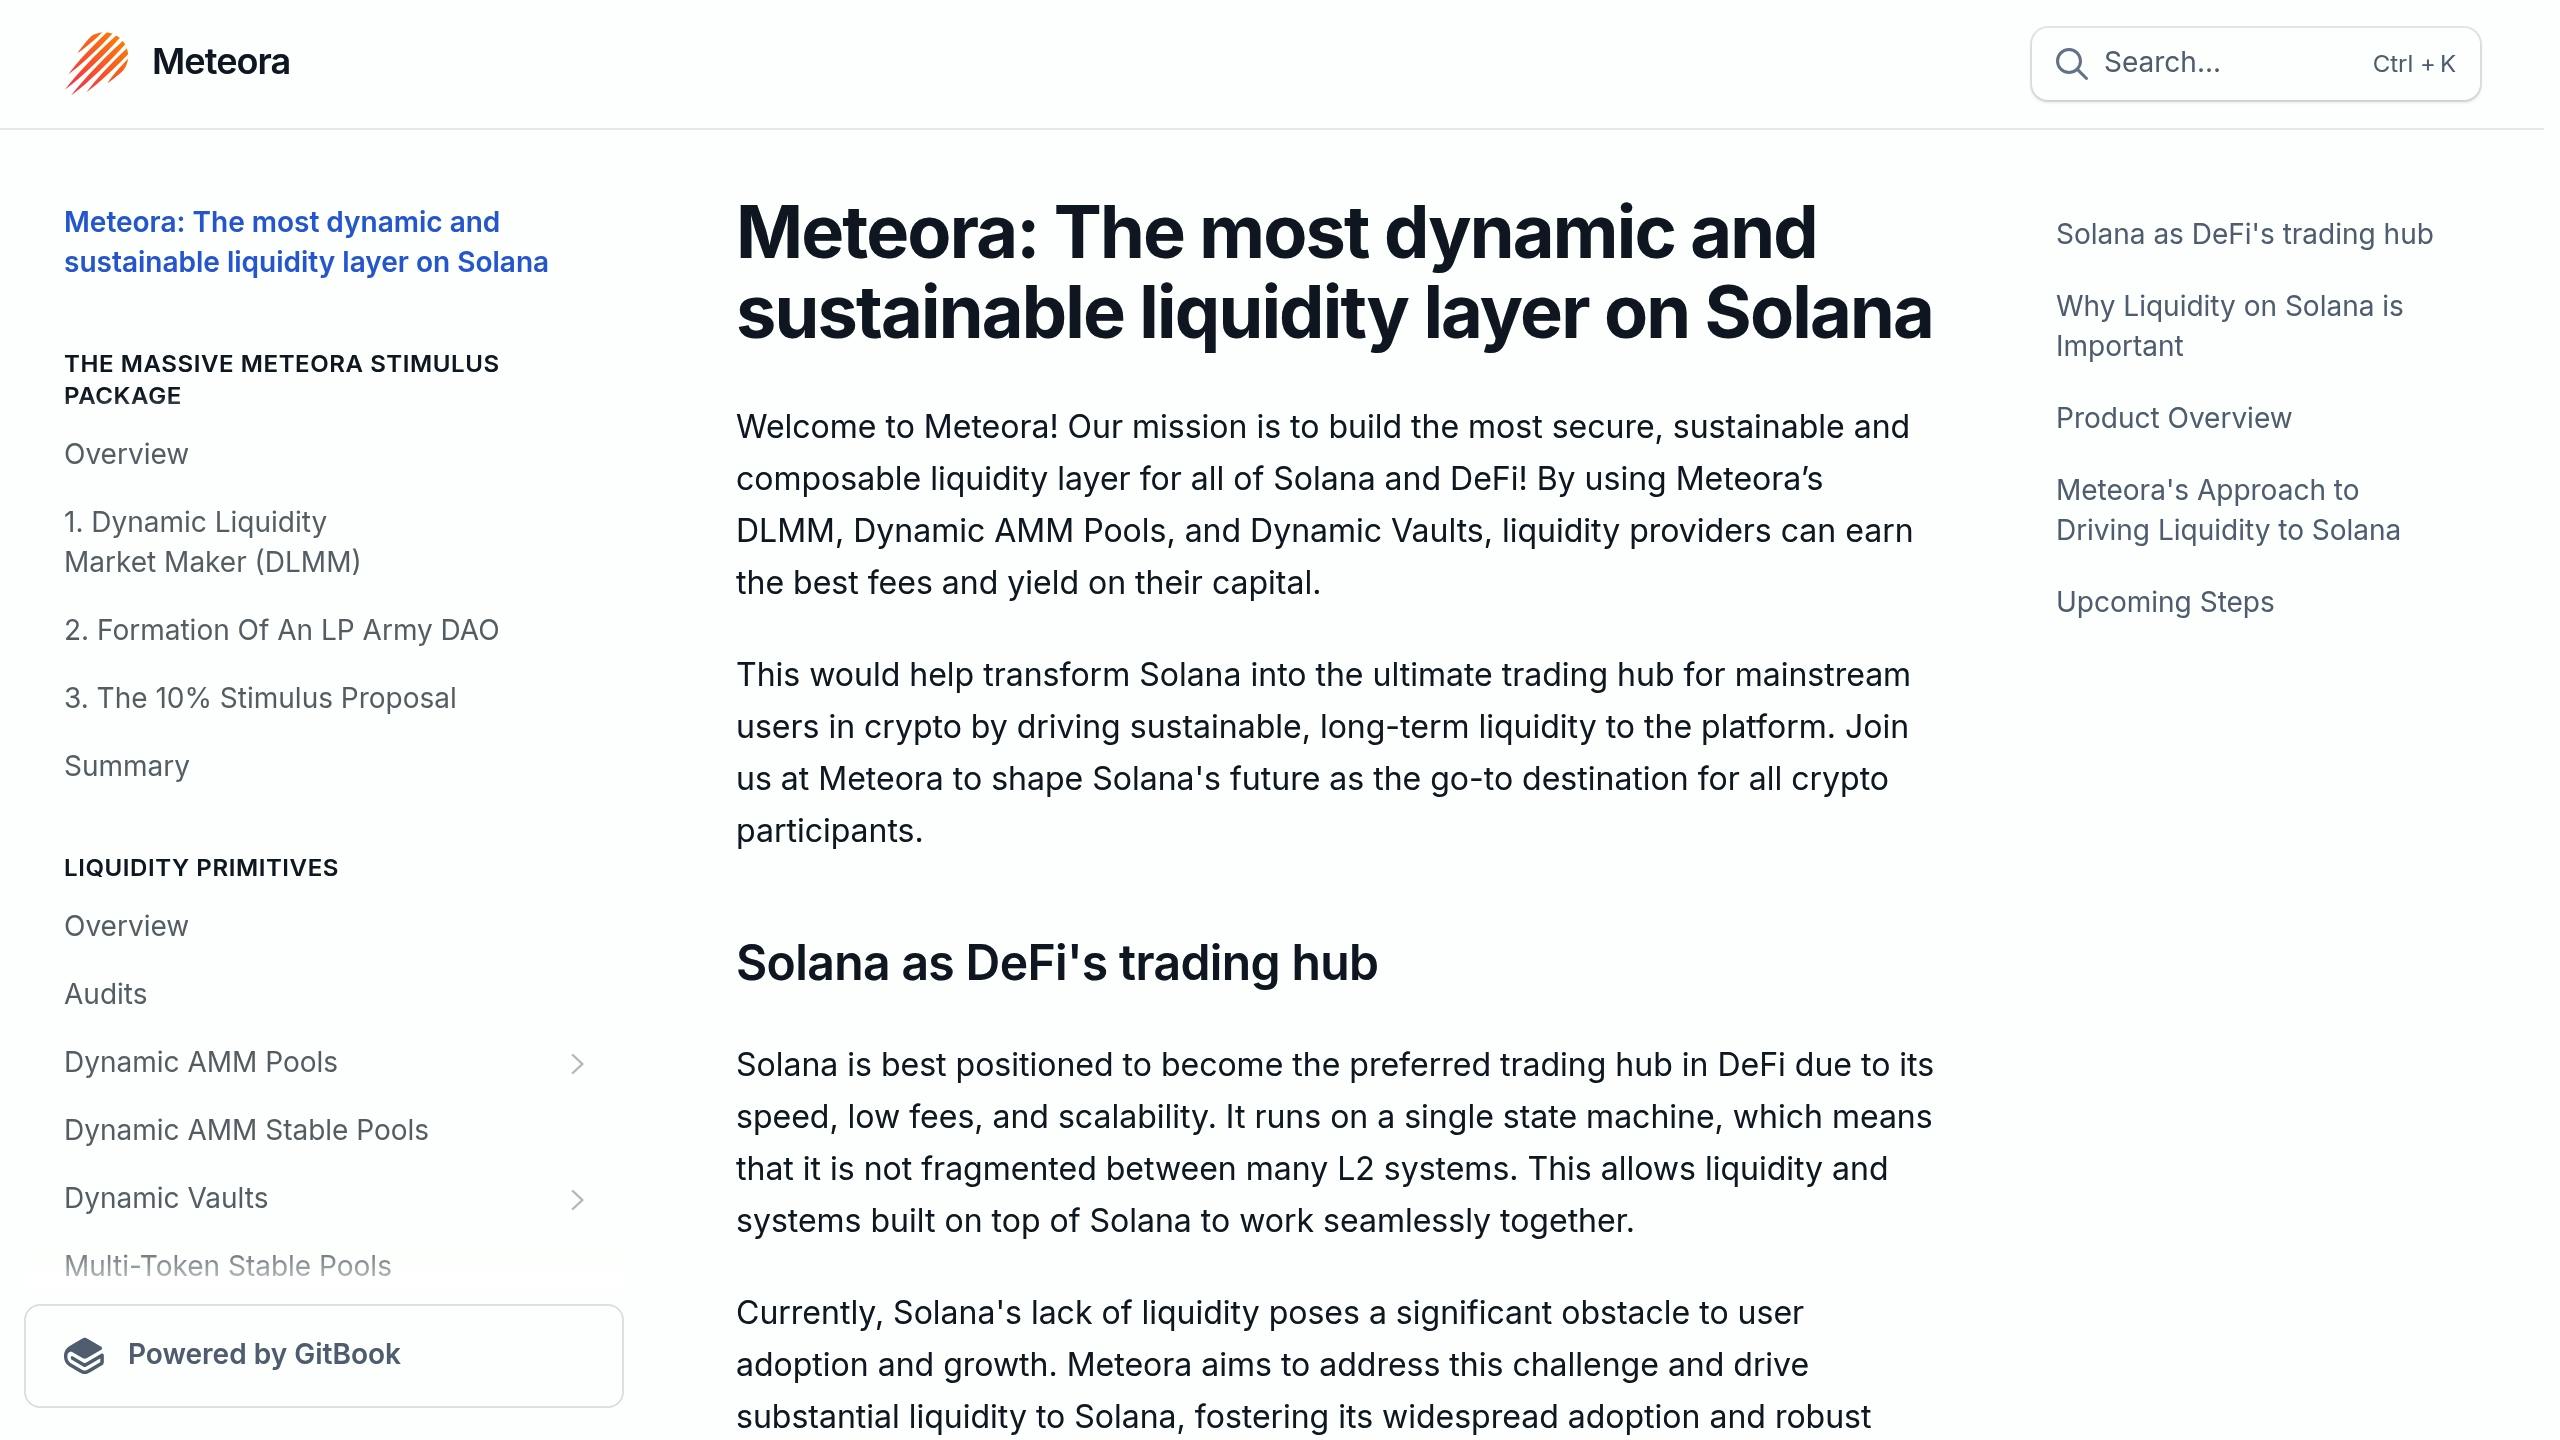
    Meteora boosts capital efficiency by using concentrated liquidity pools within specific price ranges. Liquidity providers focusing on narrow 5% price ranges can earn three times more in fees compared to traditional AMMs [1]. Thanks to Solana’s infrastructure, which supports sub-second trades, this setup also minimizes slippage, making it ideal for high-leverage platforms like Defx.

    Feature Details
    Capital Efficiency Up to 3x higher than standard pools
    Price Range Control User-defined ranges
    Multiple Fee Tiers Adjusted for trading pair volatility

    Meteora supports all major tokens on Solana, helping users optimize their returns [15]. It works particularly well with high-volume trading pairs, where concentrated liquidity reduces slippage and improves trade execution.

    For those looking to earn, Meteora provides multiple revenue options through its native MTR token. Token holders can participate in governance and earn a share of protocol fees [10]. Additionally, the platform allows single-asset liquidity provision, which helps manage risk [15].

    After launching enhanced yield optimization tools in January 2025, daily trading volumes jumped by 42% [9]. Meteora showcases how Solana’s speed and efficiency enable liquidity models that wouldn’t be possible on slower blockchains.

    8. Orca: User-Focused DEX

    Orca

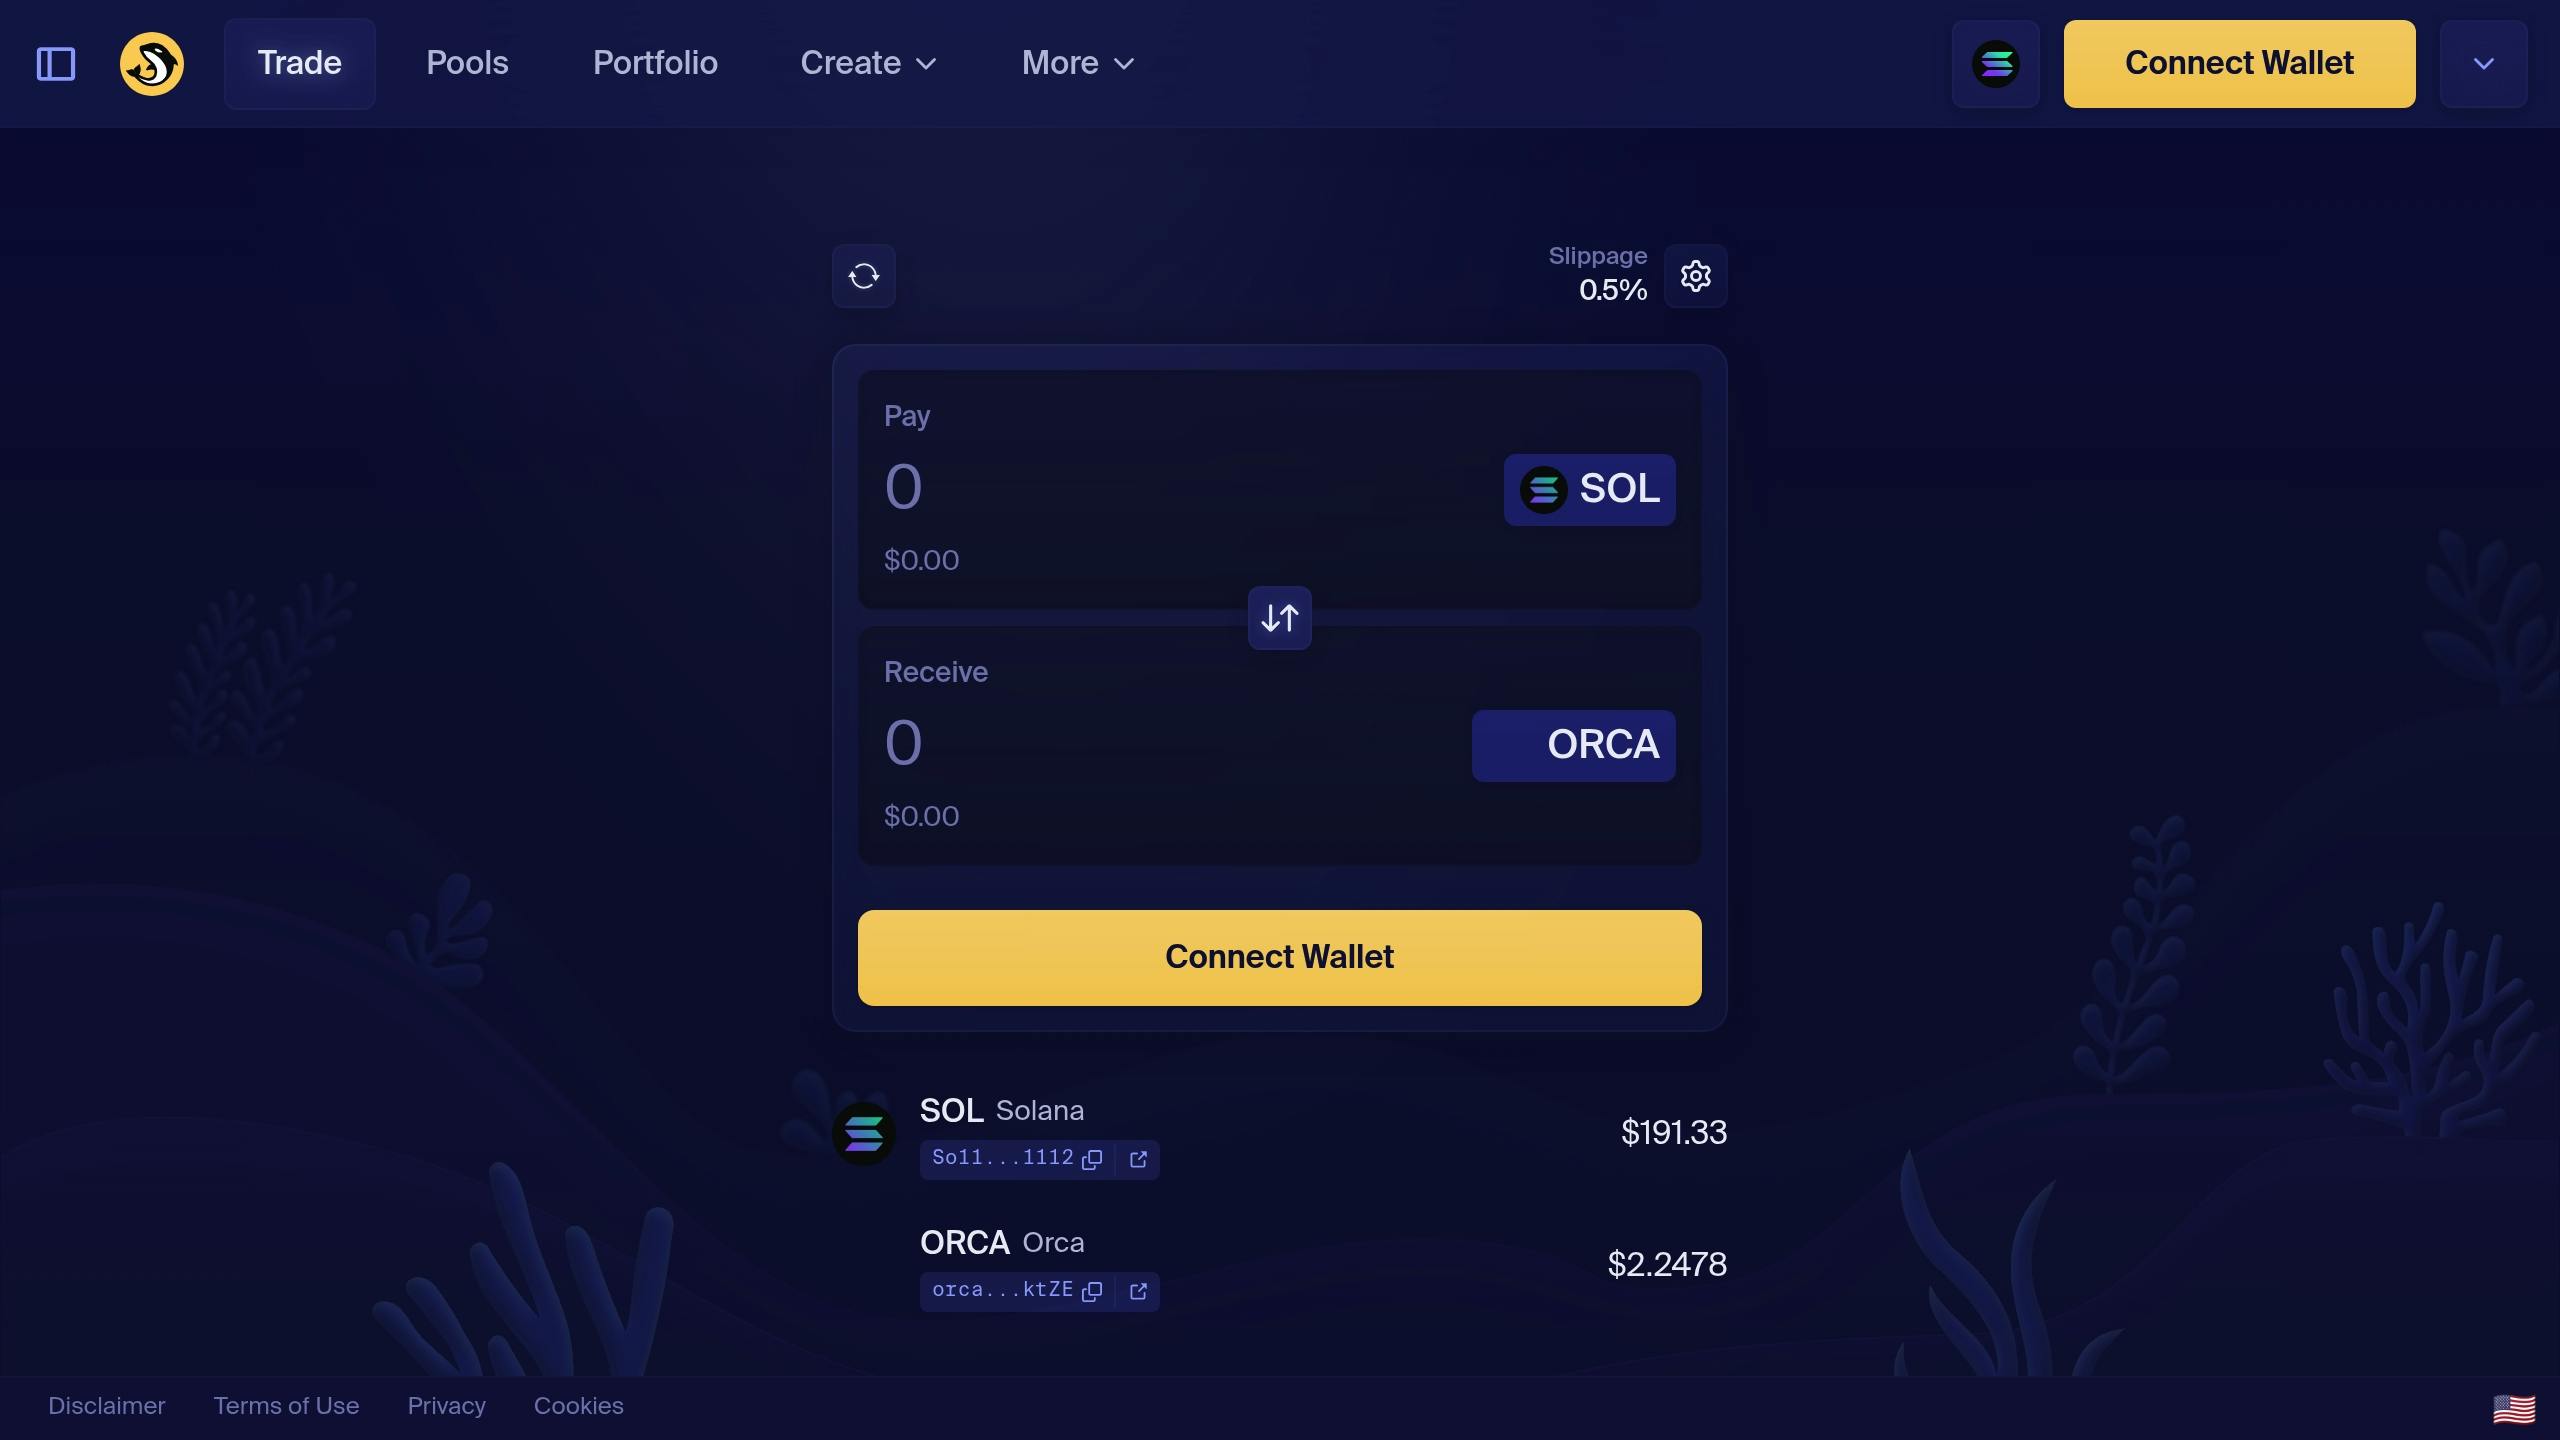
    Orca builds on Meteora’s liquidity features by offering a platform that combines an easy-to-use interface with tools designed for serious traders. With more than 500,000 users and $15 billion in total trading volume as of February 2025 [11], it has become a key player in Solana’s DeFi ecosystem.

    One standout feature is the Fair Price Indicator, which helps users make smarter trades by comparing prices across various Solana DEXs in real time [1]. This color-coded tool shows whether a trade offers a good rate, working alongside Jupiter’s route optimization to ensure transparency.

    Feature What It Does
    Fair Price Indicator Compares real-time market prices
    Impact-adjusted pricing Provides accurate quotes for large trades
    Whirlpools Allows for targeted liquidity positions
    Aquafarms Rewards users with ORCA tokens

    Whirlpools let users create targeted liquidity positions [5], while Aquafarms offer extra ORCA token rewards, with tiered rates for long-term stakers [5][11]. Together, these features have helped Orca maintain over $500 million in total value locked (TVL) [11].

    For those looking to maximize returns, Aquafarms regularly adjust reward rates to stay competitive. Some pools even provide higher rewards based on how long tokens are staked [5].

    Orca also prioritizes security [1]. This focus, paired with its intuitive design, has earned the platform a 4.7/5 rating from over 1,200 reviews on DeFi Pulse [11].

    Handling $50 million in daily trading volume and $500 million in TVL [11], Orca supports 500,000 users through integrations with wallets like Phantom and Solflare. Like Raydium and Jupiter, it takes advantage of Solana’s fast transaction speeds and low fees, averaging just $0.0001 per trade [11]. New users can also explore DeFi concepts through Orca Academy, an interactive learning tool [9], making it a great entry point for those new to Solana.

    DeFi Platform Features Comparison

    Solana’s technical strengths allow its DeFi platforms to offer tailored solutions for users. These platforms stand out with their unique features and capabilities, catering to different needs.

    For trading, Jupiter takes the lead, supporting over 500 tokens – far more than Raydium’s 250+ and Orca’s 100+ options [9][10][14]. Cost-conscious traders will find competitive fee structures across these platforms:

    Platform Fees Volume Key Feature
    Jupiter 0-0.4% $100-150M Best swap rates [9]
    Raydium 0.25% $50-80M AcceleRaytor launches [2][12]
    Solend Dynamic N/A Isolated lending markets [5]
    Orca 0.3% $30-50M Fair Price Indicator [21]

    Platforms like Drift Protocol and Defx, built on Solana’s ultra-fast finality, offer advanced risk management tools for high-leverage trading.

    For liquidity provision, Meteora and Orca shine with their concentrated liquidity pools, delivering benefits to both traders and liquidity providers [6].

    The diversity of Solana’s ecosystem makes it accessible for all users. Beginners might prefer Jupiter’s easy-to-use aggregator, while advanced users can explore Defx’s 50x leverage options. Jupiter’s ability to process over $34 billion in trading volume in 2024 [9] highlights its efficiency in optimizing cross-DEX rates.

    Summary and Next Steps

    Now that we’ve reviewed Solana’s top DeFi platforms, here’s how you can start exploring this ecosystem effectively:

    1. Get Started with Solana

    Take advantage of Solana’s fast transaction speeds and extremely low costs:

    • Acquire SOL tokens to cover transaction fees and trades.
    • Solana’s ability to handle 65,000 transactions per second ensures quick execution [20].

    2. Pick the Right Platform

    Choose platforms based on your level of experience:

    • Start with Jupiter for simple token swaps.
    • Move to Raydium for providing liquidity.
    • Explore advanced options like Defx or Drift for leverage trading.

    3. Stay Secure

    Protect your funds by following these security tips:

    • Use hardware wallets for long-term storage [10].
    • Begin with small amounts to familiarize yourself with each platform’s features.

    Diversifying across platforms can help you maximize your opportunities. Solana’s speed, affordability, and growing ecosystem make it a promising choice for users at any experience level.

    Related Blog Posts

  • Phantom wallet vs Solflare wallet – which is the best Solana wallet?

    Phantom wallet vs Solflare wallet – which is the best Solana wallet?

    Looking for the best wallet for Solana? Phantom and Solflare are two top options, but they serve different needs. Here’s a quick comparison to help you decide:

    • Phantom: Best for multi-chain users, NFT collectors, and those who prefer simplicity. Supports Solana, Ethereum, Bitcoin, and Polygon.
    • Solflare: Ideal for advanced Solana stakers and data-driven traders. Focused exclusively on Solana with detailed staking tools and analytics.

    Quick Comparison

    Feature Phantom Solflare
    Chain Support Multi-chain (SOL, ETH, BTC, MATIC) Solana-only
    Staking Tools Basic staking Advanced analytics, 650+ validators
    NFT Management In-wallet sales, metadata display Portfolio tracking, value estimates
    Mobile Features Biometric login, multi-chain swaps Custom staking dashboard
    Security Real-time scam detection Pre-execution transaction testing
    dApp Integration Simplified, 2-click swaps Detailed routing, batch transactions

    Bottom Line: Choose Phantom for ease of use and cross-chain functionality. Go with Solflare if you’re focused on Solana staking and advanced trading tools.

    Key Features

    Feature Comparison

    Phantom and Solflare take different approaches to managing Solana assets. Phantom supports multiple blockchains, including Solana, Ethereum, Bitcoin, and Polygon [5][6]. In contrast, Solflare focuses exclusively on Solana [1][9], tailoring its features specifically to that ecosystem.

    Feature Category Phantom Solflare
    Chain Support Multi-chain (SOL, ETH, BTC, MATIC) Solana-only
    Staking Features Basic staking tools 650+ validators, detailed analytics
    NFT Management In-wallet sales, metadata display Portfolio tracking, value estimates
    Mobile Features Multi-chain swaps, biometric login Custom staking dashboard
    Transaction Tools Basic priority fees Advanced fee control, batch transactions

    These differences reflect distinct user priorities. Phantom’s streamlined interface contrasts with Solflare’s detailed analytics and tools. For example, 78% of users found Phantom’s swap interface faster in testing [5], while 68% of active stakers favored Solflare’s analytics dashboard [9].

    Main Differences

    Breaking it down further, here are key areas where the wallets diverge:

    Phantom focuses on:

    • Cross-chain token swaps using an integrated DEX aggregator [6].
    • Support for executable xNFTs [5].

    Solflare emphasizes Solana-specific tools, including:

    • Advanced stake pool creation and management [9].
    • A pre-execution transaction testing environment [8].
    • Detailed validator performance metrics for better selection [2].

    Phantom lacks advanced order types and validator analytics, while Solflare doesn’t offer cross-chain bridges or advanced NFT trading tools.

    Solflare also provides more control for traders with features like manual fee adjustments and batch transactions [9]. On the other hand, Phantom opts for simplicity with a more accessible fee structure.

    When it comes to NFTs, both wallets handle basic storage and transfers [1][5]. However, Phantom integrates directly with marketplaces for in-wallet trading [7][5], while Solflare offers portfolio tracking with value estimates for collections [9].

    These differences significantly impact trading efficiency on Solana DEXs – something we’ll dive deeper into in the dApp Support section.

    Solflare Wallet vs Phantom (2025) | Which One is Better?

    Solflare

    Security and Privacy

    For DEX traders, security features play a key role in managing risks, especially during leveraged positions.

    Security Tools

    Phantom and Solflare both prioritize security but take different approaches to protect users. Phantom focuses on real-time threat detection, analyzing transaction patterns to flag potential scams. It also relies on an open-source blocklist that is regularly updated by community contributions [7][4]. On the other hand, Solflare emphasizes pre-execution transaction testing to identify malicious activity before it happens [3][8]. Additionally, Solflare includes domain-level anti-phishing checks to guard against fake websites.

    Here’s how their security features compare:

    Security Feature Phantom Solflare
    Authentication Biometric + Password Password + Optional 2FA
    Transaction Protection Scam detection for fraudulent swaps Simulation to block smart contract exploits
    Key Storage iOS-grade secure enclave encryption Multi-party computation (MPC)
    Vulnerability Response 24-hour critical patch deployment 24-48 hour fix SLA
    Bug Bounty Program Up to $50k rewards Not publicly documented

    Phantom’s security has been verified through three public audits conducted by Kudelski Security since early 2024 [7][4]. Solflare, while not publicly audited, ensures transparency by using community-vetted open-source components [3][8].

    Hardware Wallet Support

    Hardware wallets are essential for secure large-scale DEX trades. Phantom provides full Ledger support, including Bluetooth-enabled features for mobile users with Ledger Nano X and S Plus models [7][4]. This makes it a strong choice for traders who need mobile flexibility.

    Solflare, however, focuses on desktop integration, supporting hardware wallets via USB connections [3][5]. While this limits mobile usability, it adds an extra layer of security by requiring additional confirmation steps during transactions.

    "Phantom’s rapid response to the 2021 Demonic vulnerability established its security credibility, implementing new seed protocols that prevented major losses [10]."

    Privacy Protection

    Both wallets prioritize user privacy. Phantom avoids collecting personal information or IP addresses, ensuring user anonymity [7][4]. Solflare also maintains privacy but offers an optional email recovery feature for added convenience [3][8]. Importantly, neither wallet stores seed phrases or private keys on their servers, giving users full control over their assets.

    For advanced users managing large portfolios, Phantom provides vaults with spending limits, while Solflare automatically revokes dApp access after each session for added security.

    sbb-itb-dd9e24a

    dApp Support and Access

    DEX and DeFi Tools

    When it comes to interacting with decentralized exchanges (DEXs), Phantom and Solflare take different approaches:

    • Phantom simplifies things with one-click swaps through the Jupiter Aggregator, making SOL-to-USDC trades as easy as two clicks [5][6].
    • Solflare, on the other hand, offers a more detailed process with manual routing. While this takes more steps, it gives experienced users more control. Solflare also shines in staking, managing over $14 billion in staked SOL [3].
    Feature Phantom Solflare
    DEX Integration Direct in-wallet swaps External DEX routing
    Trading Steps 2-click process 4+ step process
    Staking Interface Real-time APY dashboard Validator analytics
    DeFi Protocols Marinade Finance, Tensor Marinade Finance, StakeView

    Platform Support

    Phantom offers consistent features across platforms. Its mobile apps include WalletConnect, making it compatible with a wider range of dApps. Plus, its cross-device sync ensures smooth transitions between devices [4][5][6].

    Solflare provides a built-in dApp browser for easier ecosystem navigation [3]. However, its mobile app has limitations – staking with hardware wallets, for example, is only available on desktop, not Android [3][8].

    Currently, 78% of Solana dApps prioritize Phantom integration, while Solflare leads in validator tools, thanks to its analytics API [2][3][5].

    "The integration statistics show a clear preference among dApp developers, with Phantom’s extensive user base driving prioritized support across the ecosystem [5]."

    These differences affect how users manage leveraged positions. Phantom simplifies complex transactions with clear summaries, while Solflare provides raw data, catering to more technically skilled users [1][3]. Each wallet’s features fit distinct user needs – a topic we’ll dive into further in the Best Uses section.

    Best Uses and User Types

    Best Uses for Phantom

    The Phantom wallet is designed for users who want a straightforward multi-chain experience. With over 2 million active users [5], it stands out for:

    • Cross-chain traders: They can easily manage assets across multiple blockchains thanks to Phantom’s multi-chain setup [5].
    • Mobile-first users: Its iOS and Android apps offer features like biometric authentication and WalletConnect, making mobile trading smooth and secure [4].
    • NFT collectors: Phantom simplifies NFT management with features like rarity filters and visual galleries [6][7].
    User Type Key Benefits
    New Crypto Users Easy-to-use interface with step-by-step onboarding
    Mobile Traders Seamless mobile experience with device synchronization
    NFT Enthusiasts Integrated marketplace tools and collection features

    Best Uses for Solflare

    Solflare is tailored for users deeply involved in the Solana ecosystem, especially those focused on staking and analytics. It’s a strong choice for:

    • Professional stakers: Solflare provides detailed tools for selecting validators, including:
      • APY comparisons (around 7% on average) [3]
      • A testing environment to simulate transactions (covered in the Security section)
    • DeFi power users: They gain access to advanced liquidity controls and trading customization options.
    • Data-driven traders: Solflare’s web interface includes detailed analytics, validator metrics, and simulated transactions, helping users make informed decisions [3].

    The wallet also offers separate tabs for DeFi positions and staking pools, giving users precise control over their portfolios. While these features are great for experienced users, they might feel overwhelming to beginners.

    Solflare’s tools are ideal for those who need detailed control and analytics, making it a go-to choice for advanced users. This focus on precision will be revisited in our final recommendations.

    Summary and Choice Guide

    Here’s a breakdown of data-backed insights to help you decide:

    Feature Priority Phantom Solflare
    Chain Strategy Multi-chain swaps Solana-focused tools
    Trading Style One-click execution Customizable batch options
    Institutional Use Vault protections Multi-sig & CSV exports

    When trading on Solana DEXs with leverage, keep these recommendations in mind:

    • If cross-chain collateral management is a priority, Phantom simplifies asset transfers across SOL, ETH, and POLYGON networks [5].
    • For yield farming precision, Solflare offers detailed validator selection and performance tracking [1].

    Recommendations by User Type

    • New DeFi users: Go with Phantom for its straightforward automated swaps.
    • Yield farmers: Opt for Solflare to leverage its validator analytics.
    • Cross-chain traders: Choose Phantom for its robust bridge support.
    • Institutions: Use Solflare for its advanced reporting tools.

    Phantom’s 2024 audit highlights its focus on security [7], while Solflare’s detailed fee structure makes it ideal for high-volume traders [9].

    Related Blog Posts

  • A beginners guide to impermanent loss

    A beginners guide to impermanent loss

    Impermanent loss is a key risk for anyone providing liquidity on decentralized exchanges. It happens when the value of your deposited assets changes compared to simply holding them, leading to reduced returns. Here’s what you need to know:

    • What it is: Impermanent loss occurs due to price changes in the assets you’ve deposited into a liquidity pool. The larger the price change, the greater the loss.
    • How it works: Automated Market Makers (AMMs) rebalance pools as prices shift, which can lead to losses compared to holding the assets directly.
    • Impact: Losses can range from ~3.8% for a 25% price shift to over 50% for a 500% price change.
    • Mitigation: Choose stablecoin pools, correlated asset pairs, or high-fee pools to reduce risk. Tools and strategies like hedging and diversification can also help.

    Quick Tip: Even with impermanent loss, trading fees and rewards can still make liquidity provision profitable. Use tracking tools like DeFiLlama or CoinStats to monitor your investments and make informed decisions.

    How Price Changes Cause Losses

    How AMM Pools Work

    Automated Market Makers (AMMs) use a formula called the constant product formula: X * Y = K [1][4]. This formula ensures that the asset ratios in the pool adjust automatically as prices change. When you add equal values of two assets into a pool, it maintains a 50/50 balance. However, if external prices shift, the pool rebalances itself to keep the product constant [1][5].

    Arbitrage traders take advantage of these price differences, buying or selling assets in the pool until its prices align with the broader market [4][6]. This rebalancing process is what sets the stage for impermanent loss, as shown in the BTC/USDC example below.

    Loss Example Breakdown

    Here’s a detailed look at how price changes can lead to losses in a BTC/USDC pool:

    1. Initial Deposit

      • 0.1 BTC (valued at $4,000)
      • 4,000 USDC
      • Total value: $8,000
    2. Market Movement
      When the price of BTC doubles to $80,000, the pool rebalances:

      • 0.07071 BTC (now worth $5,657)
      • 5,657 USDC
      • Total value: $11,314
    3. Final Position
      Compare the outcomes:

      • If held outside the pool: 0.1 BTC ($8,000) + 4,000 USDC = $12,000
      • In the pool: 0.07071 BTC ($5,657) + 5,657 USDC = $11,314
      • Loss: $686 (5.7% of the potential value) [1]

    This example highlights how impermanent loss grows as price differences increase [2]. The term "impermanent" is used because these losses can disappear if prices return to their initial levels [3][5]. For liquidity providers, it’s crucial to balance the potential earnings from trading fees against the risk of these price-driven losses during significant price shifts [2].

    Math Behind the Losses

    Basic Math Formula

    Impermanent loss calculations might seem tricky, but the core formula is straightforward. It’s based on the price ratio changes between assets. Here’s the main equation:

    Impermanent Loss = (2√k)/(1+k) - 1
    

    In this formula, k represents the price ratio change (new price divided by initial price) [2][1].

    For example, in the BTC/USDC scenario mentioned earlier, a 100% price increase (√k = √2) resulted in a 5.7% loss. Using the same formula: if ETH’s price increases by 50% (k=1.5), the impermanent loss is approximately 1.6%:
    (2√1.5)/(1 + 1.5) – 1 ≈ 1.6%.

    Quick Calculation Methods

    If doing the math feels daunting, online calculators can make it easier. Look for tools that display price ratios and include fee projections.

    But it’s not just price ratios that matter. The relationship between assets also plays a big role in determining the severity of impermanent loss:

    • Stablecoin pairs: Almost no risk of impermanent loss.
    • wBTC/ETH: Typically sees losses capped under 10%, thanks to a correlation of about 0.8.
    • ETH/DOGE: Losses can go beyond 25% due to a much lower correlation of 0.2 [7][8].

    Here’s another useful tip: when assets experience equal percentage gains and losses, the resulting impermanent loss is the same [1][5]. This makes it easier to estimate potential losses without diving into detailed calculations.

    Ways to Reduce Losses

    Safe Pool Options

    To reduce exposure to impermanent loss, choosing the right pools is crucial. Stablecoin pairs like USDC/USDT and DAI/USDC are among the safest options. These pairs show minimal price divergence, with annualized impermanent loss typically staying under 0.5% [7]. For beginners, these pools provide a low-risk way to start.

    Another good choice is liquidity pools with highly correlated assets. Examples include ETH/stETH and WBTC/BTC, as their prices tend to move in sync since they represent the same underlying assets [4]. This natural alignment helps minimize divergence risk.

    Pro Strategies

    Advanced users can explore techniques like price-neutral hedging and high-fee pool strategies to manage losses. For instance, pairing liquidity provision with derivatives can be effective. A common approach is shorting ETH futures on platforms like dYdX while providing ETH liquidity [7].

    Uniswap v3’s concentrated liquidity pools with higher fees also help offset losses [1]. A case study from Balancer highlights how pools with asymmetric allocations (e.g., stablecoins paired with volatile assets) generate enough fees to absorb price changes of up to 15% [9].

    Strategy Type IL Coverage (%) Minimum Time Horizon
    Stablecoin Pairs 99.5 1 month
    High-Fee Pools 97 6 months
    Delta-Neutral 95 3 months

    These timeframes align with the price thresholds discussed earlier.

    Pool Mix Strategy

    Diversifying your pool selection is another way to manage risk. Just as asset correlation reduces exposure, spreading investments across different pool types adds an extra layer of protection. Simulations show that diversification can lower impermanent loss by 62% [7]. A balanced strategy might include stablecoin pools, correlated asset pools, and higher-risk options.

    "Recent protocol innovations combine dynamic fees and yield-bearing assets – a strategy that reduced IL by 33% in Q1 2025 trials" – Delphi Digital [9]

    To maximize returns, avoid providing liquidity during periods of extreme price volatility [3]. Some protocols now offer features like dynamic fees and automated pool adjustments, which help limit losses caused by arbitrage [7].

    sbb-itb-dd9e24a

    What is Impermanent Loss – Explained for Beginners

    Tracking and Management Tools

    Actively monitoring your investments is just as important as choosing the right pools. Using the right tools can help you keep impermanent loss in check and make informed decisions in real markets.

    Pool Tracking Tools

    Platforms like CoinStats and PulseCoinList provide real-time simulations of impermanent loss by analyzing both historical and current market data. These tools combine performance metrics with market trends, giving you a clearer picture of pool performance.

    DeFiLlama stands out as a multi-chain tracking platform, supporting networks like Ethereum, BSC, and Polygon [2]. Its dashboard offers key metrics that can help you stay on top of your investments:

    Metric Update Frequency Purpose
    Price Ratio Deviation Real-time Monitor asset pair divergence
    Fee Revenue Hourly Compare earnings against IL risks
    Total Value Locked Changes 15 minutes Check liquidity stability

    When paired with automated trading platforms like Defx Perps DEX, these insights become even more actionable.

    Defx Perps DEX

    Defx Perps DEX

    Defx provides advanced tools for managing impermanent loss through margin trading. With both isolated and cross-margin options, the platform allows you to hedge your risks in real time by opening margin positions that counterbalance your pool exposure [8]. Additionally, its low-slippage trade execution ensures you can respond effectively to market changes, even during periods of high volatility.

    Market Alert Systems

    Market alert systems turn theoretical strategies into real-world actions. Tools like TradingView and CoinMarketCap let you set custom alerts, so you can act swiftly when market conditions change [7].

    For example, Chainlink-powered smart contracts can automatically tweak pool parameters when certain thresholds are hit, such as a price divergence exceeding 0.5% [2][7].

    Here are some alert thresholds to consider:

    • 15%+ price divergence: Helps you track major shifts in asset pair values.
    • 10%+ TVL fluctuations: Indicates potential changes in pool liquidity.
    • 3x volume spikes: Signals heightened trading activity that could impact your pool.

    These thresholds are based on data from successful liquidity providers operating on major decentralized exchanges [2].

    Summary

    Main Points

    Impermanent loss happens when AMM formulas adjust pool balances during price changes [5]. This risk is unique to liquidity providers due to the constant product formula and the influence of arbitrage trading.

    As outlined in the Pro Strategies section, trading fees from high-volume pools can help offset these losses if managed carefully [7][8]. This highlights the importance of choosing the right pools and analyzing fee structures.

    Tips for New Users

    Here are three essential principles to keep in mind [9][7]:

    • Monitor key metrics using tracking tools:
      • Compare Pool APR with impermanent loss
      • Look for asset correlations above 0.7
      • Keep an eye on volume trends
      • Check the protocol’s safety status
    • Run simulations with market scenario calculators before making deposits.
    • Factor in time horizons and market conditions when choosing pools, as discussed in the Pool Mix Strategy section.

    FAQs

    What is the primary cause of impermanent loss?

    Impermanent loss happens when the price ratio of paired assets changes after being deposited into a liquidity pool. This triggers the pool’s automated rebalancing, which is based on the constant product formula [4][10]. The extent of this loss depends on how much the price ratio diverges, as shown in earlier examples.

    For instance, during the market crash in May 2021, liquidity providers in the ETH/BTC pool experienced losses of 38% when the usual correlation between the two assets broke down. This highlights why pairing correlated assets (as discussed in the Safe Pool Options section) can help lower risk [8].

    If you’re looking for ways to keep track of impermanent loss, check out the Tracking and Management Tools section.

    Related Blog Posts

  • Automated market makers vs orderbooks in perps trading. Which is better for what scenarios?

    Automated market makers vs orderbooks in perps trading. Which is better for what scenarios?

    Automated Market Makers (AMMs) and orderbooks are the two main models for perpetual futures trading in decentralized exchanges (DEXs). Each serves different trading needs, and understanding their strengths can help you choose the right one.

    • AMMs: Use liquidity pools and algorithms for instant trades. Best for smaller trades, niche tokens, and passive income through liquidity provision.
    • Orderbooks: Match buy/sell orders for precise execution. Ideal for large trades, advanced strategies, and institutional traders.

    Quick Comparison

    Feature AMMs Orderbooks
    Execution Guaranteed, variable prices Precise, depends on orders
    Best for Trades <$10k, niche tokens Trades >$50k, advanced tools
    Latency Slower (block confirmation) Fast (sub-1ms on hybrid systems)
    Fee Structure 0.01-0.3% (LP fees) -0.02%/+0.05% (maker/taker fees)
    Slippage (100k trade) 5-15% 0.3-1%

    Key takeaway: AMMs are simple and flexible, while orderbooks are precise and efficient. Choose based on your trade size, strategy, and market conditions.

    Order Book vs Automated Market Maker (AMM): What’s the Difference?

    Technical Differences: AMMs vs Orderbooks

    These models differ significantly in how they are technically structured, impacting everything from trade execution to liquidity management.

    Trade Execution Methods

    AMMs rely on smart contracts and constant product formulas to execute trades. In contrast, orderbooks use a price-time priority system to match bids and asks. This process is built on the validator-run framework, where trades are executed based on available limit orders at specific prices.

    Liquidity Sources and Market Depth

    How these systems manage and maintain liquidity highlights key differences in their market behavior:

    Aspect AMM Model Orderbook Model
    Liquidity Source Passive liquidity providers (LPs) in pools Active market makers
    Depth Stability Depends on pool size Driven by competition among market makers
    Volatility Impact Pool withdrawals can affect stability Prices adjust dynamically based on activity
    Typical Spread 0.01-0.3% (fixed) Ranges from -0.02% to +0.07% (variable)

    Jump Crypto‘s role in market making showcases how professional traders work to optimize spreads [4][5].

    On-Chain vs Hybrid Systems

    The underlying architecture of these systems involves trade-offs between decentralization and performance. Fully on-chain AMMs, such as Uniswap, emphasize decentralization but often suffer from latency issues. On the other hand, hybrid systems incorporate off-chain components to improve speed, though this comes at the cost of reduced decentralization.

    Some emerging protocols aim to address these challenges by upgrading blockchain infrastructure. For instance, platforms like Monad are exploring solutions to enable fully on-chain orderbooks [4].

    These architectural choices also influence security. AMMs are vulnerable to MEV risks, while hybrid systems must balance speed with potential centralization concerns. These trade-offs between decentralization and efficiency shape the core dynamics of perpetual trading models, directly affecting the trader experience – a topic we’ll dive into during the performance analysis.

    AMMs vs Orderbooks: Performance Analysis

    Side-by-Side Comparison

    When choosing between AMMs and orderbooks, understanding their performance across key metrics is essential. Here’s a breakdown of how they compare:

    Performance Metric AMM Model Orderbook Model
    Trade Size Impact 0.5-2% slippage ($10k trades)
    5-15% slippage ($100k trades)
    0.1-0.3% spread ($10k trades)
    0.3-1% spread ($100k trades)
    Execution Speed 12-15s block confirmation Sub-1ms (hybrid systems)
    Price Stability Formula-based, pool-dependent Market-driven, dynamic
    Market Making Passive LP deposits 30+ professional market makers

    AMM Benefits

    AMMs, like Uniswap V3, shine during volatile market conditions. Thanks to automated rebalancing, they can maintain pricing even when liquidity dries up in orderbooks. Their concentrated liquidity pools remain operational during sharp ETH price swings, offering reliability.

    For less popular assets, AMMs are particularly useful. Their constant product formula ensures consistent pricing, solving the issue of low liquidity that orderbooks often face. Ethereum-based AMMs, such as GMX, excel in niche markets, including synthetic assets.

    Orderbook Benefits

    Orderbooks outperform AMMs in three key areas:

    1. Better Large Trade Handling

    Platforms like dYdX demonstrate this advantage clearly. For example, a 100 ETH trade incurs just a 0.15% price impact on dYdX, compared to 2-5% on AMMs [4][5]. This makes orderbooks the go-to option for large-scale traders and institutions.

    1. Advanced Trading Tools

    Orderbook platforms, such as Mango Markets on Solana, offer features like sub-second trade execution. These capabilities enable complex strategies, including stop-loss and iceberg orders, which are not feasible with fully on-chain AMMs [4][5].

    1. Higher Capital Efficiency

    Professional market makers on platforms like dYdX use dynamic hedging to deliver tighter spreads and more efficient price discovery [3][4]. This ensures smoother trading experiences and better outcomes for users.

    These comparisons highlight how AMMs and orderbooks cater to different needs, providing a foundation for selecting the right system based on specific trading goals.

    When to Choose AMMs vs Orderbooks

    Best Uses for AMMs

    AMMs shine in several scenarios, particularly for traders and liquidity providers looking for flexibility and ease of use:

    • Trading Lesser-Known Assets: AMM pools are ideal for newer or niche tokens. For example, Uniswap V3 handled an impressive $226 billion in trading volume across exotic pairs in Q2 2023 [5].
    • Earning Passive Fees: Liquidity providers (LPs) can earn fees (typically 0.3% per trade) without needing to actively manage their positions. For every $1 million in trading volume, LPs can generate around $3,000 in daily revenue [2][5].
    • Ease of Access: AMMs allow permissionless trading, meaning anyone can trade without needing market makers. Liquidity is pooled, offering instant access to markets.

    Best Uses for Orderbooks

    Orderbooks, especially those with advanced infrastructure like dYdX, are the go-to choice for institutional traders and those managing larger trades. Here’s why:

    • Handling Large Orders: Orderbooks excel in minimizing slippage for high-value trades. For instance, spreads stay below 0.3% for six-figure transactions, as shown in slippage comparisons [1][3].
    • Executing Advanced Strategies: Orderbooks enable sophisticated trading features, such as:

      • Sub-second execution speeds
      • Precise limit orders
      • Stop-loss orders and iceberg execution [3][4]
    • Stable Performance in Normal Markets: During periods of moderate market volatility, orderbooks maintain tight spreads – around 0.15% for major pairs like BTC/USDC. Market makers can earn returns of approximately 15% APR by capturing these spreads [4].

    For institutional users or traders handling significant volumes, platforms like dYdX V4, which combines off-chain matching with on-chain settlement via its Cosmos appchain, offer a strong mix of efficiency and security [3].

    sbb-itb-dd9e24a

    DEX Examples on Different Chains

    AMM Examples on Ethereum

    Here are some examples of AMMs on Ethereum, showcasing their ability to handle predictable execution:

    Synthetix uses SNX-backed pools to enable synthetic trades without slippage through atomic swaps. This method tackles the challenges AMMs face with large trades, as discussed in the Performance Analysis.

    GMX v2 takes AMM design further by introducing multi-asset liquidity pools and concentrated liquidity features [2][4]. However, during periods of extreme market volatility, slippage can exceed 1% due to delays in oracle data updates.

    Feature Synthetix GMX v2
    Liquidity Model SNX-backed Pools Concentrated Liquidity
    Max Leverage 10x 50x
    Slippage (100k Trade) Zero (synthetic) <0.1%
    Oracle System Chainlink Multi-source

    Orderbook Examples on Solana

    Solana’s high performance makes it an ideal platform for orderbook-based models, which thrive under certain conditions:

    Drift Protocol V2 takes a hybrid approach by blending traditional orderbook mechanics with dynamic market-making [4]. This setup allows for sub-second trade execution, fully leveraging the speed advantages highlighted in Orderbook Advantages.

    Defx Perps DEX utilizes Solana’s 400ms block times and Serum’s orderbook infrastructure [4]. To mitigate front-running risks, the platform employs block-synchronized batch auctions.

    With Solana supporting up to 50,000 transactions per second (TPS) compared to Ethereum’s 15 TPS, it offers much faster order execution. This speed advantage is especially critical during periods of market volatility, ensuring smoother trading experiences when timing is everything.

    New Developments in DEX Trading

    Price Oracle Systems

    Recent improvements in oracle systems are addressing some of the key challenges faced by AMM platforms by moving away from traditional on-chain price discovery methods. For example, Synquote’s oracle setup uses external price feeds to cut down on slippage during large-scale trades while still keeping the system decentralized. This is especially useful in markets like oil futures, where external pricing plays a major role [4][5].

    Chainlink has introduced a multi-layered consensus system with over 45 node operators to ensure both price accuracy and security [2][5].

    Key Features of Oracle-Enhanced DEXs
    Aggregated feeds from CEXs and DEXs
    Reduced slippage
    Reliable settlement processes
    Multi-node consensus for added security

    These advancements are particularly impactful for orderbook models that aim to combine decentralization with high-performance execution suited for institutional traders.

    Validator-Run Orderbooks

    Validator-run orderbooks are tackling the centralization challenges seen in hybrid DEX systems. A notable example is the launch of dYdX v4, a decentralized orderbook built using Cosmos SDK. This approach allows validators to manage orderbook components off-chain while ensuring on-chain settlement through cryptographic proofs [3][4].

    Performance highlights include:

    • 40% tighter spreads compared to dYdX v3
    • Over 90% uptime, rivaling centralized exchange reliability
    • Subsecond trade execution latency [3][5]

    The Elixir Protocol is also making waves by boosting market maker activity with automated strategies. Beta testing across five DEXs has shown a 300% increase in maker participation [3][4].

    Zeta Markets showcases the potential of hybrid systems by combining Serum’s orderbook engine with AMM-supported liquidity pools. This setup blends the dependable liquidity of AMMs with the precision of orderbooks, offering traders more versatile options [4][5].

    Conclusion: Making Your Choice

    Key Considerations

    After reviewing performance comparisons and specific examples, the right platform for you comes down to three main factors:

    1. Trade Size: Orderbook-based systems are ideal for handling large trades (up to $50M) with minimal slippage (less than 0.1%) [6][7]. On the other hand, AMMs perform well in emerging markets.
    2. Market Conditions: AMMs offer steady liquidity in stable markets, whereas orderbooks shine during periods of high volatility by providing more precise execution.
    3. Technical Features: Hybrid systems stand out, delivering spreads that are 40% tighter than purely on-chain solutions [3].

    How to Decide

    Orderbooks are a better fit for large, institutional trades that demand precision. Meanwhile, AMMs are more suited for retail traders seeking flexibility. For latency-sensitive strategies, platforms like Solana’s sub-100ms orderbook systems are ideal, while Ethereum-based AMMs lead in stablecoin trading.

    To make the best choice, consider:

    • Trade Volume vs. Liquidity: Match your average trade size with the platform’s liquidity capacity.
    • Response to Market Conditions: Use AMMs in stable, range-bound markets; opt for orderbooks during volatile periods.
    • Risk Management Features: Check the platform’s liquidation processes and whether it offers insurance funds for added security.

    Emerging protocols now combine the liquidity depth of AMMs with the precision of orderbook execution. This blend offers traders more advanced tools tailored to varying market scenarios, improving overall trading efficiency while retaining the core benefits of each approach.

    FAQs

    Here, we address key questions traders often have based on our analysis:

    What is the difference between AMM and order book?

    The main difference lies in how each handles trade execution and liquidity. Here’s a closer look:

    AMM Model:

    • Uses algorithms and liquidity pools for instant trades without needing a counterparty.
    • Allows anyone to provide liquidity, earning 0.3% in fees.
    • Faces risks like MEV (affecting about 0.5% of trades) [5].

    Orderbook Model:

    • Matches buy and sell orders directly, prioritizing price and time.
    • Often relies on professional market makers using hedging strategies [4].
    • Offers advanced tools like stop-loss orders.

    How do gas fees and transaction speeds compare?

    These factors depend heavily on the blockchain being used. Transaction costs and speeds can significantly influence trading strategies, varying from one platform to another.

    Which model is more secure?

    In terms of security:

    • AMMs avoid custodial risks but are vulnerable to MEV (affecting ~0.5% of trades) [5].
    • Orderbooks, especially hybrid ones, may introduce some centralization risks due to their design.

    What’s the current market share of each model?

    Orderbooks currently lead with a 65% market share and $28 billion in volume. AMMs, however, are growing faster, with a 40% quarter-over-quarter growth rate compared to 25% for orderbooks [3][4]. Oracle-based systems hold the remaining 5%, accounting for $2 billion in monthly volume.

    Are hybrid solutions available?

    Yes, hybrid models are emerging as a blend of the two approaches:

    • They combine the efficiency of orderbooks with the liquidity depth of AMMs.
    • Validator-run pools are introduced to enhance decentralization.
    • These solutions aim to improve both trade execution speed and liquidity access.

    Related Blog Posts

  • Avoiding Confirmation Bias in High-Leverage Crypto Trades

    Avoiding Confirmation Bias in High-Leverage Crypto Trades

    High-leverage crypto trading is risky – confirmation bias makes it worse. Traders using 50x or higher leverage are 73% more likely to ignore opposing signals, leading to poor decisions and liquidations. Here’s how to avoid it:

    • Key Risks: Emotional decisions, ignoring data, doubling down on losses.
    • Solutions: Use pre-trade checklists, structured rules, and tools like stop-loss orders.
    • Impact: Traders with systematic approaches see 41% fewer liquidations and 29% better returns.

    Start by questioning your assumptions, analyzing opposing data, and managing risk with clear entry/exit rules. Tools like Defx can help detect bias and enforce discipline. High-leverage trading requires objectivity – stay systematic to succeed.

    How Confirmation Bias Affects Leverage Trading

    Understanding Confirmation Bias

    In crypto trading, confirmation bias shows up when traders focus only on information that supports their current positions and ignore anything that contradicts them. A striking example comes from the 2024 Bitcoin ETF approvals, where 43% of traders using 25x or higher leverage ignored clear sell-off signals after the news broke [4].

    Here are some common ways confirmation bias affects trading:

    Behavior Pattern Impact on Trading Risk Level
    Cherry-picking Technical Indicators Overlooks conflicting signals High
    Ignoring Fundamental Changes Misses important market shifts Severe
    Rationalizing Losses Blocks strategy adjustments Critical
    Doubling Down on Positions Deepens existing losses Extreme

    How Leverage Intensifies Bias

    High leverage creates intense pressure, making confirmation bias even worse. Research from IG shows that traders using leverage above 20x face a 63% higher chance of liquidation, often due to decisions driven by emotion rather than logic [7][8].

    The higher the leverage, the more biased decisions become. For example:

    • At 25x leverage, traders are twice as likely to make biased decisions compared to those at 10x.
    • At 50x leverage, this jumps to 3.8 times more bias [7][8].

    Why does this happen? Cognitive studies reveal that stress from high leverage cuts analytical thinking by 40% [3]. This mental strain leads to a chain reaction of poor choices.

    Take Defx traders using 50x leverage – many double down on losing trades instead of reevaluating their strategy [6][8]. Similarly, Solana traders with 50x leverage often ignore conflicting on-chain metrics when their positions go south. These patterns show how confirmation bias can spiral out of control, emphasizing the importance of tools like pre-trade checklists, which we’ll explore in the next section.

    Pre-Trade Checklist

    Clear Entry Rules

    Having specific entry criteria is key to avoiding emotionally-driven mistakes in high-leverage trading. Studies indicate that traders who stick to strict pre-trade rules are 63% less likely to make decisions that lead to liquidations [7].

    Indicator Type Minimum Requirement Risk Level Check
    Trend Confirmation Price above 200-MA (4h) Primary
    Momentum Check RSI < 30 (oversold) Secondary
    Volume Validation 150% above 20-period average Critical
    Volatility Assessment ATR-based leverage caps Essential

    Volatility-Based Leverage Limits:

    • Low volatility (ATR <$300): Up to 30x leverage
    • High volatility (ATR >$800): Up to 15x leverage [2]

    Check Opposing Data

    Before finalizing any high-leverage trade, it’s crucial to analyze opposing evidence. Professional traders spend 80% of their pre-trade preparation questioning their initial assumptions [3].

    "One trader avoided liquidation by reducing a planned 50x ETH long position by 80% after reviewing counter-signals, just before prices reversed."

    Key areas to double-check include:

    • Market Structure: Look at funding rates and exchange reserves to spot overcrowded positions.
    • Timeframe Validation: Ensure signals align across daily and 1-hour charts.
    • Liquidity Mapping: Identify liquidation clusters close to your entry points.

    Platforms like Defx simplify this process with tools such as:

    • Multi-source oracle price feeds to avoid reliance on a single liquidity pool.
    • Historical liquidation heatmaps to pinpoint risk zones.
    • Cross-platform funding rate comparisons to detect market imbalances [9].

    Trade Management Steps

    Position Size and Risk Limits

    Experienced traders determine position sizes by risking just 1-2% of their account per trade, divided by the stop-loss distance.

    Volatility Level Recommended Leverage Margin Buffer Max Position Size Bias Protection
    Low (<5% daily) Up to 30x 10% 2% account risk Prevents overconfidence
    Medium (5-10%) Up to 20x 15% 1.5% account risk Reduces emotional reactions
    High (>10%) Up to 10x 20% 1% account risk Encourages objective decisions

    These guidelines act as guardrails, helping traders avoid doubling down on emotional or biased decisions.

    Stop-Loss and Profit Targets

    Automated exit strategies are key to removing emotion from trading decisions. As one professional trader explains:

    "Using volatility-based indicators like Average True Range (ATR) helps set stop-loss distances objectively, removing emotional attachment to specific price levels while respecting market conditions." [3]

    For managing risk in leveraged trades, follow these steps:

    • Set your initial stop-loss at 1.5x ATR below the entry price for long trades.
    • Aim for a risk-reward ratio of 2:1 or 3:1.
    • Use trailing stops that adjust as the trade moves in your favor.

    Platforms offering volatility-adjusted calculators and automated triggers can help enforce these rules without manual intervention.

    When handling profitable trades:

    • Take 50% profit at a 1:1 reward ratio.
    • Move the stop-loss to breakeven.
    • Let the rest of the position run with a trailing stop. [5]

    This structured approach eliminates guesswork and counters confirmation bias by setting clear exit rules in advance.

    sbb-itb-dd9e24a

    The Danger of Confirmation Bias When Trading – And How to Fix It

    Learning from Trade Results

    Executing trades with discipline is just the beginning. The real insights come from analyzing your results afterward. Regular post-trade reviews help uncover patterns of confirmation bias that you might miss in the heat of the moment.

    Trade Journal Methods

    A well-organized trade journal is your first line of defense against confirmation bias. Professional traders rely on detailed journaling to record decisions before knowing the outcomes. The goal? Capture your entire thought process, not just the technical details.

    Journal Component Required Details Why It Matters
    Pre-Trade Analysis Timestamped entry, chart screenshots Stops you from rationalizing after the fact
    Entry Rationale Specific technical/fundamental reasons Keeps your original thesis documented
    Risk Parameters Position size, leverage level Ensures you stick to your rules
    Emotional State 1-5 scale rating, e.g., "FOMO influenced position sizing" Tracks psychological influences
    Market Context On-chain data, exchange flows Reduces hindsight bias

    For better objectivity, make sure to log emotional states and any external pressures that may have affected your decisions.

    Failed Trade Analysis

    When a trade goes south, it’s essential to review it systematically. This helps you identify and address confirmation bias. A helpful tool for this is the PROOF framework:

    • Premise validation: Did your original thesis align with reality?
    • Risk assessment: Did you follow your risk rules, or were they altered by emotions?
    • Opposite analysis: What bearish signals did you overlook?
    • Outcome drivers: What actually moved the market versus what you expected?
    • Future prevention: Note specific biases to avoid in similar scenarios.

    Platforms like Defx can enhance this process by integrating blockchain analytics. For example, you can verify your trade decisions by cross-referencing them with exchange netflows, smart money activity, and funding rate discrepancies. This data gives a clearer picture of market dynamics during your trade.

    One metric to watch closely is your confirmation ratio: (confirming signals noted) / (total available signals). If this ratio exceeds 70%, it’s a red flag for strong confirmation bias [3]. Defx’s performance analytics module can calculate this and other bias-detection metrics automatically, helping you stay grounded in your analysis.

    For trades that were emotionally charged, wait at least 72 hours before reviewing them. This cooling-off period allows you to separate emotions from facts, making it easier to objectively assess what really went wrong.

    Tools to Reduce Trading Bias

    Using the PROOF framework for post-trade analysis, these technical tools help traders stay objective during active trading:

    Defx Trading Tools

    Defx

    Automated alerts in Defx tools help spot common blind spots by tracking:

    Alert Type Function How It Helps
    Divergence Detection Highlights mismatches between price and volume Avoids misinterpreting selective data
    Multi-Indicator Conflicts Flags when 3+ technical indicators disagree Encourages reviewing opposing signals
    Funding Rate Shifts Tracks sudden changes across exchanges Exposes shifts in market sentiment

    The non-custodial design ensures traders manually review decisions instead of making impulsive moves [11][10].

    Multi-Source Data Checks

    Leverage three types of data for better decision-making:

    • On-chain metrics
    • Exchange data
    • Social signals [3][11][12]

    A recommended data verification process includes:

    Data Source Key Metrics How to Use
    Price Action Validation ±2% interval alerts with volume confirmation Set automated alerts requiring a 15% volume spike

    This approach has shown measurable results:

    • A 30% drop in trades closed too early
    • A 2:1 ratio of data sources consulted per trade decision [3][10]

    To strengthen these checks, integrate Defx alerts with external tools designed to detect bias [5][10][12]. Configure your dashboard to show conflicting technical analyses side-by-side. This setup forces you to actively evaluate opposing signals before making a trade, helping you stay objective even in unpredictable market conditions.

    When paired with journaling techniques from Section 4, these tools contribute to a more disciplined and impartial trading system.

    Summary

    High-leverage trading requires careful management of bias, achieved through structured and systematic methods. A successful approach to minimizing bias includes:

    Component Implementation Impact Metric
    Multi-Source Analysis 60% technical, 30% fundamental, 10% sentiment checks 3:1 profit target vs. early exit ratio
    Automated Risk Management Trailing stop-loss orders at key levels 55%+ win rate across market conditions

    To stay consistent, use the checklist methods outlined in Sections 2-4. Schedule focused analysis sessions and implement DEX-enforced position limits. For platforms like Defx (covered in Section 5), set up automated alerts to catch divergence signals and multi-indicator conflicts. Additionally, maintain detailed trade journals to monitor both technical and emotional aspects of your trades [4][3].

    In high-leverage environments, confirmation bias poses a serious risk, especially under pressure, where traders may interpret data selectively. A systematic approach – relying on diverse data sources and automated risk management – helps traders stay objective, even in volatile markets [1][9].

    Related Blog Posts