Bitcoin MVRV Signal Flashes Buy Zone as BTC Tests $82K Support
Bitcoin’s MVRV ratio approaches key accumulation zone as price tests $82K support – learn why this technical signal could mark the next major buying opportun…
Bitcoin’s price action has turned bearish as the leading cryptocurrency struggles to maintain support at $82,000, with key technical indicators suggesting a potential buying opportunity may be approaching. Recent market volatility has intensified fear among investors, but on-chain metrics paint a more nuanced picture.
Bitcoin Price Under Pressure as Bears Target $80K
After briefly touching $87,000 earlier this week, Bitcoin has faced intense selling pressure, with bears now eyeing a move below the critical $80,000 support level. The failure to reclaim the key $90,000 resistance has shifted momentum sharply in favor of sellers, dragging BTC into deeper uncertainty amid broader macroeconomic concerns.
MVRV Ratio Approaches Historical Accumulation Zone
Despite the current market weakness, renowned analyst Ali Martinez has identified a potentially significant buying signal emerging from Bitcoin’s Market Value to Realized Value (MVRV) Ratio. According to Martinez, the next prime accumulation zone could materialize when the MVRV crosses above its 70-day moving average – a pattern that has historically marked attractive entry points for long-term investors.
Technical Analysis: Key Support and Resistance Levels
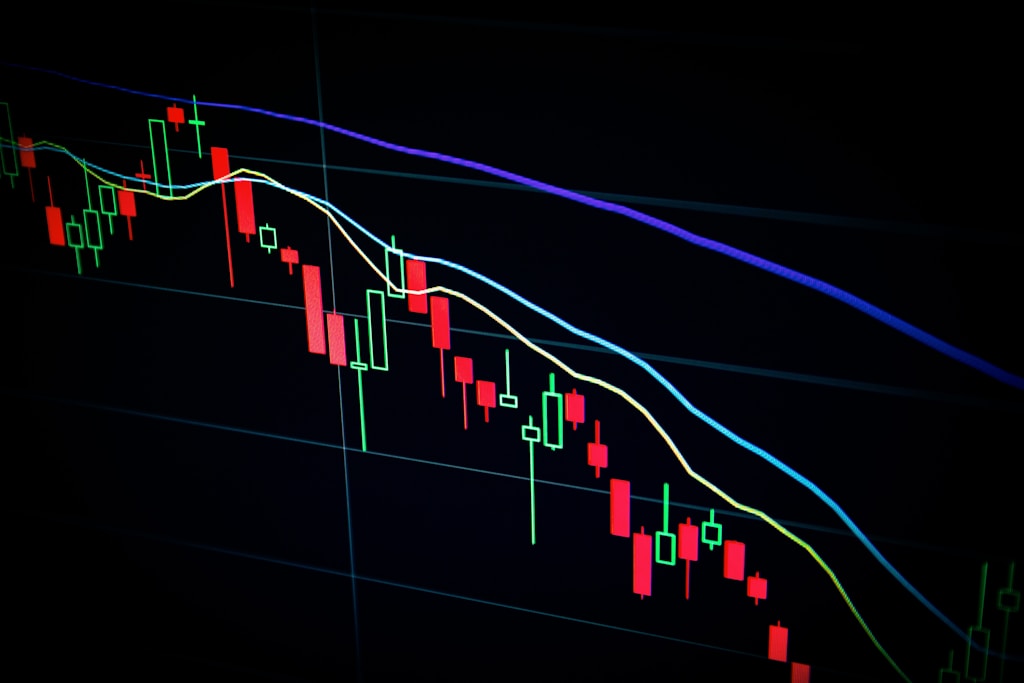
Bitcoin is currently testing crucial support at $82,000, with several technical indicators suggesting oversold conditions. The 4-hour chart shows BTC trading below both the 200 MA and EMA, clustered in the $87K-$85K range. These moving averages have historically provided dynamic support during uptrends, making their reclamation essential for any sustained recovery.
Market Outlook and Trading Implications
For bulls to regain control, Bitcoin needs to decisively break above $85,000 and reclaim the key moving averages as support. A failure to hold the $82,000 level could trigger a deeper correction toward sub-$80K prices, potentially offering the accumulation opportunity signaled by the MVRV metric.
FAQ Section
What is the Bitcoin MVRV Ratio?
The MVRV Ratio compares Bitcoin’s market value to its realized value, helping identify periods of overvaluation or undervaluation. When the ratio crosses above its moving average after a decline, it often signals potential buying opportunities.
What are the key support levels to watch?
Current critical support levels include $82,000 and $80,000. Below these, the next major support zones lie at $77,000 and $75,000.
When might the next bull run begin?
While timing market bottoms is challenging, the MVRV indicator suggests an accumulation phase could begin once the ratio crosses above its 70-day moving average, potentially marking the start of the next upward cycle.


