Bitcoin Price Battles $88K Resistance: Key Levels for Next Major Move
Bitcoin faces crucial $88K resistance as technical indicators signal potential breakout. Analysis reveals key support at $86,400 and upside target of $90K. L…
Bitcoin (BTC) continues to face a critical juncture at the $88,000 resistance level, with technical indicators suggesting a potential breakout could be imminent. As Bitcoin maintains support above $87,500 despite recent market turbulence, traders are closely monitoring key price levels that could determine the next significant move.
Current Market Structure and Key Support Levels
Bitcoin’s price action shows resilience above the crucial $86,000 support zone, with bulls defending multiple attempts to break lower. The cryptocurrency has established a series of higher lows, suggesting accumulation at these levels:
- Strong support base: $85,500
- Immediate resistance: $87,700
- Critical breakout level: $88,000
- Next major target: $90,000
SPONSORED
Trade Bitcoin with up to 100x leverage and maximize your profit potential
Technical Analysis Breakdown
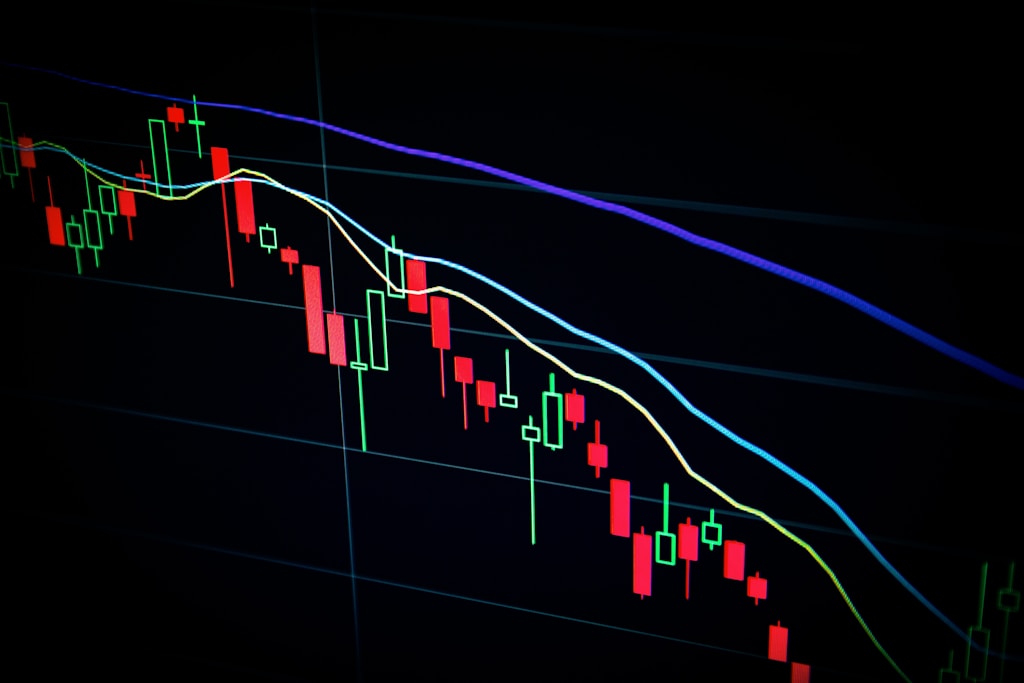
The hourly chart reveals several critical technical factors:
- Bearish trend line resistance at $88,000
- Trading below the 100-hour Simple Moving Average
- RSI below 50, indicating slight bearish momentum
- MACD showing increasing bearish pressure
Potential Scenarios and Price Targets
Two primary scenarios are emerging:
Bullish Case
- Break above $88,250 could trigger rally to $90,000
- Volume profile supports potential upside break
- Fibonacci retracement levels suggest strong support
Bearish Case
- Failure at $88,000 could lead to retest of $86,400
- Major support at $85,850 must hold
- Risk of decline to $84,500 if support breaks
Expert Insights and Market Sentiment
Market analysts remain cautiously optimistic, with some projecting targets as high as $260,000 in the longer term. However, immediate price action will likely depend on the resolution of the current consolidation pattern.
FAQ Section
What is the key resistance level for Bitcoin right now?
The primary resistance level is at $88,000, with additional resistance at $88,250.
Where is the strongest support level?
The strongest support level is at $85,500, followed by $84,500.
What technical indicators should traders watch?
Key indicators include the 100-hour SMA, RSI, and MACD, which are currently showing mixed signals.
Conclusion: Bitcoin’s price action at the $88,000 resistance level will likely determine the next major move. Traders should monitor volume and technical indicators while maintaining strict risk management practices.


