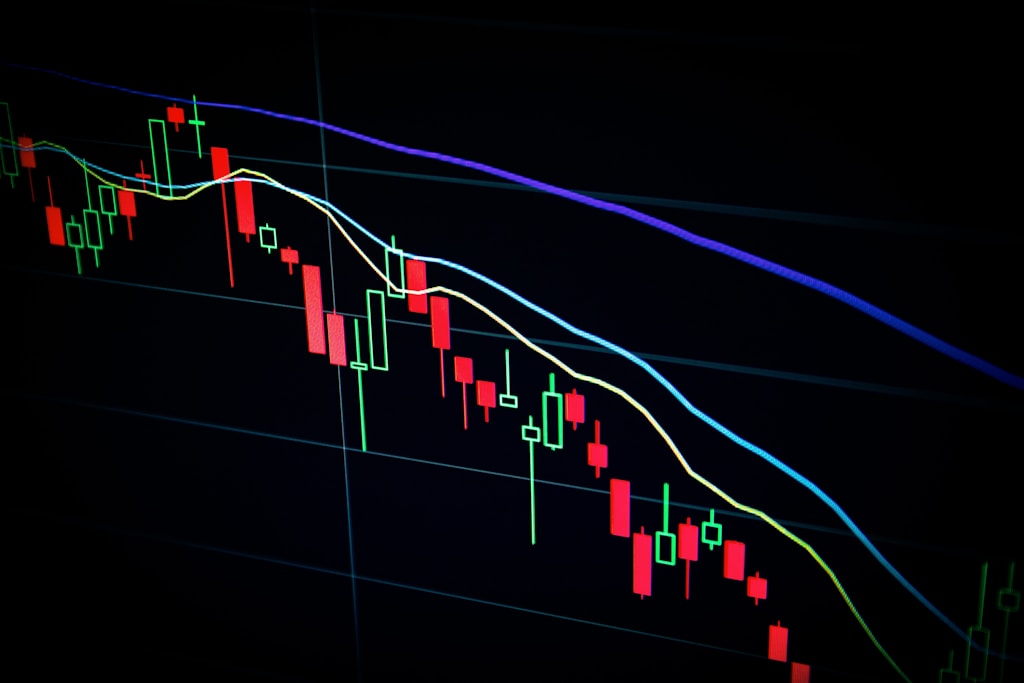
Bitcoin Price Holds $109K Support as M2 Money Supply Signals Rally
Bitcoin maintains $109K support as Global M2 Money Supply correlation signals continued upside potential, with analyst projecting $130K target despite recent…

Bitcoin’s recent pullback from its all-time high of $111,900 has sparked debate about the sustainability of the current rally. However, key support levels remain intact, with the leading cryptocurrency finding strong buying interest above $109,000. More importantly, a crucial macroeconomic indicator suggests this bull run may just be getting started.
Global M2 Money Supply Correlation Points to Further Upside
According to crypto analyst Colin’s detailed analysis shared on X (formerly Twitter), Bitcoin continues to demonstrate a remarkable 93% correlation with global M2 money supply data, offset by an 82-day lag. This historically reliable indicator recently hit new all-time highs, suggesting Bitcoin’s price could follow suit in the coming months.
The correlation between Bitcoin and M2 money supply has been particularly strong over the past 18 months, with Bitcoin’s price movements closely mirroring changes in global liquidity conditions. This alignment with fundamental monetary metrics provides a strong foundation for continued price appreciation.
Technical Analysis Supports Bullish Outlook
The recent pullback to $107,500 appears to be a healthy retracement within the broader uptrend. Bitcoin has maintained support above the critical $102,000-$104,000 range, suggesting bulls remain in control. The CBBI (Crypto Bull Run Index) reading of 79 indicates there’s still significant room for growth before reaching overbought conditions.
Market Sentiment and Future Projections
Despite some skepticism in social sentiment, the underlying data remains strongly bullish. Colin’s analysis projects potential moves toward $130,000 and beyond if the M2 correlation continues to hold. His previous prediction of May’s breakout from $74,000 proved accurate, lending credibility to his current analysis.
Frequently Asked Questions
What is the Global M2 Money Supply?
The Global M2 Money Supply is a measure of the total money circulating in the world’s major economies, including cash, checking deposits, and easily convertible near money.
Why is the 82-day lag significant?
The 82-day lag represents the historical average time between changes in global M2 supply and corresponding movements in Bitcoin’s price, allowing for predictive analysis.
What could invalidate this bullish outlook?
A sustained break below the $102,000 support level or significant deviation from the M2 correlation pattern could signal a change in market structure.


