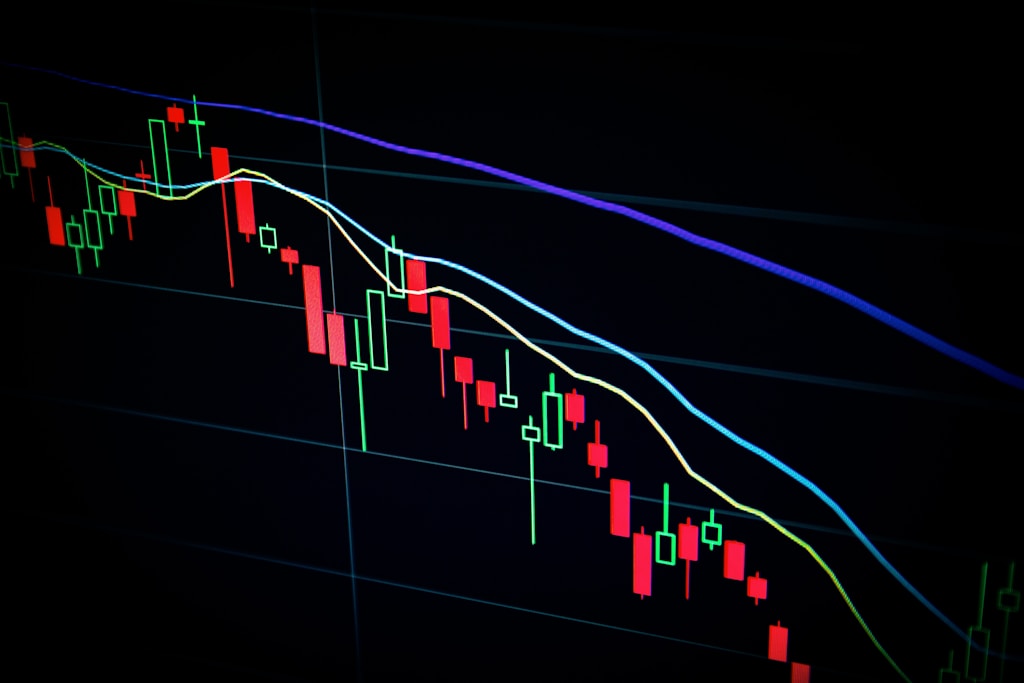
Bitcoin Price Whipsaws at $85K: Bears Maintain Control Despite Recovery
Bitcoin price experiences wild swings at $85K as bears maintain control despite recovery attempts. Key support at $82,200 crucial for preventing further down…

Bitcoin’s price action continues to display significant volatility, with the leading cryptocurrency experiencing sharp swings around the $85,000 level. As market confidence remains shaken, traders are closely monitoring key support and resistance levels that could determine BTC’s next major move.
Bitcoin’s Wild Price Swings: A Technical Analysis
After establishing support above $82,500, Bitcoin initiated a recovery wave that pushed prices above several key resistance levels. The upward momentum carried BTC to a local high of $89,042, demonstrating the market’s continued appetite for higher prices. However, this bullish move proved unsustainable as sellers quickly emerged to drive prices lower.
Key Technical Levels to Watch
- Current Price: $83,500
- Key Resistance: $85,000 – $85,550
- Critical Support: $82,200 – $82,800
- Major Support: $80,000
Technical Indicators Signal Bearish Pressure
The hourly chart reveals concerning signals for Bitcoin bulls. The MACD indicator is losing momentum in bearish territory, while the RSI remains below the crucial 50 level, suggesting continued downside pressure. The break below the bullish trend line at $85,000 further compounds technical weakness.
Potential Scenarios for Bitcoin’s Next Move
Two primary scenarios are emerging for Bitcoin’s short-term price action:
Bullish Case:
- Break above $85,550 could trigger rally to $86,800
- Further upside potential toward $88,000-$88,500
- Must maintain support above $82,200
Bearish Case:
- Failure to breach $85,000 resistance
- Risk of decline toward $81,350
- Possible test of psychological $80,000 support
FAQ: Bitcoin’s Current Market Position
What’s causing Bitcoin’s current volatility?
Market uncertainty and technical factors are contributing to increased price swings, with broader market concerns adding to the volatility.
Where is the next major support level?
The critical support zone lies between $82,200 and $82,800, with the psychological $80,000 level serving as the last major defense.
What technical indicators should traders watch?
Focus on the hourly MACD and RSI indicators, along with the key price levels at $85,000 and $82,200 for potential trend confirmation.
As Bitcoin continues to navigate this crucial price range, traders should maintain strict risk management and watch for clear breakout signals above $85,550 or breakdown below $82,200 to confirm the next directional move.


