Bitcoin RSI Breaks Key Downtrend: $89K Resistance Tests Bulls
Bitcoin breaks crucial RSI downtrend while approaching $89K resistance level – analysts weigh in on potential trend reversal and key price targets ahead
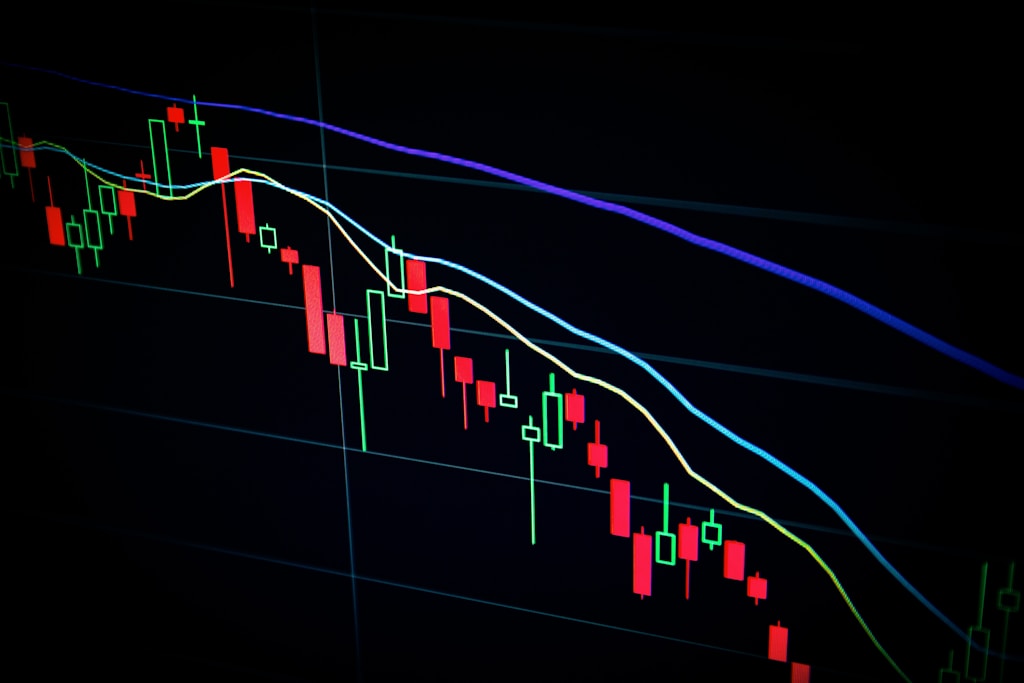
Bitcoin (BTC) has achieved a significant technical milestone by breaking its daily Relative Strength Index (RSI) downtrend, while trading in the high $80,000s. However, analysts warn that the leading cryptocurrency faces crucial resistance levels that could determine its next major move.
Technical Breakthrough: RSI Signals Potential Trend Reversal
After reaching a local bottom near $76,000 on March 10, Bitcoin has shown remarkable recovery strength. Similar to patterns observed in Summer 2024, the cryptocurrency’s technical indicators are suggesting a potential trend reversal.
Crypto analyst Rekt Capital highlighted a critical development in Bitcoin’s daily chart – the breakout from a multi-month RSI downtrend that had been in place since early 2025. For traders and investors, the RSI serves as a key momentum indicator, helping identify potential overbought or oversold conditions.
SPONSORED
Maximize your trading potential with up to 100x leverage on perpetual contracts
Multiple Bullish Indicators Align
Supporting the RSI breakout, the Bitcoin Hash Ribbons indicator has also turned bullish – a historically significant signal that has preceded major price rallies. This technical development suggests that Bitcoin miners are returning to the network after a period of capitulation, typically marking the end of bearish phases.
Key Resistance Levels Ahead
Despite the positive technical developments, seasoned analyst Ali Martinez identifies significant resistance around $89,000, where the 50-day moving average converges with the descending trendline from the all-time high. This level represents a critical test for Bitcoin’s current rally.
Market Outlook and Price Targets
Several analysts have shared their predictions for Bitcoin’s next moves:
- Robert Mercer projects BTC reaching $100,000+ in Q2 2025
- Maartunn emphasizes the importance of clearing $87,000 for sustained momentum
- The M2 Guy points to expanding money supply as a potential catalyst
FAQ Section
What does the RSI breakout mean for Bitcoin?
The RSI breakout suggests growing bullish momentum and could signal the end of the recent corrective phase.
What are the key resistance levels to watch?
The primary resistance cluster sits at $89,000, with secondary resistance at the psychological $90,000 level.
When could Bitcoin reach $100,000?
Analysts project potential achievement of $100,000 in Q2 2025, contingent on maintaining current momentum.
At press time, Bitcoin trades at $87,674, showing a slight 0.7% decline over the past 24 hours as traders await confirmation of the technical breakout.


