Bitcoin RSI Hits Critical 30 Level: Historical Data Points to $120K Target
Bitcoin’s RSI drops below 30 for the first time in this bull cycle, historically signaling major rallies. Key support levels and on-chain metrics suggest pot…

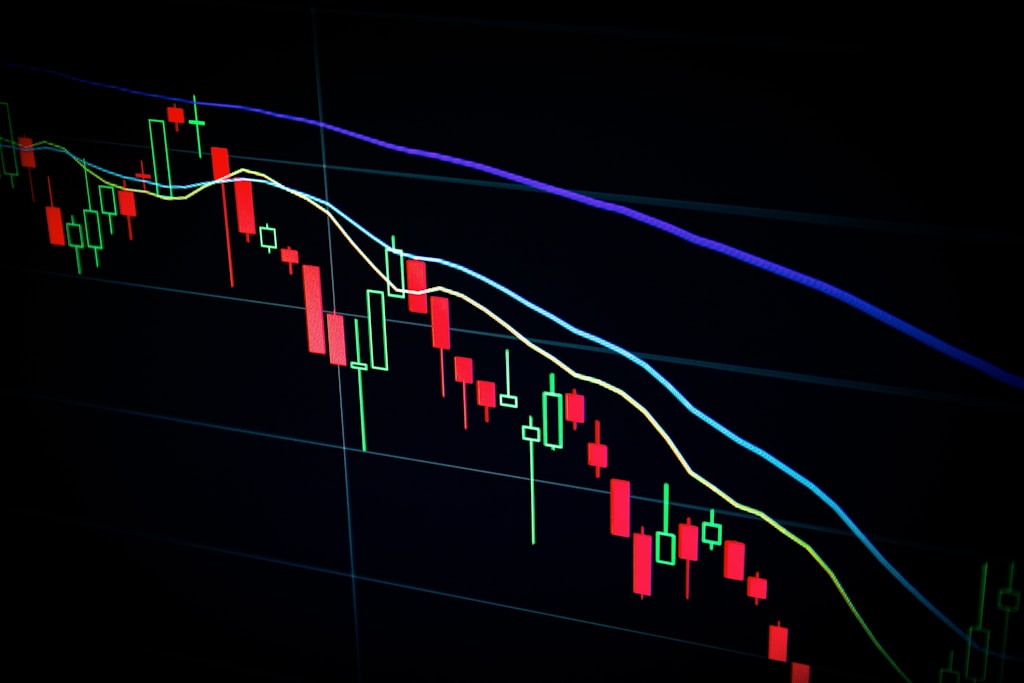
Bitcoin’s Relative Strength Index (RSI) has plunged below the critical 30 level, historically a powerful indicator of oversold conditions that precede major rallies. As BTC tests crucial support levels around $100,000, technical and on-chain metrics suggest a potential springboard for new all-time highs.
Understanding Bitcoin’s RSI Signal
The 14-day Relative Strength Index (RSI) for Bitcoin has dropped into oversold territory below 30, a technical event that has historically preceded significant price recoveries. This momentum indicator measures both the speed and magnitude of recent price movements, helping identify potential reversal points in the market.
SPONSORED
Trade Bitcoin with up to 100x leverage and maximize your profit potential
Key Support Levels and On-Chain Analysis
According to Glassnode data, several critical support levels are converging:
- Short-term holder cost basis: $97,100
- SSD Quantile (0.85): $95,600
- Standard deviation band (-1): $83,200
Historical Precedent and Market Outlook
Previous instances of RSI dropping below 30 during bull markets have led to average gains of 40% within the following 30 days. With Bitcoin currently trading around $101,000, a similar move could push prices toward the $120,000 level.
FAQ Section
What does an RSI below 30 mean for Bitcoin?
An RSI below 30 indicates oversold conditions, suggesting that the selling pressure may be exhausted and a price reversal could be imminent.
How reliable is the RSI as a predictor?
While no indicator is perfect, the RSI has historically been one of the more reliable technical tools for identifying potential market reversals, especially during bull markets.
What are the key price levels to watch?
The most important support levels are $97,100 (STH cost basis), $95,600 (SSD Quantile), and $83,200 (standard deviation band).


