Best Dune dashboards in 2025
Explore the top Dune dashboards of 2025 that transform blockchain data into actionable insights for traders and analysts.
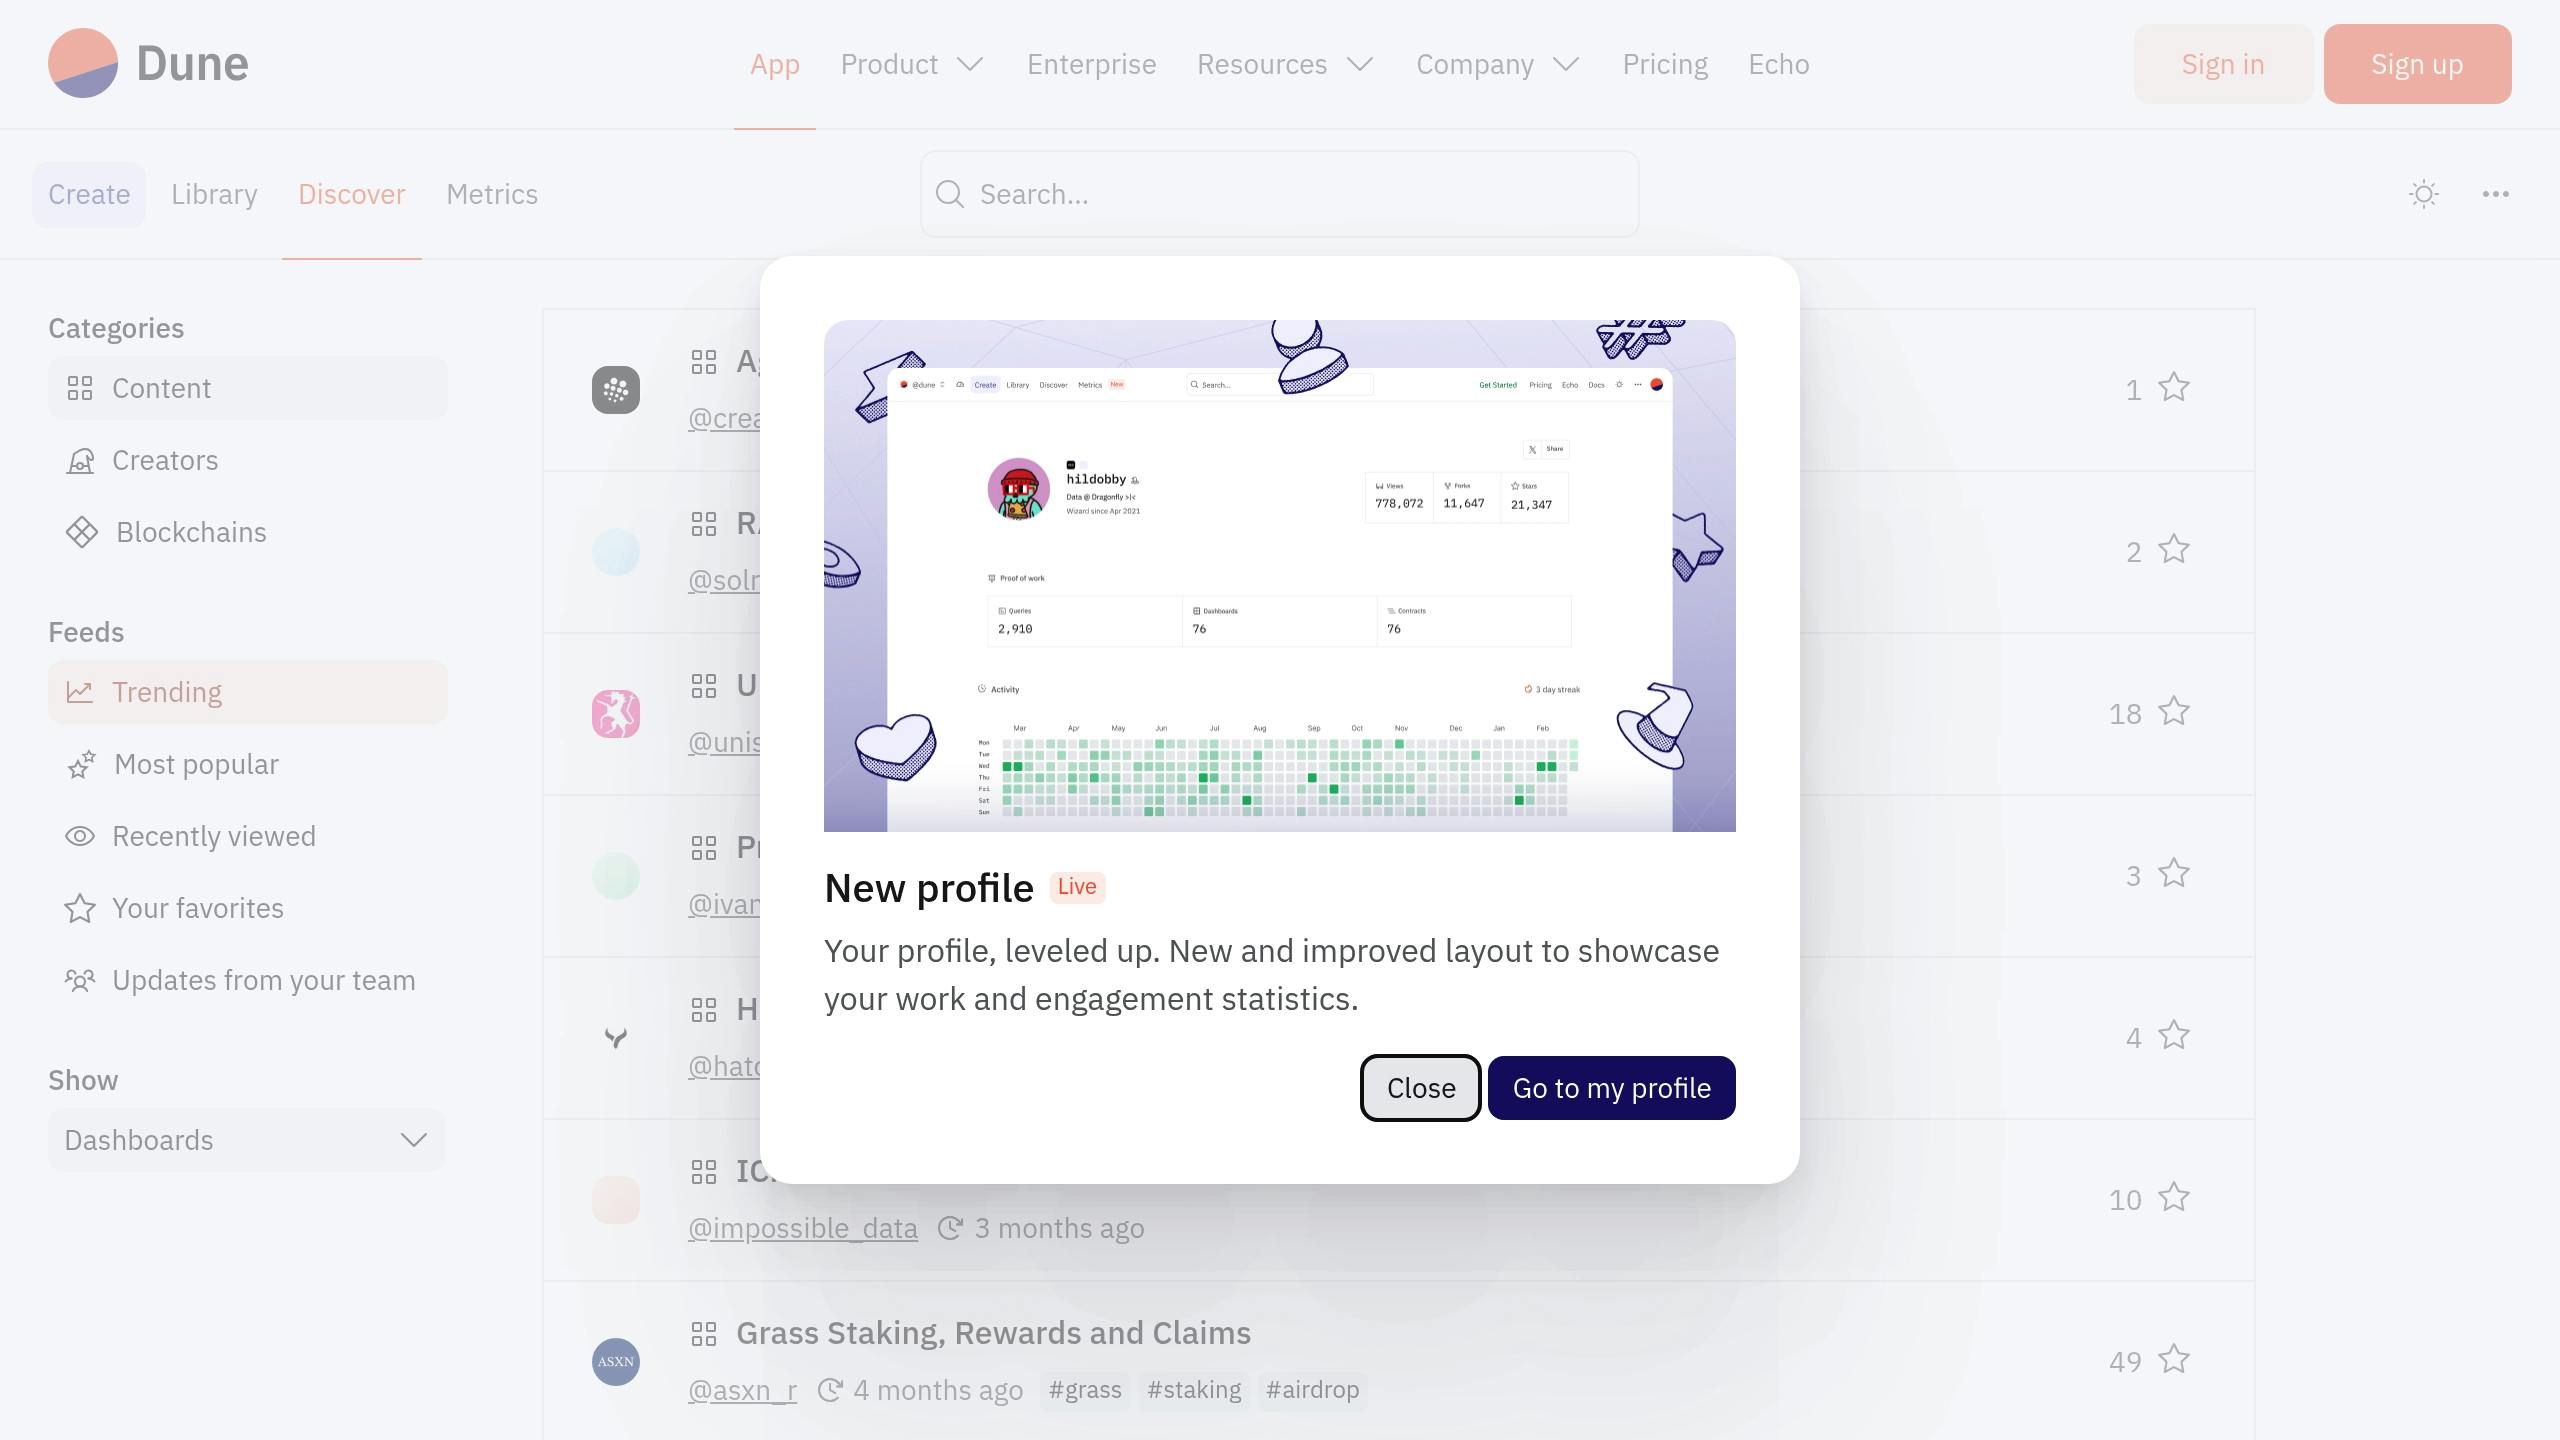
Dune Analytics is the go-to platform for blockchain data in 2025. With over 750,000 dashboards and real-time insights from 30+ blockchains, it simplifies complex crypto data into actionable information for traders, analysts, and developers. Here are the top dashboards you should know:
- Defx Market Data Dashboard: Tracks trading volumes, leverage positions, and risk metrics for decentralized perpetual futures.
- Token Price Analysis Dashboard: Offers real-time token price tracking, technical indicators, and Layer-2 trends.
- Blockchain Data Dashboard: Simplifies on-chain metrics like network activity, fees, and hash rates for smarter decision-making.
- Large Trader Activity Dashboard: Monitors whale movements, smart wallets, and market sentiment shifts.
- NFT Market Data Dashboard: Provides detailed analytics on NFT collections, trading activity, and market trends.
These dashboards empower users with tools to monitor trends, manage portfolios, and gain insights across the crypto ecosystem. Below is a quick comparison of their key features.
Quick Comparison
| Dashboard | Key Focus Areas | Unique Features |
|---|---|---|
| Defx Market Data | Trading metrics, market performance, risk | Cross-chain analytics, leverage tracking |
| Token Price Analysis | Token price trends, technical indicators | Customizable charts, price alerts |
| Blockchain Data | Network activity, fees, hash rates | MVRV Ratio, supply analysis |
| Large Trader Activity | Whale tracking, smart wallets, sentiment | Smart wallet tracking, flow mapping |
| NFT Market Data | NFT collections, trading activity, trends | Floor price evolution, collection rankings |
Dive deeper to explore how these dashboards are transforming crypto analytics in 2025.
Dune Analytics: Platform Deep Dive and Dashboard Guide
1. Defx Market Data Dashboard
The Defx Market Data Dashboard is a powerful tool for tracking decentralized perpetual futures. Built to monitor Defx’s trading features, it uses Dune’s extensive multi-chain dataset to provide deep insights.
It focuses on three main areas of market activity:
-
Trading Metrics
- Daily trading volume for various token pairs
- Trends in open interest with leverage positions up to 50x
- Real-time data on liquidations
- Distribution of positions across the market
-
Market Performance
- Price changes and volatility trends
- Analysis of order book depth
- Spread comparisons between trading pairs
- Calculations of volume-weighted average price (VWAP)
-
Risk Analytics
- Indicators for liquidation risk
- Metrics for position concentration
- Statistics on margin health
- Patterns in historical volatility
These metrics highlight the dashboard’s ability to provide actionable insights.
"Dune has by far the largest and most comprehensive dataset on the market", says Dan Smith, Senior Research Analyst .
One of the dashboard’s standout features is its integration with Dune’s multi-chain data, allowing traders to monitor Defx’s performance across multiple chains at the same time.
Key Features and Benefits
| Feature | Benefit |
|---|---|
| Real-time Volume Tracking | Keep an eye on market liquidity and trading activity |
| Position Size Analysis | Spot large trader movements and their potential impact |
| Cross-chain Analytics | Analyze trading patterns on Ethereum, Solana, and more |
| Leverage Distribution | Assess market risk by examining leverage usage |
The dashboard also tracks pre-launch token markets, helping traders identify new opportunities early on.
For professionals, it connects seamlessly with Dune’s daily data feed, offering real-time updates crucial for making informed decisions in leverage trading.
2. Token Price Analysis Dashboard
The Token Price Analysis Dashboard offers real-time tracking of token performance across multiple chains, leveraging Dune’s dataset. Unlike broader market-focused tools, this dashboard hones in on specific token price trends.
Key Areas of Focus
-
Price Movement Analytics
This section uses dynamic charts and technical indicators like moving averages, Bollinger Bands, and RSI to monitor over 7,000 cryptocurrencies. These tools provide insights to fine-tune trading strategies in unpredictable markets. -
Market Performance Metrics
Visual representations showcase major market shifts and trends. Here’s a snapshot:Metric Platform/Token Performance Market Cap Mummy Finance +768.8% increase DEX Volume SpookySwap +119.2% trading surge Active Users friend.tech +5,083.6% weekly Liquidity SpookySwap +45.6% TVL growth -
Trading Indicators
Real-time exchange rates, conversion data, and custom alerts keep traders informed about critical price changes.
Key Features
- Live updates on prices, market capitalization, and trading volume
- Customizable technical charts for deeper analysis
- Cross-chain analytics to provide a unified view of token performance
- Price alerts to catch important market changes
The dashboard also tracks Layer-2 trends by monitoring bridge deposits, uncovering new opportunities in DeFi. For advanced traders, API integration supports automated data collection and analysis, enabling more complex trading strategies.
sbb-itb-dd9e24a
3. Blockchain Data Dashboard
The Blockchain Data Dashboard simplifies complex on-chain data, turning it into actionable insights for traders. It takes raw blockchain metrics and presents them in a way that helps inform smarter trading decisions.
Key Metrics Overview
Inspired by Dune’s intuitive analytics, this dashboard highlights essential network metrics:
| Metric Type | What It Shows | Market Impact |
|---|---|---|
| Network Activity | Daily active addresses, transaction count | Gauges user engagement levels |
| Exchange Flows | Inflow/outflow volumes | Tracks accumulation or distribution patterns |
| Fee Analysis | Monitors fees and gas costs | Indicates network demand |
| Hash Rate | Measures network security strength | Reflects infrastructure stability |
Advanced Analytics Features
The dashboard goes beyond basic metrics, offering tools that allow traders to:
- Analyze network performance across multiple blockchains
- Review historical trends and set up custom alerts
- Observe real-time network activity for timely decisions
Market Insight Tools
To help traders stay ahead, the platform includes analysis tools that reveal market patterns using on-chain signals. For example, the MVRV Ratio compares realized value to market value, helping identify potential market turning points .
Professional Trading Features
For experienced traders, the dashboard provides specialized tools such as:
- Supply Analysis: Tracks cost basis zones where large trading volumes occur.
- Profit Tracking: Measures how realized market actions align with unrealized profit or loss.
- Network Health Indicators: Evaluates blockchain stability using multiple metrics.
These features, when combined with technical analysis, offer a well-rounded approach to trading strategies.
4. Large Trader Activity Dashboard
The Large Trader Activity Dashboard provides real-time updates on whale movements and major transactions. It keeps traders informed about activities that can influence the market and signal potential trend changes.
Whale Transaction Monitoring
According to SEC guidelines , trading activity is considered large when it meets these thresholds:
| Activity Type | Daily Threshold | Monthly Threshold |
|---|---|---|
| Volume-Based | 2 million shares | 20 million shares |
| Value-Based | $20 million | $200 million |
The dashboard uses these benchmarks to offer precise tracking and analysis.
Smart Money Tracking Features
This tool uses advanced analytics to follow "smart wallets" . Its key features include:
- Smart Wallet Identification: Automatically highlights and tracks wallets with a consistent profit record.
- Position Analysis: Observes large-scale position changes across major tokens.
- Flow Tracking: Maps fund movements between exchanges and private wallets.
Market Sentiment Indicators
The platform also delivers detailed insights into market sentiment, helping traders spot potential reversals. It tracks factors like call option surges, token accumulation or distribution, and differences in trader behavior . These insights can assist traders in:
- Identifying bullish sentiment through increased call option activity.
- Observing token accumulation or distribution patterns.
- Analyzing divergences between trader categories for potential market shifts .
These tools work alongside the dashboard’s trade tracking features, offering a well-rounded view of market dynamics.
Professional Trading Tools
Designed for institutional and experienced traders, the dashboard includes features to ensure compliance and efficient trade monitoring. Automated systems track large trades and maintain accurate transaction records .
"The Large Trader Rule (Exchange Act Rule 13h-1) mandates broker-dealers to onboard, maintain, and report accurate information regarding Large Traders"
These tools provide the data traders need to make confident decisions, especially when leveraging large-scale trades.
5. NFT Market Data Dashboard
The NFT Market Data Dashboard on Dune offers detailed analytics for keeping up with the shifting NFT market. With the global NFT market forecasted to hit $61 billion by 2025 , this tool is a go-to resource for traders.
Market Overview Metrics
This dashboard compiles real-time data from leading NFT marketplaces, providing a clear view of key performance metrics:
| Metric | Current Value | Change (24h) |
|---|---|---|
| Global NFT Market Cap | $5,674,686,534 | +3.58% |
| Total Trading Volume | $5,563,851 | – |
| Active Collections | 1,659 | – |
| Daily Transactions | 25,598 | – |
Collection Performance Tracking
It also tracks individual collections, highlighting their market share. For example, CryptoPunks currently leads with 17% dominance, followed by Bored Ape Yacht Club at 7% . Traders can analyze a variety of collection-specific metrics:
| Metric Type | Data Points Tracked |
|---|---|
| Price Metrics | Floor Price, Average Sale Price, Highest Sale |
| Volume Metrics | Daily Volume, Weekly Volume, Monthly Volume |
| Trading Activity | Number of Sales, Unique Buyers, Unique Sellers |
| Market Dynamics | Price Floor Delta, Volume Trends |
In addition to collection-specific data, the dashboard provides insights into broader market trends.
Advanced Analytics Features
One standout feature is its ability to analyze trends. For instance, Kaito Genesis recorded $22.09M in sales and a 224.1% jump in trading volume during February 2025 .
"The days of just pure collectible NFTs…are certainly over" – Devin Finzer, co-founder and CEO of OpenSea
This aligns with the growing focus on utility-based NFTs, which now dominate the market. The dashboard tracks metrics across Ethereum, Bitcoin, Solana, and Polygon .
Market Trend Indicators
This tool simplifies complex data into actionable trends:
- Volume-Price Correlation: Shows how trading volume impacts price movements.
- Collection Rankings: Highlights top collections based on sales volume and trading activity.
- Floor Price Evolution: Tracks historical floor price changes to identify potential buying opportunities.
With the NFT user base expected to reach 11.6 million by 2025 , these features help traders make informed decisions and take advantage of the projected $84 billion market growth from 2025 to 2029 .
Conclusion
Dune Analytics has reshaped trading strategies in 2025. With its ability to process vast blockchain data in real-time using DuneSQL, it has become a go-to platform for market participants .
Current Impact on Trading
Orderly Network‘s dashboard highlights this influence, showcasing metrics like a cumulative trading volume nearing $3B and daily fee generation of around $10k . Its analytics provide traders with tools for spotting trends, tracking assets, understanding market participants, and customizing analysis across various blockchains:
| Feature | Benefit for Traders |
|---|---|
| Real-time Data Processing | Quick identification of market trends |
| Multi-chain Support | Asset tracking across different networks |
| Entity-based Intelligence | Insights into market participants |
| Customizable Filters | Tailored analysis by timeframe and blockchain |
These capabilities are just the beginning, as new advancements continue to redefine market analytics.
Innovation Trends
AI-driven analytics are making waves, with platforms like Arkham Intelligence turning intricate blockchain data into actionable insights . The focus is shifting from address-based data to entity-based insights, offering a deeper understanding of blockchain activity.
Future Outlook
Dashboards like Defx Market Data and Token Price Analysis are paving the way for further innovations. Upcoming trends include:
- Tools powered by text prompts, akin to ChatGPT, for easier data interpretation
- Advanced multi-chain features for broader market insights
- Decentralized platforms that enable sharing and monetization of crypto intelligence
OKX Web3‘s DEX dashboard is a great example of this progress, offering detailed transaction and trading volume insights while keeping interfaces user-friendly . These developments solidify the role of Dune dashboards in advancing decentralized trading strategies.