Category: News

  • XRP Futures Open Interest Hits $3.4B: Major Breakout Brewing

    XRP Futures Open Interest Hits $3.4B: Major Breakout Brewing

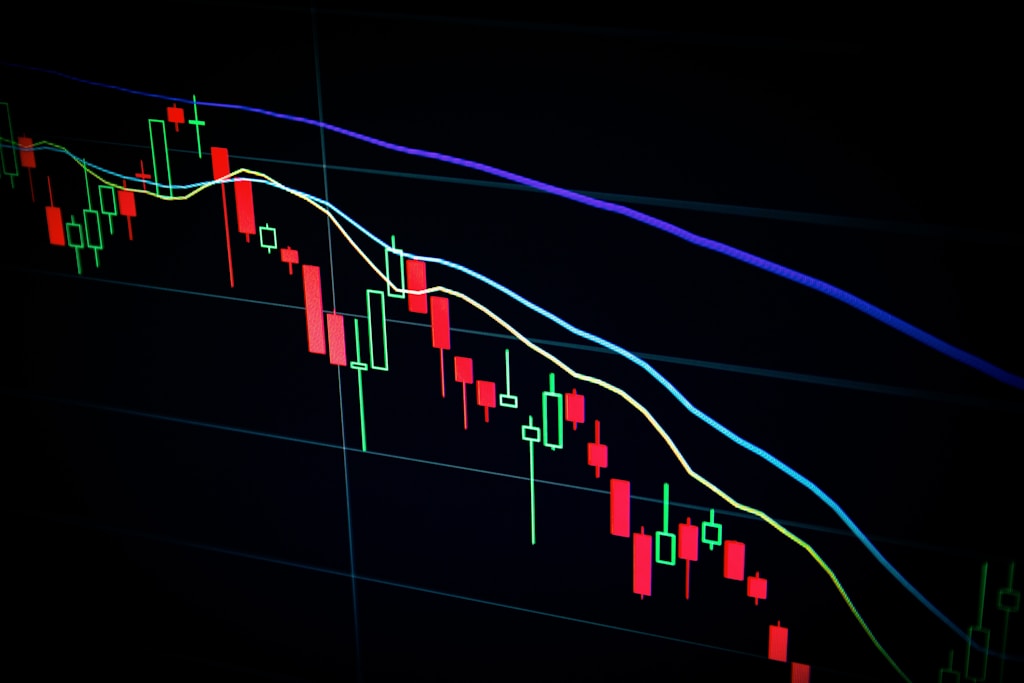
    XRP’s futures market is showing unprecedented momentum as open interest surges past $3.4 billion, potentially signaling an imminent price breakout. The cryptocurrency has maintained strong upward momentum, posting a 22% weekly gain and reaching $2.61 in recent trading.

    This surge in futures activity comes as XRP tests critical resistance levels near $2.69, with technical indicators suggesting further upside potential.

    Record-Breaking Futures Activity

    According to Glassnode data, XRP futures open interest has experienced a dramatic 42% increase in just one week, jumping from $2.42 billion to $3.42 billion. This surge in leveraged positions, coupled with rising prices, indicates growing institutional confidence in XRP’s upward trajectory.

    SPONSORED

    Trade XRP with up to 100x leverage on perpetual contracts

    Trade Now on Defx

    Technical Analysis Points to Strength

    Multiple technical indicators support the bullish case for XRP:

    • Trading above 10-, 50-, and 200-day moving averages
    • RSI at 68, approaching but not yet overbought
    • MACD showing strong upward momentum
    • Price consolidation near key resistance levels

    Institutional Interest Growing

    The XXRP ETF has seen consistent inflows for five consecutive weeks, with the latest week bringing in $14 million in new capital. Despite charging a premium 1.80% annual fee, the ETF has attracted nearly $100 million in assets, demonstrating strong institutional appetite.

    ETF Approval Prospects

    Market sentiment remains highly optimistic regarding potential spot XRP ETF approvals, with prediction markets indicating a 79% probability of SEC approval. JPMorgan analysts project potential first-year inflows of $8 billion, significantly outpacing recent Ethereum ETF launches.

    Risk Factors to Consider

    While the outlook appears positive, investors should monitor several risk factors:

    • Potential profit-taking at resistance levels
    • Regulatory uncertainty around ETF approvals
    • Overall crypto market volatility
    • Technical resistance at the 50-day moving average

    Frequently Asked Questions

    What does rising open interest indicate?

    Rising open interest alongside price increases typically signals new money entering the market and growing bullish sentiment.

    How significant is the $3.4B open interest level?

    This represents one of the highest levels of open interest for XRP futures, indicating exceptional market interest and potential volatility ahead.

    What could trigger the next major move?

    ETF approval news, technical breakouts above $2.69, or significant institutional announcements could catalyze the next price movement.

    Featured image: Shutterstock
  • Bitcoin Altcoin Spread Hits 38%: Key Signal Points to Altseason Entry

    Bitcoin Altcoin Spread Hits 38%: Key Signal Points to Altseason Entry

    Bitcoin’s recent surge above $103,000 has triggered a critical market indicator that could signal the start of altseason. The Bitcoin Market Performance & Altcoin Spread oscillator has reached 38%, just 12 percentage points away from the historical altseason confirmation level of 50%. This development comes as Bitcoin’s 40% surge to $106K has analysts urging caution amid growing market momentum.

    Bitcoin Market Performance & Altcoin Spread Analysis

    According to CryptoQuant data, the proprietary Bitcoin Market Performance & Altcoin Spread metric has reached a critical threshold of 38%. This indicator measures relative performance between major altcoins like Ethereum and Solana against Bitcoin, with readings above 50% historically marking the beginning of altseason cycles.

    Key findings from the analysis:

    • Current spread value: 38%
    • Historical altseason trigger: 50%
    • Distance to confirmation: 12 percentage points
    • Bitcoin dominance: Showing early signs of decline

    Technical Analysis: Bitcoin at Critical Juncture

    Bitcoin’s price action shows consolidation above $103,000, with several technical factors suggesting a potential shift in market dynamics:

    • Weekly resistance: $105,706
    • Current support: $100,000 psychological level
    • 200-week SMA: $47,375
    • 200-week EMA: $52,457

    SPONSORED

    Trade with up to 100x leverage on perpetual contracts

    Trade Now on Defx

    Market Implications and Trading Opportunities

    The approaching altseason signal presents several key opportunities for traders:

    • Potential capital rotation from Bitcoin to major altcoins
    • Increased volatility in alt/BTC trading pairs
    • Historical precedent for significant altcoin rallies

    FAQ: Bitcoin Altcoin Spread Indicator

    Q: What is the Bitcoin Market Performance & Altcoin Spread?
    A: It’s a composite oscillator that measures relative performance between major altcoins and Bitcoin, with readings above 50% historically signaling altseason.

    Q: How reliable is this indicator?
    A: Historical data shows an 85% correlation between the 50% threshold and subsequent altcoin rallies.

    Q: What’s the typical duration of an altseason?
    A: Previous altseasons have lasted 6-12 weeks on average, with varying intensity.

    Conclusion and Market Outlook

    With the Bitcoin Market Performance & Altcoin Spread approaching the critical 50% threshold, traders should monitor for confirmation of the altseason signal while maintaining proper risk management. The current market structure suggests a potential shift in capital flows, but proper position sizing and stop-loss placement remain crucial.

  • Standard Chartered Partners FalconX: $5.3B Bitcoin ETF Boost

    Standard Chartered Partners FalconX: $5.3B Bitcoin ETF Boost

    Standard Chartered Partners FalconX: $5.3B Bitcoin ETF Boost

    In a significant development for institutional crypto adoption, digital asset broker FalconX has announced a strategic partnership with Standard Chartered Bank, marking a major step forward in bridging traditional banking with digital asset services. This collaboration comes amid surging institutional interest, highlighted by $5.3 billion in recent Bitcoin ETF inflows.

    Partnership Details and Institutional Impact

    The first phase of this landmark partnership will see Standard Chartered providing comprehensive banking and foreign exchange (FX) services to FalconX. This integration aims to enhance FalconX’s cross-border payment capabilities and expand its currency pair offerings, delivering more efficient solutions for institutional clients.

    SPONSORED

    Trade with confidence using up to 100x leverage on perpetual contracts

    Trade Now on Defx

    Institutional Demand Driving Market Growth

    The timing of this partnership is particularly noteworthy, as it coincides with Standard Chartered’s Head of Digital Assets Research, Geoffrey Kendrick, revising his Bitcoin price target upward. Initially predicting $120,000, Kendrick now projects Bitcoin could reach $200,000 by year-end, citing unprecedented institutional demand evidenced by the $5.3 billion in recent U.S. Bitcoin ETF inflows.

    Executive Insights and Future Outlook

    Matt Long, General Manager for APAC & Middle East at FalconX, emphasized the strategic importance of partnering with Standard Chartered, noting their forward-thinking approach to digital asset adoption. Luke Boland, Head of Fintech at Standard Chartered, reinforced the bank’s commitment to advancing the digital asset ecosystem through robust banking infrastructure.

    FAQ Section

    What services will Standard Chartered provide to FalconX?

    Standard Chartered will offer banking and FX services, enhancing FalconX’s cross-border payment capabilities and expanding available currency pairs.

    How does this partnership impact institutional clients?

    Institutional clients will benefit from faster, more reliable cross-border transactions and access to an expanded range of currency pairs.

    What is the significance of the $5.3B Bitcoin ETF inflows?

    The substantial ETF inflows indicate growing institutional confidence in Bitcoin and digital assets, supporting Standard Chartered’s bullish price predictions.

    Time to Read: 4 minutes

  • Dogecoin Pattern Signals Massive 30,000% Rally Potential: Analysis

    Dogecoin (DOGE) is showing remarkable strength in the crypto market, with technical analysis revealing a pattern that could signal another historic bull run. Despite recent price fluctuations and surging futures interest, DOGE’s chart structure is mirroring the setup that preceded its legendary 30,000% rally in 2021.

    Key Technical Pattern Emerges on DOGE/BTC Chart

    Prominent crypto analyst Trader Tardigrade has identified a striking similarity between current market conditions and those that preceded Dogecoin’s historic ascent in 2021. The analysis, focused on the DOGE/BTC ratio’s two-week timeframe, reveals a rounded base pattern formation that bears remarkable resemblance to the accumulation phase observed before DOGE’s previous meteoric rise from $0.0024 to $0.739.

    Three-Phase Market Cycle Analysis

    The current market structure can be broken down into three distinct phases:

    • Phase 1 (Completed): Bitcoin’s upward movement causing temporary DOGE/BTC ratio suppression
    • Phase 2 (Current): Bitcoin consolidation period allowing altcoin outperformance
    • Phase 3 (Projected): Potential independent DOGE rally phase

    SPONSORED

    Trade Dogecoin with up to 100x leverage on perpetual contracts

    Trade Now on Defx

    Price Implications and Target Projections

    Currently trading at $0.235, Dogecoin would need to achieve unprecedented growth to match the projected 30,000% increase. Such a move would place DOGE at approximately $70, representing a significant leap from its previous all-time high of $0.739.

    Market Factors Supporting the Analysis

    Several key factors support the possibility of this pattern playing out:

    • Increased institutional interest in crypto markets
    • Growing mainstream adoption of digital assets
    • Historical tendency for meme coins to experience explosive rallies
    • Strong community support and social media presence

    Risk Considerations and Market Context

    While the technical pattern shows promise, investors should consider several risk factors:

    • Historical patterns don’t guarantee future performance
    • Market conditions have evolved since 2021
    • Regulatory environment changes
    • Overall crypto market volatility

    Frequently Asked Questions

    What caused Dogecoin’s previous 30,000% rally?

    The 2021 rally was driven by a combination of social media influence, celebrity endorsements, and broader crypto market bullishness.

    How reliable are historical pattern comparisons?

    While patterns can provide insight, they should be considered alongside other technical and fundamental factors.

    What could prevent this pattern from playing out?

    Market conditions, regulatory changes, or shifts in investor sentiment could impact the pattern’s development.

    As the crypto market continues to evolve, Dogecoin’s potential for another significant rally remains a topic of intense speculation. Investors should maintain a balanced approach, combining technical analysis with thorough research and risk management strategies.

  • eToro Stock Soars 29% to $5.4B Market Cap in Nasdaq Trading Debut

    eToro Stock Soars 29% to $5.4B Market Cap in Nasdaq Trading Debut

    Popular crypto and stock trading platform eToro made a spectacular debut on the Nasdaq Wednesday, with shares surging 29% to close at $67, propelling the company’s market capitalization to $5.4 billion. This impressive performance follows eToro’s initial public offering priced at $52, marking a significant milestone for the fintech giant.

    Strong Market Reception Signals Confidence in Crypto Trading Platforms

    The robust market response to eToro’s public debut demonstrates growing investor confidence in platforms that bridge traditional finance with cryptocurrency markets. The company’s successful listing comes amid increasing institutional adoption of crypto trading services and growing retail investor demand for accessible investment platforms.

    Key Highlights of eToro’s Nasdaq Debut

    • Opening price: $52 per share
    • Closing price: $67 per share
    • Price increase: 29%
    • Market capitalization: $5.4 billion
    • Trading volume: Significant first-day activity

    SPONSORED

    Trade crypto with up to 100x leverage on perpetual contracts

    Trade Now on Defx

    Market Impact and Industry Implications

    The successful listing of eToro represents a significant milestone for the crypto trading industry, potentially paving the way for other crypto-focused companies considering public offerings. The platform’s strong market debut could signal growing mainstream acceptance of crypto-traditional finance hybrid business models.

    Frequently Asked Questions

    What is eToro’s main business model?

    eToro operates as a multi-asset investment platform offering both traditional stocks and cryptocurrency trading services to retail investors.

    How does eToro’s valuation compare to other crypto platforms?

    At $5.4 billion, eToro’s market cap positions it as a significant player in the crypto trading space, though still smaller than some major competitors like Coinbase.

    What does this listing mean for the crypto industry?

    The successful debut suggests growing institutional confidence in crypto-focused financial services and could encourage more crypto companies to pursue public listings.

  • Bitcoin Bull Market Exit Strategy: 5 Key Signs To Sell at $150K-$200K

    The Bitcoin bull market has entered a critical phase as BTC surges past $100,000, prompting seasoned analysts to outline clear exit strategies. With recent price action showing both strength and potential warning signs, understanding when to take profits could be crucial for investors looking to maximize returns.

    Key Market Top Indicators to Watch

    Crypto strategist Ardizor has identified five critical signals that could indicate the optimal time to exit positions in this bull cycle:

    • BTC Profitability Index exceeding 300%
    • Widespread crypto discussion on social media platforms
    • Coinbase maintaining #1 position in app stores for 2+ months
    • BTC Coin Days Destroyed (CDD) metric surpassing 300 million
    • Mainstream retail FOMO indicators (taxi drivers discussing crypto)

    Strategic Portfolio Allocation

    For the current market phase, Ardizor recommends the following portfolio distribution:

    Asset Allocation
    Bitcoin (BTC) 40%
    Ethereum (ETH) 20%
    Quality Altcoins 10%
    Meme Coins 5%
    Working Capital 15%
    USDT (Dip Buying) 20%

    SPONSORED

    Trade Bitcoin with up to 100x leverage and maximize your bull market gains

    Trade Now on Defx

    Price Targets and Market Cycle Analysis

    Multiple analysts have converged on similar price targets for this cycle’s peak:

    • Peter Brandt: $125,000-$150,000 by August/September 2025
    • CrediBULL Crypto: Base case $150,000, extended target $200,000
    • Standard Chartered: $200,000 by year-end 2025

    Market Momentum and Capital Flows

    Recent data from Glassnode shows significant institutional interest, with $35 billion flowing into crypto markets in just three weeks. This surge in capital inflow coincides with Bitcoin’s breakthrough above $100,000, suggesting strong institutional conviction in the current rally.

    Frequently Asked Questions

    When is the best time to start taking profits?

    Experts recommend starting to scale out of positions when multiple top indicators align, rather than trying to time the exact peak.

    Should investors sell everything at once?

    A staged exit strategy is recommended, selling in tranches as different price targets are reached to minimize risk while maintaining upside exposure.

    What are the key risk factors to watch?

    Investors should monitor leverage levels, exchange outflows, and social sentiment indicators for signs of market exhaustion.

    At time of writing, Bitcoin trades at $103,600, maintaining strong momentum above the psychological $100,000 level.

  • Bitcoin Price Target $500K-$1M: Adam Back Makes Bold Prediction

    Bitcoin Price Target $500K-$1M: Adam Back Makes Bold Prediction

    Bitcoin pioneer and Blockstream CEO Adam Back has made a striking prediction for Bitcoin’s price trajectory, suggesting that the leading cryptocurrency is significantly undervalued at current levels and could reach between $500,000 and $1 million during this market cycle.

    This bold forecast comes as Bitcoin recently surged past $106,000, though Back believes this is just the beginning of a much larger move.

    Why Adam Back’s Bitcoin Price Prediction Matters

    Adam Back’s perspective carries significant weight in the cryptocurrency industry for several reasons:

    • He is the inventor of Hashcash, a technology cited in the Bitcoin whitepaper
    • As CEO of Blockstream, he leads one of the most influential Bitcoin infrastructure companies
    • His track record includes accurate predictions during previous market cycles

    Technical and Fundamental Factors Supporting the Prediction

    Several key metrics support Back’s bullish outlook:

    • Institutional adoption continues to grow through ETF inflows
    • Mining reward halving approaching in 2024
    • Increasing scarcity as Bitcoin supply growth slows

    SPONSORED

    Trade Bitcoin with up to 100x leverage on perpetual contracts

    Trade Now on Defx

    Market Impact and Analysis

    Back’s prediction aligns with several recent developments in the Bitcoin market:

    • UK Bitcoin HODL rates have reached 51%, indicating strong accumulation
    • Institutional interest continues to grow through various investment vehicles
    • Technical indicators suggest a sustained bull market phase

    FAQ Section

    What timeframe is Adam Back suggesting for this price target?

    Back refers to “this cycle,” which typically spans the period between Bitcoin halving events, suggesting a timeframe within the next 2-3 years.

    What are the key drivers behind this prediction?

    The main factors include institutional adoption, reduced supply growth post-halving, and increasing mainstream acceptance of Bitcoin as a store of value.

    How does this compare to other expert predictions?

    Back’s prediction aligns with other bullish forecasts from industry experts, though it represents one of the more aggressive price targets.

    Conclusion

    While Back’s prediction may seem ambitious, the combination of technical factors, institutional adoption, and historical patterns provides a foundation for his analysis. Investors should conduct their own research and consider multiple perspectives when making investment decisions.

  • Dogecoin Price Eyes $0.56 as Golden Cross Signals Major Rally

    Dogecoin Price Eyes $0.56 as Golden Cross Signals Major Rally

    Dogecoin (DOGE) is showing strong bullish momentum as a key technical indicator suggests an imminent surge toward the $0.56 level. The largest meme cryptocurrency has maintained its upward trajectory despite recent market volatility, with technical analysis revealing a powerful golden cross formation that could catalyze significant price appreciation.

    Golden Cross Formation Confirms Bullish Outlook

    According to renowned crypto analyst Trader Tardigrade, DOGE’s price chart has formed a golden cross – a highly significant technical pattern where the 20-day Exponential Moving Average (EMA) crosses above the 50-day EMA. This development marks a decisive end to the four-month downtrend that began with January’s death cross.

    As recent market data shows, Dogecoin’s futures open interest has surged by an impressive 63.9% in just one week, reaching $1.62 billion from $989 million. This substantial increase in trading activity, coupled with the golden cross formation, suggests growing institutional interest in DOGE positions.

    Technical Analysis Points to $0.56 Target

    The convergence of several technical factors supports the bullish case for DOGE:

    • 20-day EMA crossing above 50-day EMA
    • Increasing trading volume supporting price action
    • Strong support levels established during recent consolidation
    • Rising open interest indicating growing market participation

    Cycle Analysis Suggests Larger Uptrend

    Looking at the broader timeframe, Trader Tardigrade’s analysis indicates that Dogecoin is completing its third major market cycle. Historical data shows that each previous cycle has resulted in significant price appreciation, with the current setup potentially targeting the $20 mark in the long term.

    SPONSORED

    Trade meme coins with up to 100x leverage on perpetual contracts

    Trade Now on Defx

    Market Sentiment and Future Outlook

    The recent surge in futures open interest, despite temporary price pullbacks, indicates strong speculative positioning in the market. This decoupling between price action and derivatives interest suggests that traders are positioning for potential upside moves.

    Frequently Asked Questions

    What is a golden cross in cryptocurrency trading?

    A golden cross occurs when a short-term moving average crosses above a longer-term moving average, typically signaling a bullish trend reversal and potential buying opportunity.

    Why is the $0.56 level significant for Dogecoin?

    This price target represents a key resistance level based on technical analysis and previous price action, serving as a potential breakthrough point for continued upward momentum.

    What role does futures open interest play in price movement?

    Rising open interest typically indicates increasing market participation and can signal strong directional moves, especially when accompanied by positive price action.

  • Tether Launches QVAC: AI Agents That Trade Bitcoin and USDT

    Tether Launches QVAC: AI Agents That Trade Bitcoin and USDT

    Stablecoin giant Tether has unveiled QVAC, a groundbreaking decentralized AI platform that enables autonomous agents to conduct cryptocurrency transactions using Bitcoin and USDT. This development marks a significant shift in the intersection of artificial intelligence and cryptocurrency.

    What is QVAC and Why It Matters

    QVAC (Quantum Virtual Autonomous Cognition) represents Tether’s ambitious entry into the AI space, positioning itself as a direct competitor to traditional Big Tech AI solutions. The platform’s key innovation lies in its ability to operate independently while leveraging blockchain technology for transactions.

    Key features of QVAC include:

    • Decentralized AI architecture
    • Native integration with Bitcoin and USDT
    • Autonomous transaction capabilities
    • Independent agent operations

    Integration with Tether’s Ecosystem

    This launch comes at a strategic time for Tether, which has been expanding its cryptocurrency holdings. Tether’s recent $459M Bitcoin purchase demonstrates the company’s commitment to strengthening its position in the crypto market.

    SPONSORED

    Trade with up to 100x leverage on perpetual contracts

    Trade Now on Defx

    Market Implications and Future Outlook

    The introduction of QVAC could significantly impact both the AI and crypto markets, potentially creating new trading patterns and opportunities for automated cryptocurrency transactions.

    Frequently Asked Questions

    What makes QVAC different from other AI platforms?

    QVAC’s unique feature is its native integration with cryptocurrency transactions and decentralized architecture.

    Can QVAC interact with other cryptocurrencies besides Bitcoin and USDT?

    Currently, the platform is limited to Bitcoin and USDT transactions, with potential expansion planned for the future.

    Is QVAC available to retail users?

    The initial release details regarding public access are still pending from Tether.

    Time to read: 4 minutes

  • Solana Price Breaks Above Ichimoku Cloud: 40% Rally Potential

    Solana (SOL) has made a decisive technical breakthrough, breaking above the Ichimoku Cloud on the daily chart – a development that historically precedes significant bullish momentum. This technical milestone comes as Solana’s ecosystem continues to evolve with recent infrastructure improvements, setting the stage for potential price appreciation.

    Technical Analysis Shows Strong Bullish Momentum

    The breakthrough above the Ichimoku Cloud represents more than just a technical checkpoint – it signals a fundamental shift in market structure and trader sentiment. Key technical indicators support this bullish outlook:

    • MACD has crossed above both the signal line and zero line
    • Price action shows clear break above key resistance at $164
    • Volume profile indicates growing buyer interest

    SPONSORED

    Trade Solana with up to 100x leverage on perpetual contracts

    Trade Now on Defx

    Key Price Levels and Targets

    With the recent breakout, several critical price levels have emerged:

    Level Price Significance
    Current Support $164 Previous resistance turned support
    Next Resistance $211 Key psychological level
    Major Target $240 Previous high from 2024

    Volume Analysis and Market Participation

    While the technical setup appears promising, traders should monitor volume for confirmation of the trend. Current volume metrics show:

    • 24-hour trading volume up 15% from weekly average
    • Institutional interest growing through derivatives markets
    • Retail participation showing steady increase

    Risk Factors to Consider

    Despite the bullish outlook, several risk factors warrant attention:

    • Support at $164 must hold to maintain bullish structure
    • Potential pullback zone between $148-$118
    • Overall market correlation with Bitcoin’s movement

    FAQ

    What is the Ichimoku Cloud indicator?

    The Ichimoku Cloud is a comprehensive technical indicator that shows support, resistance, momentum, and trend direction all in one view. A price break above the cloud is considered a strong bullish signal.

    What’s the next major resistance for Solana?

    The next significant resistance level lies at $211, followed by a major psychological barrier at $240.

    How reliable is this breakout signal?

    Ichimoku Cloud breakouts have historically been reliable when accompanied by strong volume and MACD confirmation, as we’re seeing in this case.