Ethereum’s $11.5K Target: Oversold Signal Shocks Bulls!
Ethereum enters crucial oversold zone as analysts predict potential rally to $11,500. Technical indicators suggest bottom formation amid bearish pressure bel…
Market Analysis Reveals Ethereum’s Potential Breakout
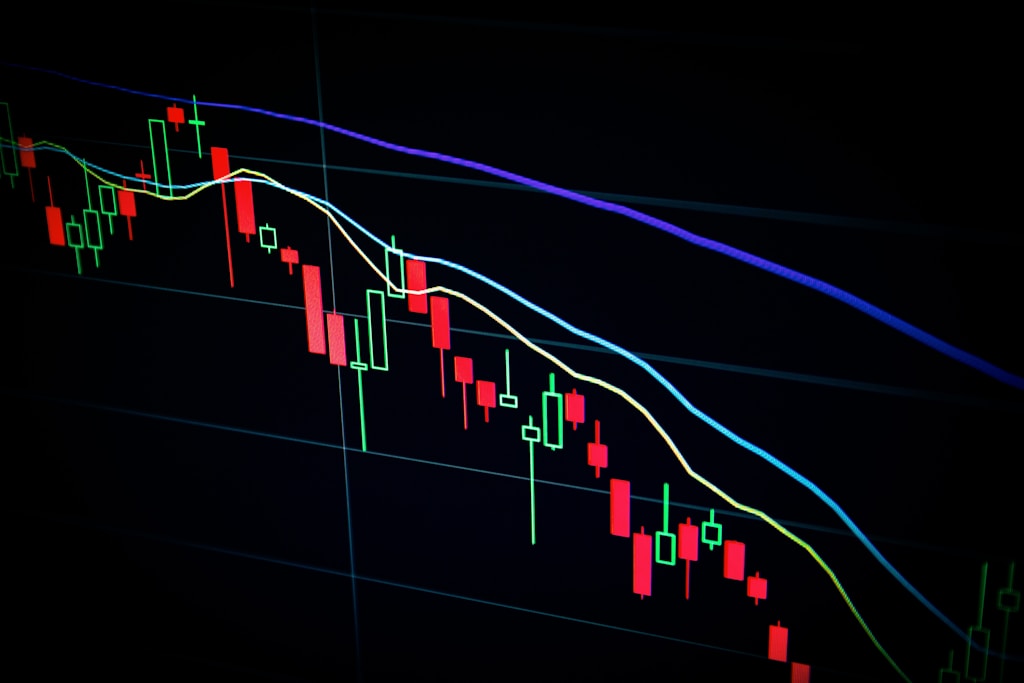
Ethereum (ETH) has entered a critical phase as the second-largest cryptocurrency tests significant support levels amid mounting bearish pressure. Trading below $2,000, ETH’s recent price action has caught the attention of seasoned analysts who see a potential major reversal on the horizon.
In a significant development that aligns with previous bullish predictions for Ethereum, technical indicators suggest an imminent trend reversal that could propel ETH to new heights.
Key Technical Indicators Signal Bottom Formation
According to renowned market expert Trader Tardigrade, Ethereum has entered a crucial oversold zone on the Stochastic indicator – a development not seen in the last three years. This technical formation historically precedes significant price rallies, with similar patterns observed in 2019 and 2022.
- Current Price: $1,892
- Key Support Level: $1,440
- Resistance Level: $2,060
- 24h Volume Change: -37%
Historical Pattern Analysis
The current market structure bears striking similarities to previous bottom formations that led to substantial rallies. Trader Tardigrade’s analysis suggests a potential surge toward $11,500, representing a significant upside from current levels.
Critical Support Levels to Watch
Crypto analyst Ali Martinez highlights the importance of the MVRV Extreme Deviation Pricing Bands, indicating that ETH is testing crucial support levels. The realized price of $2,060 serves as a pivotal point, with $1,440 representing the next major support level if current levels fail to hold.
Market Implications and Future Outlook
The convergence of technical indicators, historical patterns, and market structure suggests that Ethereum could be preparing for a significant move. However, investors should remain cautious of immediate bearish pressure, as evidenced by the declining trading volume and loss of key support levels.
Source: Bitcoinist


