


Bitcoin Bretton Woods: Cardano Founder Calls for BTC-Based Monetary System
In a groundbreaking proposal that could reshape the future of digital finance, Cardano founder Charles Hoskinson has called for a...
 AI Crypto Scams Surge: $4.6B Lost in 2024, Bitget Report Reveals
 Ethereum Price Targets $3,500 as Technical Indicators Signal 38% Rally
Bitcoin Hyper L2 Presale Surges Past $1M After Major Whale Investment
Ethereum Price Targets $3,500 as Technical Indicators Signal 38% Rally
Bitcoin Hyper L2 Presale Surges Past $1M After Major Whale Investment
 Franklin Templeton Launches Blockchain Intraday Yield System: DeFi Innovation
 Bitcoin ETF Milestone: BlackRock IBIT Hits $70B in Record-Breaking Surge
In a groundbreaking proposal that could reshape the future of digital finance, Cardano founder Charles Hoskinson has called for a...

Ethereum (ETH) has demonstrated remarkable strength in the cryptocurrency market, pushing above the critical $2,550 level while Bitcoin faces potential...

Dogecoin (DOGE) has entered a critical phase as the leading meme cryptocurrency faces mounting bearish pressure, dropping over 12% in...

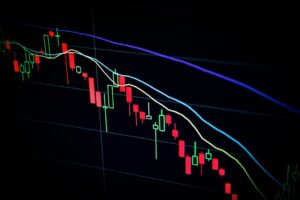
Bitcoin's price trajectory has taken a bearish turn, with BTC dropping below the critical $105,000 level as market uncertainty grows....

Bitcoin's underlying strength continues to build as long-term holder (LTH) confidence reaches new heights, with the LTH Net Position Realized...
JPMorgan Chase CEO Jamie Dimon has issued a stark warning about the potential decline of the U.S. dollar's global reserve...

Circle, the company behind the USDC stablecoin, has successfully raised $1.1 billion in its initial public offering (IPO), achieving a...
In a significant development for cryptocurrency adoption, Tesla CEO Elon Musk has endorsed Coinbase's warning about Bitcoin potentially replacing the...
The controversial WAP (Wet A*s P*ssy) token experienced a dramatic 90% price crash following a promotional tweet from rapper Cardi...

Bitcoin's on-chain metrics are painting a bullish picture despite recent price consolidation around $105,000, with the Realized Cap Impulse metric...