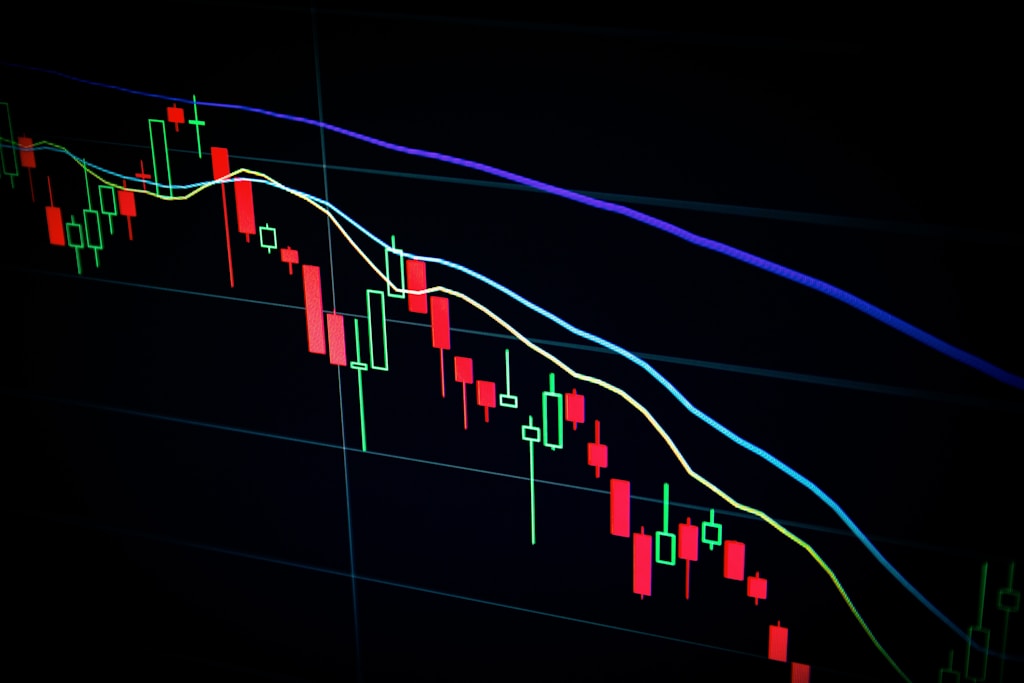
PEPE Price Faces 20% Drop After Breaking Key Support Level
PEPE price shows bearish signals after breaking key support, with technical analysis suggesting a potential 20% decline. Multiple indicators align for downsi…

The popular meme cryptocurrency PEPE is showing signs of significant bearish pressure after breaking below a crucial technical pattern. Technical analysis suggests the token could experience a sharp 20% decline from current levels, with multiple indicators aligning to support this bearish outlook.
Technical Analysis Points to Further Downside
According to renowned crypto analyst ‘MyCryptoParadise’, PEPE’s price action has taken a decisive bearish turn after breaking down from an Ascending Triangle pattern. The breakdown was accompanied by a negative Change of Character (CHoCH), signaling that buyers have lost control of the market momentum.
This bearish development comes amid broader volatility in the meme coin sector, as recent market turbulence has particularly impacted meme tokens.
Critical Price Levels to Watch
The analysis identifies several key price levels that traders should monitor:
- Current resistance: $0.000008
- First support level: $0.0000065
- Critical support zone: $0.0000055
Multiple Bearish Indicators Align
The bearish case is strengthened by the convergence of several technical factors:
- 200 EMA acting as dynamic resistance
- Fair Value Gap (FVG) suggesting potential price fills
- Fibonacci Golden Zone intersection
- Breakdown from Ascending Triangle pattern
Potential Bullish Scenario
Despite the bearish outlook, there remains a possibility for price recovery. A decisive close above $0.000008 could invalidate the bearish thesis and potentially trigger a rally toward $0.0000085. However, this scenario would require significant buying volume and momentum, which appears unlikely in the current market conditions.
FAQ Section
What is causing PEPE’s price decline?
The decline is primarily technical, triggered by a breakdown from an Ascending Triangle pattern and confirmed by multiple bearish indicators including the 200 EMA resistance.
How low could PEPE price go?
Technical analysis suggests a potential 20% decline, with key support levels at $0.0000065 and $0.0000055.
What could trigger a price recovery?
A sustained close above $0.000008 with strong volume could trigger a bullish reversal, though this appears unlikely in current market conditions.


