Solana Price Analysis: SOL Tests $122 Support as Bulls Eye $132 Breakout
Solana (SOL) tests critical $122 support while bulls eye $132 resistance. Technical analysis reveals key levels and potential breakout scenarios for April tr…
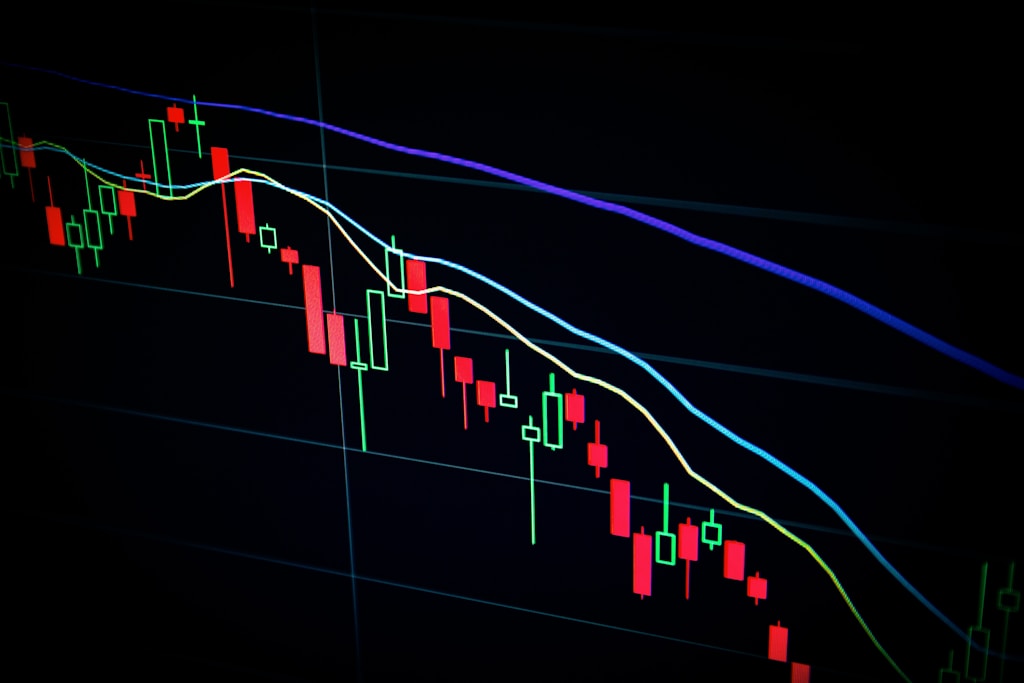
Solana (SOL) is showing mixed signals as the cryptocurrency tests critical support levels following a recent decline. Similar to Bitcoin’s recent price action at $83K, SOL traders are closely watching key technical levels that could determine the next major move.
Key Solana Price Levels to Watch
The latest technical analysis reveals several critical price points for SOL:
- Current support: $122-124 range
- Key resistance: $126, $128, and $132
- Previous swing high: $140
- Risk level: $115-102 zone
Technical Analysis Deep Dive
SOL’s price action shows a complex technical setup with multiple factors at play:
- Formation of a rising channel with $124 support
- Trading below the 100-hourly SMA
- 23.6% Fibonacci retracement test from $140 high to $122 low
- RSI holding above 50, suggesting maintained bullish momentum
Bullish Scenario
For SOL to initiate a recovery:
- Must break above $126 immediate resistance
- Clear $132 for confirmed trend reversal
- Potential targets: $136 and $142
Bearish Scenario
Downside risks include:
- Break below $122 support could trigger selloff
- Next major support at $115
- Worst case scenario points to $102
Expert Analysis
Technical indicators suggest a cautious outlook:
- MACD showing bearish momentum
- RSI above 50 provides some optimism
- Volume profile indicates consolidation phase
FAQ
What is the next major resistance for Solana?
The next significant resistance level is at $132, followed by $136.
Could SOL drop below $100?
While possible, it would require breaking multiple support levels, with $102 being a crucial bottom.
What technical indicators are most relevant for SOL right now?
The MACD and RSI are key indicators, with the rising channel formation providing important support/resistance levels.


