Tag: Ada Price Analysis

  • Cardano (ADA) Price Plunges Below $0.70: Key Support at Risk

    Cardano (ADA) Price Plunges Below $0.70: Key Support at Risk

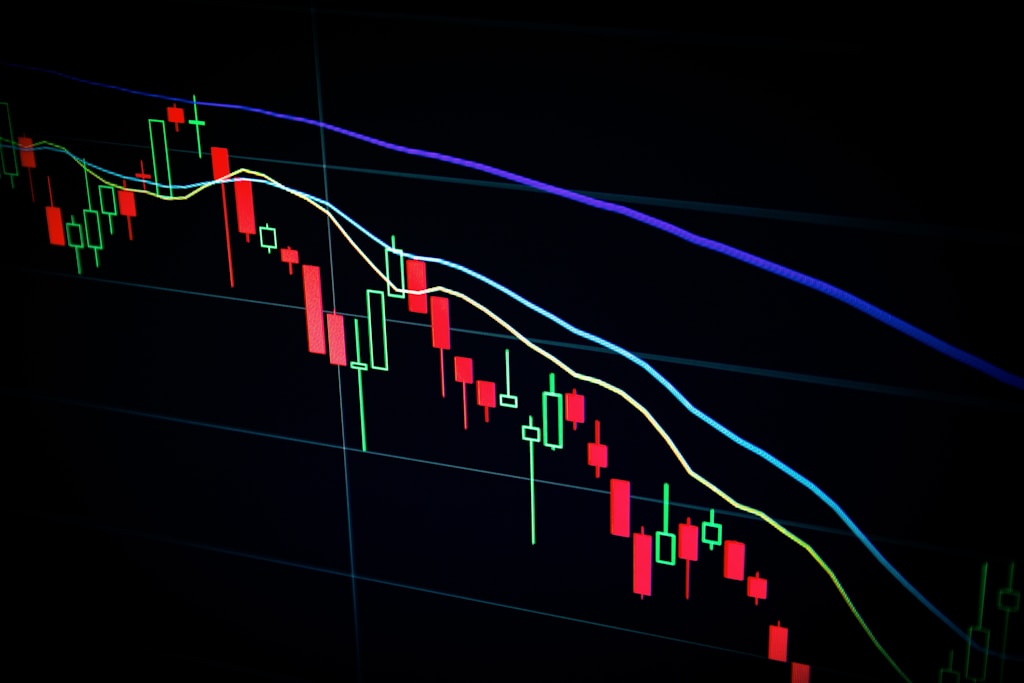
    Cardano (ADA) continues its bearish trend as the price breaks below critical support levels, raising concerns among investors about further downside potential. The recent price action suggests mounting selling pressure that could test lower support zones in the coming days.

    Key Highlights of ADA’s Price Movement

    • ADA price dropped below crucial $0.720 and $0.700 support levels
    • Trading activity remains below the 100-hourly simple moving average
    • Critical bullish trend line support at $0.6840 has been breached
    • Next major support zone established at $0.650

    This bearish movement comes amid broader market uncertainty, with recent governance challenges facing the Cardano ecosystem potentially contributing to negative sentiment.

    Technical Analysis Deep Dive

    The hourly chart reveals several concerning technical developments:

    • Price consolidation below $0.70 psychological level
    • RSI indicating oversold conditions below 50
    • MACD showing increasing bearish momentum
    • Key Fibonacci retracement levels suggesting resistance at $0.6825

    SPONSORED

    Trade ADA with up to 100x leverage on perpetual contracts

    Trade Now on Defx

    Support and Resistance Levels

    Critical price levels to watch:

    • Major Resistance: $0.6920, $0.7000, $0.7350
    • Key Support: $0.6625, $0.6500, $0.6200

    Market Outlook and Trading Implications

    The immediate outlook remains bearish unless ADA can reclaim the $0.6825 resistance level. Traders should watch for:

    • Potential breakdown below $0.650 support
    • Volume patterns at key support levels
    • RSI divergence signals for potential reversal

    FAQ

    Q: What’s causing Cardano’s price decline?
    A: Multiple factors including technical breakdown, broader market sentiment, and recent governance issues are contributing to the bearish pressure.

    Q: Where is the next major support level?
    A: The $0.650 level represents crucial support, followed by $0.620.

    Q: What would signal a potential reversal?
    A: A daily close above $0.6920 with increasing volume could indicate a trend reversal.

  • Cardano (ADA) Price Tests $0.78 Resistance: Key Levels for Recovery

    Cardano (ADA) is showing signs of potential recovery after a recent decline, with critical price levels emerging that could determine its next major move. The cryptocurrency has established support above $0.75 while eyeing resistance at $0.78, setting up an intriguing technical scenario for traders.

    Key Cardano Price Levels to Watch

    After dropping below the psychological $0.80 mark, ADA has found itself in a consolidation phase with several important technical levels in play:

    • Current Support: $0.750 with 100-hourly SMA providing additional backing
    • Primary Resistance: $0.7840 (50% Fibonacci retracement level)
    • Secondary Resistance: $0.80 (psychological barrier)
    • Critical Support: $0.740 (breach could trigger further decline)

    SPONSORED

    Trade ADA with up to 100x leverage on perpetual contracts

    Trade Now on Defx

    Technical Analysis Breakdown

    The technical indicators are showing mixed signals with a slight bullish bias:

    • MACD: Gaining momentum in the bullish zone
    • RSI: Currently above 50, indicating moderate buying pressure
    • Trend Line: Bullish breakout above resistance at $0.750
    • Fibonacci Levels: Price attempting to reclaim 23.6% retracement

    Recovery Scenarios and Price Targets

    Two primary scenarios are emerging for Cardano’s short-term price action:

    Bullish Case

    • Break above $0.80 could trigger rally toward $0.820
    • Extended momentum could push price to $0.8350
    • Key catalyst: Break above 50% Fibonacci retracement

    Bearish Case

    • Failure to breach $0.7680 could trigger retest of $0.740
    • Break below $0.740 opens path to $0.7260
    • Ultimate support zone: $0.70 level

    FAQ

    Q: What’s the key resistance level for Cardano right now?
    A: The critical resistance level is at $0.7840, representing the 50% Fibonacci retracement level.

    Q: Where is the strongest support for ADA?
    A: The strongest support lies at $0.750, reinforced by the 100-hourly simple moving average.

    Q: What technical indicators support a potential recovery?
    A: The MACD showing bullish momentum and RSI above 50 suggest potential for upward movement.

    Conclusion

    Cardano’s price action suggests a critical juncture, with the potential for recovery above $0.78 if current support levels hold. Traders should watch the key resistance at $0.7840 for confirmation of the next major move, while maintaining awareness of the support at $0.750 to manage risk effectively.

  • Cardano Price Alert: Elliott Wave Points to 50% ADA Crash Before $1.6 Rally

    Cardano Price Alert: Elliott Wave Points to 50% ADA Crash Before $1.6 Rally

    Cardano (ADA) traders are facing a critical juncture as Elliott Wave analysis suggests an imminent 50% price correction before a potential rally to new highs. Despite maintaining steady upward momentum in recent weeks, technical indicators are now flashing warning signs for ADA holders.

    Elliott Wave Analysis Predicts Major ADA Correction

    According to detailed Elliott Wave analysis on TradingView, Cardano is completing a B-wave correction pattern that formed between April and June 2025. While the recent price action may appear bullish on shorter timeframes, the completion of this corrective phase could trigger a sharp decline to the $0.42 support level.

    This bearish scenario aligns with broader market dynamics affecting major cryptocurrencies, though Bitcoin’s current strength near $109K could potentially moderate ADA’s correction.

    SPONSORED

    Trade ADA with up to 100x leverage on perpetual contracts

    Trade Now on Defx

    Key Technical Levels to Watch

    The projected decline targets the 0.786 Fibonacci retracement level at $0.42, representing a 50% drop from current prices. However, this correction could set up a powerful Wave 5 impulse move targeting $1.60. Critical support levels include:

    • Primary support: $0.42 (0.786 Fibonacci level)
    • Secondary support: $0.40 (Wave 1 top – invalidation level)
    • Current resistance: $0.84 (recent rejection point)

    Strategic Opportunities Amid Bearish Forecast

    While the short-term outlook appears bearish, this correction could present a strategic accumulation opportunity. The projected Wave 5 rally to $1.60 would represent over 280% returns from the forecasted bottom at $0.42.

    Market Impact and Risk Factors

    Several factors could influence this technical forecast:

    • Bitcoin’s price action near key resistance levels
    • Overall market sentiment and volatility
    • Institutional investment flows
    • Cardano network development progress

    FAQ Section

    When could the ADA price correction begin?

    According to the Elliott Wave analysis, the correction could initiate once the current B-wave structure completes, likely within the next few weeks.

    What invalidates this bearish scenario?

    A sustained break above $0.84 or a drop below $0.40 would invalidate the current Elliott Wave count.

    Is this a good time to accumulate ADA?

    Strategic investors might consider preparing for potential accumulation near the $0.42-$0.40 support zone, though proper risk management is essential.

    At press time, ADA trades at $0.7706, showing minimal change (-0.2%) over the past 24 hours as traders await clearer directional signals.

  • Cardano (ADA) Surges: 25% Open Interest Jump Signals $1 Breakout

    As Bitcoin reaches new all-time highs, Cardano (ADA) is showing remarkable strength with a significant surge in trading activity. The cryptocurrency has witnessed a dramatic 25% increase in open interest over the past 24 hours, suggesting a potential breakout above the crucial $1 mark.

    Cardano’s Market Momentum: Key Metrics Analysis

    The latest data from Coinglass reveals compelling market dynamics for Cardano:

    • Open interest jumped from $902.27M to $958.05M
    • 25% increase in just 24 hours
    • Significant recovery from May’s low of $715.01M

    SPONSORED

    Trade ADA with up to 100x leverage on perpetual contracts

    Trade Now on Defx

    Technical Analysis: Breaking the Falling Wedge

    The technical outlook for Cardano has turned increasingly bullish, with several key indicators suggesting upward momentum:

    • Breakout from falling wedge pattern confirmed
    • First target: $0.9508
    • Secondary targets: $1.0295 and $1.1316
    • Current long/short ratio: 49.71% long vs 50.29% short

    Market Sentiment and Trading Activity

    The surge in open interest indicates growing trader confidence in Cardano’s potential. This increased activity comes as the broader crypto market shows strength, with Bitcoin’s recent performance leading the way. The nearly equal distribution between long and short positions suggests a critical battle point that could determine ADA’s next major move.

    Price Targets and Resistance Levels

    Based on technical analysis and current market structure, key levels to watch include:

    • Immediate resistance: $0.9508
    • Major psychological barrier: $1.00
    • Extended target: $1.1316

    FAQ Section

    What is driving Cardano’s current price movement?

    The combination of increased open interest, technical breakout, and overall crypto market strength are the main catalysts for ADA’s current momentum.

    What are the key resistance levels for ADA?

    The primary resistance levels are $0.9508, $1.00, and $1.1316, with the $1 mark being the most psychologically significant.

    Is now a good time to trade ADA?

    While market indicators show bullish signals, traders should always conduct their own research and manage risk appropriately.

  • Cardano (ADA) Price Eyes $0.80 Breakout: Key Resistance Levels Ahead

    Cardano (ADA) Price Eyes $0.80 Breakout: Key Resistance Levels Ahead

    Cardano (ADA) Price Eyes $0.80 Breakout: Key Resistance Levels Ahead

    Cardano (ADA) is showing renewed momentum as the cryptocurrency attempts to break through critical resistance levels. The digital asset has initiated a fresh upward movement above $0.7250, setting the stage for a potential rally toward the psychologically important $0.80 mark. While ADA has underperformed compared to Bitcoin’s recent surge toward $110K, technical indicators suggest a possible breakout is forming.

    Current Market Position and Technical Analysis

    ADA’s price action reveals several key technical developments:

    • Successfully cleared resistance at $0.7250 and $0.7320
    • Trading above the 100-hourly simple moving average and $0.740 support
    • Facing a bearish trend line resistance at $0.7580
    • 50% Fibonacci retracement level cleared from $0.7762 high to $0.7110 low

    SPONSORED

    Trade ADA with up to 100x leverage on perpetual contracts

    Trade Now on Defx

    Critical Resistance Levels to Watch

    For Cardano to achieve its potential breakout, several key resistance levels must be overcome:

    Resistance Level Price Point Significance
    Initial Resistance $0.7580 Bearish trend line
    Key Breakout Level $0.7720 Previous swing high
    Major Target $0.8000 Psychological resistance
    Extended Target $0.8250 Next major resistance

    Support Zones and Downside Risks

    Should the bullish momentum fail to materialize, several support levels could come into play:

    • Immediate support: $0.7420
    • Critical support: $0.7260
    • Major support: $0.710
    • Bull zone: $0.680

    Technical Indicators and Market Sentiment

    Current technical indicators paint a cautiously optimistic picture:

    • MACD: Showing increasing bullish momentum
    • RSI: Trading above 50, indicating positive momentum
    • Moving Averages: Price above 100-hourly SMA, suggesting short-term strength

    Frequently Asked Questions

    What is the next major target for Cardano?

    The immediate major target is the $0.80 psychological level, with potential extension to $0.8250.

    What could prevent ADA from reaching $0.80?

    The key bearish trend line at $0.7580 and resistance at $0.7720 must be cleared first.

    Where is the safest support level for ADA?

    The $0.7260 level represents a strong support zone with multiple technical confirmations.

    Traders should maintain careful position sizing and implement proper risk management strategies as the market continues to develop.

  • Cardano Price Alert: ADA Eyes $0.92 After Potential $0.75 Correction

    Cardano Price Alert: ADA Eyes $0.92 After Potential $0.75 Correction

    Cardano (ADA) is showing mixed signals in its latest market structure, with technical analysis pointing to both an imminent correction and subsequent bullish potential. While short-term indicators suggest a pullback to the $0.75 support zone, broader patterns indicate a possible rally toward $0.92.

    Technical Analysis Points to Short-Term Correction

    Prominent TradingView analyst SiDec has identified a complex technical setup for ADA, currently trading at $0.78. The analysis, based on Elliott Wave Theory and multiple technical indicators, suggests a corrective phase is underway after completing a bullish 5-wave impulse move.

    Similar to patterns seen in recent XRP price movements, Cardano is displaying a textbook ABC correction pattern, with Wave C expected to complete near the $0.75 support zone.

    Critical Support Levels Align at $0.75

    Multiple technical indicators converge around the $0.75 price level:

    • 50% Fibonacci retracement at $0.7534
    • Previous resistance turned support at $0.746
    • 21-day EMA at $0.7455
    • 21-day SMA at $0.7347
    • Volume Point of Control (POC) near $0.7318

    SPONSORED

    Trade ADA with up to 100x leverage on perpetual contracts

    Trade Now on Defx

    Bullish Case for $0.92 Target

    Despite the short-term bearish outlook, the broader trend remains constructive. Once the correction completes, technical patterns suggest a potential rally toward $0.92. However, traders should watch for confirmation signals including:

    • Bearish engulfing candle reversals
    • Clear divergence patterns
    • Volume confirmation at support levels

    FAQ Section

    What is the immediate support level for Cardano?

    The strongest support cluster exists around $0.75, with multiple technical indicators converging at this level.

    What is the upside target after the correction?

    Technical analysis suggests $0.92 as the next major target, though traders should watch for rejection at this resistance level.

    How long might the correction last?

    While timing exact bottoms is challenging, the completion of the ABC correction pattern typically signals the end of the corrective phase.

  • Cardano (ADA) Price Setup Signals 15% Rally Potential, Key Levels Revealed

    Cardano (ADA) is showing strong technical signals that point to a potential 15% upside move, as multiple chart indicators align in a bullish formation. Recent developments in Cardano’s DeFi capabilities combined with the current technical setup create a compelling case for ADA’s next major move.

    Technical Analysis Reveals Bullish Pattern Formation

    According to respected crypto analyst Thomas Anderson, ADA is currently consolidating within a descending triangle pattern on the 1-hour timeframe. The price is testing critical support at $0.6292, which has proven resilient in recent trading sessions. This technical formation, combined with increasing buying pressure, suggests that bulls are preparing for a potential breakout.

    SPONSORED

    Trade ADA with up to 100x leverage on perpetual contracts

    Trade Now on Defx

    Key Price Levels to Watch

    The technical analysis highlights several crucial price levels:

    • Current Support: $0.6292
    • Major Resistance: $0.6974
    • Secondary Support: $0.60
    • Critical Support: $0.58

    Moving Average Analysis

    The 200-period moving average remains a significant technical barrier, with ADA currently trading below this key indicator. However, the formation of higher lows on the 4-hour chart suggests growing bullish momentum, despite the current resistance at $0.6974.

    Volume Analysis and Market Sentiment

    Trading volume patterns indicate accumulation at current levels, with the potential for increased buying pressure if key resistance levels are breached. A successful break above $0.6974 could trigger a cascade of buy orders, potentially pushing ADA toward higher price targets.

    Risk Factors and Alternative Scenarios

    Traders should remain cautious of potential downside risks. A failure to hold support at $0.6292 could trigger a correction toward $0.60 or even $0.58. These levels will be crucial for maintaining the broader uptrend structure.

    Frequently Asked Questions

    What is the key resistance level for Cardano?

    The primary resistance level is at $0.6974, which needs to be broken for confirmation of the bullish scenario.

    What technical patterns support the bullish case?

    The descending triangle pattern, higher lows formation, and increasing buying pressure at support levels all suggest potential upside movement.

    What are the main risk factors?

    The main risks include a potential break below $0.6292 support and continued resistance at the 200-period moving average.

  • Cardano (ADA) Price Alert: Technical Analysis Points to $0.40 Target

    Cardano (ADA) Price Alert: Technical Analysis Points to $0.40 Target

    Cardano (ADA) is showing increasingly bearish signals as technical analysis suggests a potential drop to the $0.40 price level. This comes amid broader market turbulence, with the crypto market experiencing a 5% plunge as Bitcoin tests critical support levels.

    Technical Analysis Reveals Bearish Structure

    According to prominent analyst RLinda’s analysis on TradingView, ADA/USDT is displaying a concerning price structure that could lead to significant downside movement. The analysis, based on 4-hour candlestick data, identifies several critical price levels that traders should monitor:

    • Current resistance: $0.63 (previous support turned resistance)
    • Critical support: $0.581 (key trigger level)
    • Secondary support: $0.5092
    • Target zone: $0.40-$0.42

    Market Structure and Fibonacci Analysis

    The technical setup shows ADA has been forming lower highs since March 26, with the 0.5 Fibonacci retracement level adding additional resistance pressure. The price action suggests a classic liquidity retest pattern following a period of sideways consolidation between March 11 and May 6.

    SPONSORED

    Trade ADA with up to 100x leverage on perpetual contracts

    Trade Now on Defx

    Broader Market Context

    The bearish outlook for Cardano comes amid significant market volatility, partially triggered by recent developments in the global markets, including Trump’s tariff announcements that sent Bitcoin plunging to $76K. This macro uncertainty has created additional selling pressure across the cryptocurrency market.

    Key Support Levels and Trading Implications

    Traders should watch for these critical price levels:

    Price Level Significance
    $0.581 Primary support – breach could trigger cascade
    $0.5092 Secondary support – weak buying pressure expected
    $0.4564 Initial target in bearish scenario
    $0.40 Final target zone

    FAQ

    What is causing Cardano’s bearish outlook?

    Technical analysis shows a combination of lower highs, failed support levels, and broader market uncertainty contributing to bearish pressure.

    Where is the next major support for ADA?

    The critical support level lies at $0.581, with secondary support at $0.5092.

    What could prevent further price decline?

    A significant shift in broader market sentiment or strong buying pressure above $0.581 could help stabilize the price.

    Investors should maintain strict risk management practices given the current market conditions and potential for increased volatility.

  • Cardano (ADA) Price Breaks $0.7 Resistance: Golden Pocket Target $0.72

    Cardano (ADA) Price Breaks $0.7 Resistance: Golden Pocket Target $0.72

    Cardano (ADA) has finally broken free from its bearish trend, with technical analysis suggesting a potential rally toward the $0.72 level. After successfully defending the critical $0.65 support level, ADA’s price action shows promising signs of a trend reversal on multiple timeframes.

    Technical Breakout Confirms Bullish Structure

    According to renowned crypto analyst TehThomas on TradingView, ADA has broken out of a descending channel formation that had confined prices throughout late March. The 4-hour chart shows a clear breach of the bearish pattern, suggesting accumulation at lower levels may be complete.

    Key technical highlights include:

    • Breakout from descending channel pattern
    • Strong volume confirmation on the 4H timeframe
    • RSI showing bullish divergence
    • Multiple timeframe support at $0.65

    Golden Pocket Target: Why $0.72 Matters

    The next major resistance zone combines two powerful technical indicators:

    1. The Golden Pocket (0.618-0.65 Fibonacci retracement)
    2. A significant Fair Value Gap (FVG) from March’s decline

    SPONSORED

    Trade ADA with up to 100x leverage on perpetual contracts

    Trade Now on Defx

    Market Structure Analysis

    The convergence of technical factors at $0.72 creates a high-probability target zone. Traders should watch for:

    • Volume profile showing significant liquidity clusters
    • Potential consolidation before attempting the breakout
    • Stop-loss positioning below $0.65 support

    FAQ: Cardano’s Technical Outlook

    What is the next major resistance for Cardano?

    The immediate resistance lies at $0.72, marked by both the Golden Pocket and a Fair Value Gap.

    Is the bearish trend officially over?

    While the breakout is significant, confirmation above $0.72 would provide stronger evidence of trend reversal.

    What support levels should traders watch?

    The critical support remains at $0.65, with secondary support at $0.63.

    Conclusion: Risk Management Crucial

    While technical indicators suggest bullish momentum, traders should maintain strict risk management given the volatile nature of crypto markets. Position sizing and clear stop-losses remain essential for trading this setup effectively.

  • Cardano (ADA) Price Alert: Critical $0.65 Support Faces Major Test

    Cardano (ADA) Price Alert: Critical $0.65 Support Faces Major Test

    Cardano (ADA) continues its bearish trend as the cryptocurrency struggles to maintain crucial support levels. After a brief recovery attempt above $0.68, ADA has retreated to consolidate near $0.65, leaving investors questioning whether a significant rebound is possible in the near term.

    Key Technical Levels Under Pressure

    The recent price action shows ADA facing multiple technical hurdles:

    • Current trading price below both $0.68 and the 100-hourly SMA
    • Critical support breach at $0.6720 trendline
    • Formation of lower highs, with recent peak at $0.7090
    • 23.6% Fibonacci retracement level acting as immediate resistance

    SPONSORED

    Trade ADA with up to 100x leverage and maximize your profit potential

    Trade Now on Defx

    Market Analysis and Price Targets

    Similar to the broader crypto market downturn discussed in recent market analysis, Cardano’s technical indicators paint a concerning picture:

    Bullish Scenario ($0.70+)

    • Immediate resistance at $0.6720
    • Secondary resistance at $0.6950
    • Major psychological barrier at $0.70
    • Potential rally targets: $0.7420 and $0.7650

    Bearish Scenario (Sub-$0.65)

    • Critical support at $0.6420
    • Secondary support at $0.6350
    • Major support zone: $0.60-$0.62

    Technical Indicators Overview

    Indicator Signal Implication
    MACD Bearish Losing momentum in bearish zone
    RSI Bearish Below 50 level
    Moving Averages Bearish Trading below 100-hour SMA

    Frequently Asked Questions

    What is causing Cardano’s price decline?

    The current decline appears to be technical in nature, with bears maintaining control below key resistance levels and broader market sentiment affecting crypto assets.

    Can ADA recover to $0.70 in the near term?

    While possible, ADA needs to clear several resistance levels, with $0.6720 being the first major hurdle before any sustained recovery to $0.70 is possible.

    What’s the worst-case scenario for ADA price?

    If current support levels fail, ADA could test the major support zone at $0.60, which analysts identify as a potential bottom.

    Investors should closely monitor these key levels while maintaining proper risk management strategies in this volatile market environment.