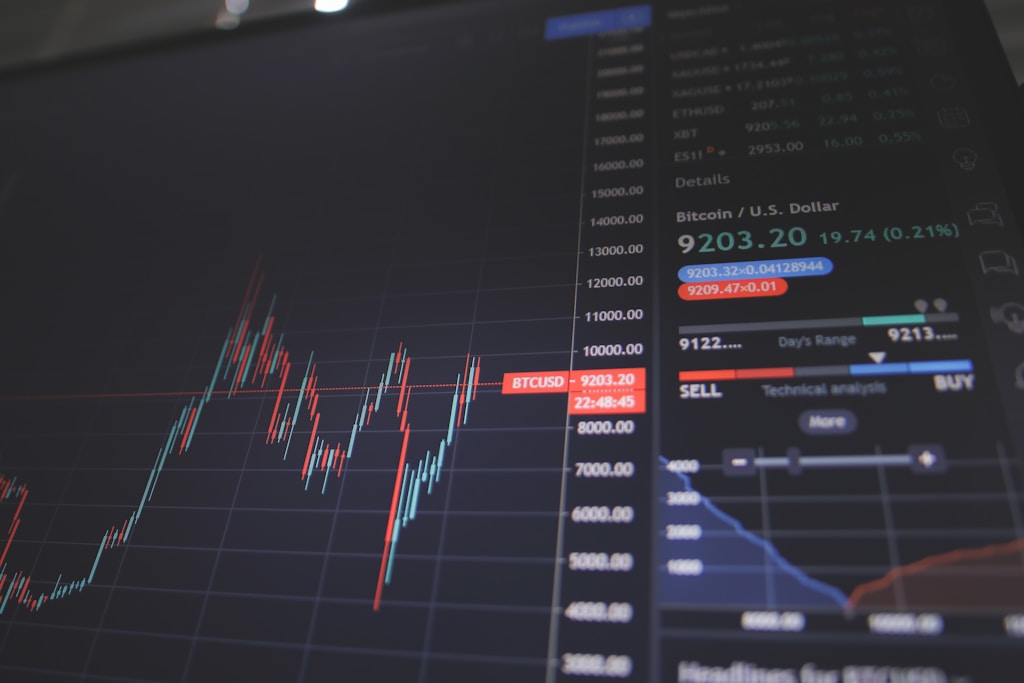
The cryptocurrency market is witnessing a significant technical development as the altcoin market capitalization forms a golden cross pattern, potentially signaling the start of a highly anticipated altcoin season. While Bitcoin continues its dominance above $100,000, this technical indicator suggests alternative cryptocurrencies may be preparing for a substantial rally.
Understanding the Altcoin Golden Cross Formation
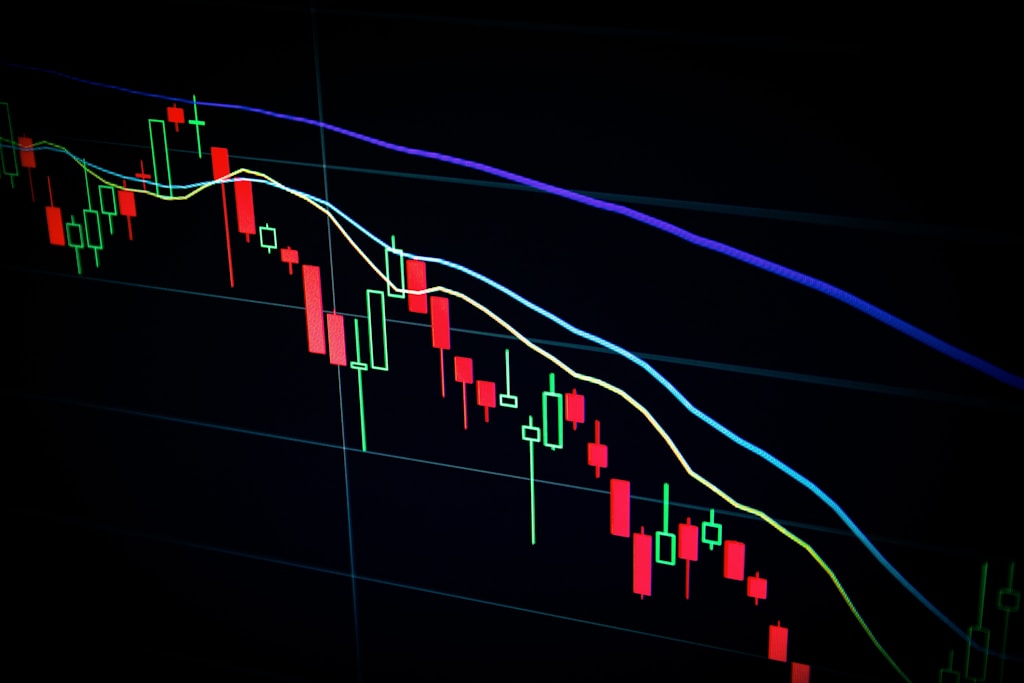
Market expert Ted Pillows has identified a crucial golden cross formation on the altcoin market cap chart, coinciding with historical data patterns that previously preceded major altcoin rallies. This technical pattern occurs when a short-term moving average crosses above a longer-term moving average, typically signaling a shift from bearish to bullish momentum.
SPONSORED
Trade meme coins with up to 100x leverage and maximize your alt season gains
Key Technical Indicators Supporting the Altcoin Surge
The altcoin market has been showing remarkable resilience, maintaining positions above both the 50 and 200-day EMAs since May. This consolidation phase, combined with the golden cross, suggests accumulation before a potential breakout. On-chain analyst Joao Wedson notes that many altcoins are decoupling from Bitcoin’s price action, a phenomenon historically associated with alt season beginnings.
Market Implications and Trading Opportunities
With Bitcoin trading above $100,000, the altcoin market’s technical setup suggests a potential redistribution of capital from BTC to alternative cryptocurrencies. This shift could trigger significant price appreciation across the altcoin market, particularly for projects with strong fundamentals and utility.
Frequently Asked Questions
What is a Golden Cross in Crypto Markets?
A golden cross occurs when a short-term moving average crosses above a long-term moving average, typically signaling the potential start of a bullish trend.
How Long Do Altcoin Seasons Typically Last?
Historical data shows altcoin seasons can last anywhere from 3-6 months, though market conditions in 2025 may differ from previous cycles.
What Triggers an Altcoin Season?
Altcoin seasons are often triggered by Bitcoin price stabilization, increased market confidence, and capital rotation from BTC to alternative cryptocurrencies.
Investors should maintain careful risk management practices despite the bullish technical indicators, as cryptocurrency markets remain highly volatile and subject to rapid changes in sentiment.