Tag: Altcoin Trading

  • Bitcoin Price Alert: $98K Support Level Could Trigger Major Altcoin Rally

    Bitcoin Price Alert: $98K Support Level Could Trigger Major Altcoin Rally

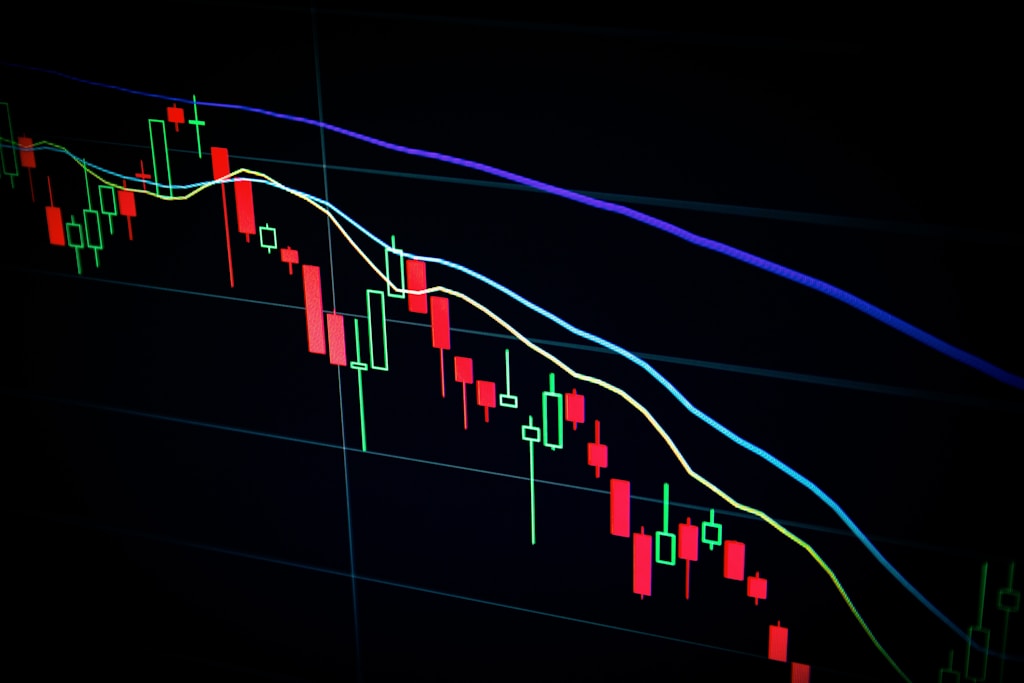
    Bitcoin’s price trajectory is showing signs of a potential correction after reaching new heights above $100,000. While the leading cryptocurrency maintains bullish momentum, technical analysis suggests an imminent retracement that could present significant buying opportunities across the crypto market.

    Technical Analysis Points to Strategic Bitcoin Price Levels

    According to respected crypto analyst Xanrox, Bitcoin is breaking down from an ascending parallel channel that formed during its climb from $74,000 to $112,000. This technical pattern, combined with recent resistance tests at the $107,000 level, suggests a corrective phase may be imminent.

    Key technical factors supporting this analysis include:

    • Formation of a symmetrical triangle pattern within the channel
    • Completion of five Elliott Wave theory waves
    • Multiple unfilled Fair Value Gaps (FVG)
    • Critical Fibonacci retracement levels at $98,000, $92,000, and $87,500

    Strategic Buying Zones Identified

    The analysis points to three potential buying zones based on Fibonacci retracement levels:

    • Primary support: $98,000 (0.382 Fibonacci level)
    • Secondary support: $92,000 (0.500 Fibonacci level)
    • Final support: $87,500 (0.618 Fibonacci level)

    SPONSORED

    Trade Bitcoin with up to 100x leverage and maximize your profit potential

    Trade Now on Defx

    Implications for Altcoin Markets

    The anticipated Bitcoin correction could create prime buying opportunities in the altcoin market. As historically observed, significant Bitcoin price movements often precede larger percentage moves in alternative cryptocurrencies. Recent data showing decreased selling pressure from long-term holders suggests the correction may be relatively short-lived.

    FAQ: Key Points for Traders

    When should investors consider entering positions?

    The first major buying opportunity presents itself at the $98,000 level, coinciding with the 0.382 Fibonacci retracement.

    What indicators support this analysis?

    Multiple technical factors including Elliott Wave completion, symmetrical triangle formation, and unfilled Fair Value Gaps support the correction thesis.

    How might this affect altcoin prices?

    Altcoins typically experience more significant percentage moves during Bitcoin corrections, potentially offering enhanced buying opportunities.

    As the market prepares for this potential correction, traders should maintain strict risk management practices and consider dollar-cost averaging into positions at the identified support levels.
  • TRON Price Could Surge 4X as Bitcoin Correlation Strengthens

    TRON (TRX) is showing strong bullish momentum in correlation with Bitcoin’s upward trend, positioning itself for potentially massive gains in the coming months. The cryptocurrency has already posted a 10% increase over the past 30 days, currently trading at $0.2748 with a 0.7% 24-hour gain.

    A comprehensive analysis by CryptoQuant contributor Carmelo Alemán reveals compelling evidence for TRX’s growth potential, particularly given its strong correlation with Bitcoin’s current bull market trajectory toward $122K.

    Understanding TRON’s Bitcoin Correlation Advantage

    The relationship between TRX and BTC prices has become increasingly significant as the crypto market enters what many analysts expect to be an extended bull cycle through Q4 2025. This correlation manifests in several key ways:

    • Price movement synchronization with Bitcoin
    • Similar market cycle patterns
    • Amplified percentage gains due to lower market cap

    SPONSORED

    Trade TRON with up to 100x leverage on perpetual contracts

    Trade Now on Defx

    Key Growth Catalysts for TRON

    Several fundamental factors support TRON’s potential for significant price appreciation:

    1. Surpassing Ethereum in USDT volume
    2. Growing network activity in Asian markets
    3. Strategic position for Bitcoin bull market leverage
    4. Lower market cap allowing for larger percentage gains

    Expert Price Predictions and Analysis

    According to Alemán’s analysis, while Bitcoin might achieve a 2x growth from current levels, TRON’s smaller market cap positions it for potentially larger gains: “Highly correlated tokens could triple, quadruple, or more, simply because their smaller market caps make such expansions more feasible.”

    FAQ Section

    Why is TRON’s correlation with Bitcoin significant?

    The correlation indicates that TRON tends to follow Bitcoin’s price movements but with potentially amplified returns due to its smaller market cap.

    What are the key price targets for TRON?

    Based on current analysis and Bitcoin correlation patterns, TRON could potentially see 3-4x growth during this bull cycle.

    How does TRON’s USDT volume compare to Ethereum?

    TRON has recently surpassed Ethereum in USDT transaction volume, indicating growing real-world adoption and utility.

    As Bitcoin continues testing new all-time highs, TRON’s strong correlation and growing fundamental strength position it as a potential outperformer in the current market cycle.

  • Tron (TRX) Price Shows Bullish Momentum as Buy Pressure Surges

    While Bitcoin continues its historic rally past $110,000, Tron (TRX) has been quietly building strength in a tight consolidation pattern. Despite trading 66% below its December peak, fresh on-chain data suggests TRX could be preparing for a significant breakout. Recent Bitcoin price action hitting new all-time highs has set the stage for potential altcoin rallies.

    On-Chain Metrics Signal Growing Buy Pressure

    CryptoQuant’s latest analysis reveals that TRX has entered a strong buying pressure zone, with the Buy/Sell Pressure Delta turning decisively positive. This key metric, which tracks net buying activity over 90-day periods, has historically preceded significant price movements when aligned with robust fundamentals.

    SPONSORED

    Trade TRX with up to 100x leverage on perpetual contracts

    Trade Now on Defx

    Technical Analysis Points to Potential Breakout

    TRX is consolidating between $0.26 and $0.28, with multiple technical indicators suggesting accumulation:

    • 34-day EMA providing strong dynamic support at $0.26
    • Higher lows forming since early April
    • 50, 100, and 200 SMAs aligned bullishly below current price
    • Volume profile showing increased buying at support

    Key Price Levels to Watch

    For confirmation of the bullish setup, traders should monitor:

    • Immediate resistance: $0.28
    • Critical support: $0.26
    • Breakout target: $0.30
    • December high retest: $0.36

    Frequently Asked Questions

    What is causing the increased buying pressure in TRX?

    The surge in buying pressure can be attributed to strong network fundamentals, including leading stablecoin settlement volume and growing user activity on the Tron network.

    Could TRX follow Bitcoin’s recent rally?

    While Bitcoin has dominated recent market movements, historical patterns suggest altcoins often follow Bitcoin’s lead after periods of consolidation. TRX’s technical setup and on-chain metrics indicate potential for upside movement.

    What are the key risk factors to consider?

    A break below $0.26 support could trigger a decline toward $0.2430. Additionally, broader market sentiment and Bitcoin’s performance will likely influence TRX’s short-term price action.

  • Litecoin Price Eyes $117.50 Breakout After 69% Monthly Rally

    Litecoin Price Eyes $117.50 Breakout After 69% Monthly Rally

    Litecoin (LTC) is showing strong bullish momentum after surging 69% in the past month, with analysts eyeing a potential breakout to $117.50. The cryptocurrency is currently consolidating near critical support levels as Bitcoin trades near its all-time high of $109K, setting up what could be a significant move for LTC.

    Technical analyst Carl Runefelt has identified a bullish flag pattern forming on Litecoin’s chart, suggesting the potential for further upside. The pattern, typically a continuation signal, comes after LTC’s impressive rally from April lows of $66 to recent highs above $100.

    Technical Analysis Points to Key Support and Resistance Levels

    Litecoin is currently trading at $95.35, finding support above its 200-day EMA at $93.82. The critical resistance zone lies at the 200-day SMA near $100.76, with the psychological $100 level proving to be a significant hurdle. A breakthrough above these levels could trigger the projected move to $117.50.

    SPONSORED

    Trade Litecoin with up to 100x leverage on perpetual contracts

    Trade Now on Defx

    Market Structure Supports Bullish Thesis

    Volume analysis shows decreasing selling pressure during recent consolidation, supporting the bullish continuation thesis. The broader crypto market sentiment remains positive, with Bitcoin’s strength likely to provide additional tailwinds for altcoins like Litecoin.

    FAQ: Key Questions About Litecoin’s Current Setup

    What are the key support levels to watch?

    The primary support zone lies at $93.82 (200-day EMA), with secondary support at $90.00.

    What could trigger the breakout to $117.50?

    A decisive break above $100.76 with increased volume would confirm the bullish flag pattern and potentially trigger the move to $117.50.

    What are the main risks to this setup?

    A Bitcoin reversal from current levels could impact the broader market, potentially derailing Litecoin’s bullish setup.

  • Dogwifhat (WIF) Price Surges 50% Weekly, Eyes $1.50 Breakout Target

    Dogwifhat (WIF) Price Surges 50% Weekly, Eyes $1.50 Breakout Target

    The Solana-based memecoin Dogwifhat (WIF) has demonstrated remarkable strength with a 50% weekly gain, as technical analysts point to a potential breakout toward the $1.50 price target. This surge comes amid broader momentum in the Solana ecosystem, where new token launches continue to gain traction.

    WIF Reclaims Critical $1.00 Support Level

    In a significant technical development, WIF has successfully recaptured the psychologically important $1.00 price level after experiencing a massive 190% monthly rally. This recovery follows a prolonged downtrend that saw the token retrace 92% from its Q4 2024 peak of $4.19.

    SPONSORED

    Trade meme coins like WIF with up to 100x leverage on perpetual contracts

    Trade Now on Defx

    Technical Analysis Points to Further Upside

    Multiple technical indicators suggest WIF could be preparing for its next leg up:

    • Classic bullish structure confirmed after rebounding from the $0.95-$0.98 Fibonacci zone
    • Symmetrical triangle breakout above $1.05
    • Falling wedge pattern completion on lower timeframes
    • Strong support established at $1.00

    Key Price Targets

    Analysts have identified several critical price levels for WIF’s potential upward movement:

    • Initial resistance: $1.15
    • Secondary target: $1.26
    • Major resistance: $1.37
    • Ultimate target: $1.50

    Market Expert Perspectives

    Several prominent analysts have shared bullish outlooks for WIF:

    • Trader Coinvo: Predicts a ‘guaranteed’ parabolic rally based on break and retest pattern
    • Carl Runefelt: Suggests continuation toward new highs
    • The Cryptonomist: Projects $1.49 target if market conditions remain favorable

    FAQ Section

    What is driving WIF’s current price surge?

    The rally is primarily driven by technical breakouts, increased trading volume, and renewed interest in Solana-based memecoins.

    What are the key support levels to watch?

    Critical support levels include $1.00, $0.95, and $0.90, with the $1.00 level being particularly significant.

    Could WIF reach new all-time highs?

    While analysts are bullish on the near-term $1.50 target, reaching the previous all-time high of $4.19 would require significant momentum and market support.

  • Bitcoin MACD Signal Predicts $200K Target: Top 4 Altcoins to Watch

    Bitcoin MACD Signal Predicts $200K Target: Top 4 Altcoins to Watch

    A historic Bitcoin technical indicator that accurately predicted the 2023 and 2024 bull runs has just flashed green, suggesting BTC could reach $200,000. The MACD histogram’s latest bullish flip comes as Bitcoin tests critical resistance at $105,000, setting up what could be a monumental rally.

    Understanding the MACD Signal

    The Moving Average Convergence Divergence (MACD) histogram has demonstrated remarkable accuracy, with a success rate exceeding 83% in predicting major Bitcoin price movements. This technical indicator combines multiple moving averages to identify trend changes and momentum shifts.

    SPONSORED

    Trade Bitcoin with up to 100x leverage and capitalize on the next rally

    Trade Now on Defx

    Historical Performance and Current Implications

    The MACD histogram’s recent transition to green mirrors similar signals from October 2024, October 2023, and August 2022 – each preceding significant BTC rallies. This pattern, combined with strong accumulation signals from exchange outflows, suggests substantial upside potential.

    Top 4 Altcoins Positioned for Growth

    1. BTC Bull Token ($BTCBULL)

    This innovative token combines Bitcoin price action with deflationary tokenomics and unique BTC airdrops triggered by Bitcoin’s price milestones.

    2. OFFICIAL TRUMP ($TRUMP)

    Following a 12,000% surge and subsequent correction, this politically-aligned token has shown renewed strength with a 60% monthly gain.

    3. Solaxy ($SOLX)

    As Solana targets $360, this Layer 2 scaling solution addresses critical network congestion issues.

    4. ai16z ($AI16Z)

    This AI-driven venture capital token has demonstrated impressive growth with a 120% monthly increase and strong technical setup.

    Risk Management Considerations

    While technical indicators suggest bullish momentum, investors should maintain prudent position sizing and risk management strategies given crypto market volatility.

    FAQ Section

    • What is the MACD histogram’s accuracy rate?
      The indicator has correctly predicted 5 out of 6 major Bitcoin moves, achieving an 83% accuracy rate.
    • When is the first BTC Bull Token airdrop?
      The first airdrop triggers when Bitcoin reaches $150,000.
    • What makes Solaxy unique?
      It’s the first Layer 2 scaling solution specifically designed for Solana.
  • XRP, Cardano, Solana Technical Analysis: 3 New Crypto Projects Surge

    Technical indicators are flashing bullish signals for major altcoins XRP, Cardano (ADA), and Solana (SOL), with several emerging crypto projects showing significant momentum amid the broader market recovery. Recent market turbulence caused by Trump’s proposed tariffs appears to be subsiding as key technical metrics turn positive.

    Major Altcoins Show Technical Strength

    XRP has demonstrated remarkable resilience, climbing 19.44% from its recent bottom of $1.80 to reach $2.15. The token’s RSI reading of 50.50 has crossed above its 14-period moving average, historically a precursor to continued upward movement. Technical analysis suggests XRP could target the $2.50 level if current momentum persists.

    Meanwhile, Cardano (ADA) has posted an 18.6% recovery from $0.537 to $0.637, with its RSI at 47.75 approaching the neutral 50 mark. A break above the $0.65 resistance level could accelerate gains.

    Solana’s price action remains particularly strong, trading at $131.44 after clearing the $125 resistance. Its RSI of 53.81 confirms growing bullish sentiment.

    SPONSORED

    Trade Solana with up to 100x leverage on perpetual contracts

    Trade Now on Defx

    Emerging Projects Gaining Traction

    Three new crypto projects are showing particular promise in the current market environment:

    1. Solaxy ($SOLX)

    As Solana’s first Layer-2 scaling solution, Solaxy has already secured over $30M in presale funding. The project aims to address Solana’s persistent congestion issues while enabling seamless integration with Ethereum’s DeFi ecosystem.

    2. SUBBD Token ($SUBBD)

    This AI-powered content creation platform targeting the $85B subscription market is currently available at $0.05515. The project combines creator tools with blockchain-based monetization.

    3. PepeX ($PEPEX)

    An innovative no-code tokenization platform leveraging AI for automated token launches and marketing, PepeX is positioning itself as a key infrastructure player in the evolving crypto ecosystem.

    Market Outlook and Investment Considerations

    While established altcoins show technical strength, emerging projects offer unique value propositions and potential growth opportunities. However, investors should conduct thorough due diligence and consider risk management strategies in this volatile market environment.

    FAQ Section

    • What is driving the current altcoin recovery?
      Technical indicators, improving market sentiment, and project-specific developments are contributing to the positive price action.
    • How do Layer-2 solutions benefit existing blockchains?
      Layer-2 solutions like Solaxy help improve scalability, reduce congestion, and lower transaction costs while maintaining security.
    • What role does AI play in new crypto projects?
      AI integration enables automated operations, enhanced user experiences, and more efficient platform management across various use cases.
  • Solana Price Tests $100: Bullish Divergence Signals 60% Relief Rally

    Solana Price Tests $100: Bullish Divergence Signals 60% Relief Rally

    Solana (SOL) has plunged over 60% from recent highs as macroeconomic tensions trigger widespread crypto market selling. Trump’s aggressive trade policies and new tariff threats have sent shockwaves through risk assets, with SOL among the hardest hit altcoins.

    Despite the brutal selloff pushing SOL below critical $100 support, prominent crypto analyst Bluntz has identified bullish divergence patterns that could signal an imminent relief rally. Technical indicators suggest the token is severely oversold after dropping more than 20% in recent days.

    Technical Analysis: Key Support Levels Under Pressure

    SOL is currently trading at $108, struggling to maintain position above the psychologically important $100 level. The breakdown below previous support at $120 marked a decisive shift in market sentiment, leaving bulls scrambling to defend the last major demand zone before potential drops to $80.

    SPONSORED

    Trade Solana with up to 100x leverage on perpetual contracts

    Trade Now on Defx

    Bullish Divergence Patterns Emerge

    According to Bluntz’s analysis shared on X, multiple technical indicators are showing hidden bullish divergence – a pattern that often precedes significant price recoveries. The analyst has begun accumulating positions in oversold altcoins including SOL, noting that “sizeable bounces are highly likely” even if this isn’t the definitive market bottom.

    Key Price Levels to Watch

    • Critical Support: $100 – Must hold to prevent cascade to $80
    • First Resistance: $120 – Previous support turned resistance
    • Bull Case Target: $160 – 50% recovery from current levels

    Market Impact of Trade War Fears

    The broader crypto market remains under pressure as Trump’s tariff deadline approaches, with altcoins particularly vulnerable to risk-off sentiment. However, extreme oversold conditions and emerging bullish divergences suggest a technical bounce may be imminent.

    FAQ

    Q: What caused Solana’s recent price crash?
    A: A combination of Trump’s trade war escalation, broader crypto market weakness, and technical breakdown below key support levels triggered cascading liquidations.

    Q: What are the key levels to watch for a recovery?
    A: Bulls need to reclaim and hold $120 to signal a potential trend reversal. The $100 level is critical support.

    Q: Could SOL drop further from here?
    A: If $100 support fails, analysts warn SOL could test the next major demand zone around $80.

  • Bitcoin Holders Accumulate During 23% Dip, Signaling $100K Rally

    Bitcoin Holders Accumulate During 23% Dip, Signaling $100K Rally

    Bitcoin’s recent 23% correction from its all-time high has triggered significant accumulation by both short and long-term holders, suggesting a potential rally toward $100,000. Recent supply ratio analysis indicates a strong breakout potential, with current market dynamics showing remarkable resilience.

    Bitcoin Accumulation Reaches Critical Mass

    Short-term holders (STHs) have demonstrated unprecedented confidence by adding 15,000 BTC in early April alone, while long-term holders (LTHs) have accumulated an impressive 400,000 BTC since February. This brings total holdings to 3.7M and 13.5M BTC respectively, indicating strong conviction across both investor categories.

    Market Decoupling Signals Strength

    In a significant development that echoes recent analysis showing Bitcoin’s growing independence from traditional markets, BTC has shown remarkable resilience against broader market turbulence. While the S&P 500 plunged 10% and gold dropped 4.8% following Trump’s tariff announcement, Bitcoin quickly recovered from a minor 3% dip to reach $82.5K.

    SPONSORED

    Maximize your trading potential with up to 100x leverage on perpetual contracts

    Trade Now on Defx

    Alternative Investment Opportunities

    While Bitcoin shows strong fundamentals, several emerging projects offer compelling investment opportunities:

    BTC Bull Token ($BTCBULL)

    Currently in presale at $0.002445, $BTCBULL offers direct exposure to Bitcoin’s growth potential with additional rewards through its innovative tokenomics.

    Solaxy ($SOLX)

    As Solana’s first Layer 2 solution, $SOLX addresses critical scalability challenges while maintaining the network’s speed advantages.

    FirstBroccoli ($BROCCOLI)

    This meme coin has demonstrated impressive 500% growth since launch, with recent price action suggesting continued momentum.

    Expert Analysis and Market Outlook

    Michael Saylor’s assessment of Bitcoin’s immunity to tariff impacts adds credibility to the digital asset’s unique advantages in the current economic climate. The combination of institutional interest and retail accumulation suggests strong support for continued price appreciation.

    FAQs

    • What is driving Bitcoin’s current accumulation phase?
      A combination of institutional buying, retail confidence, and market decoupling from traditional assets.
    • How does Trump’s tariff announcement affect Bitcoin?
      Bitcoin has shown resilience and independence from traditional market reactions to the tariffs.
    • What are the key price levels to watch?
      Current support at $76.6K with potential resistance at $100K based on accumulation patterns.

    Disclaimer: This article isn’t financial advice. Always conduct thorough research before making investment decisions.

  • Chainlink Price Alert: $13 Support Test Could Trigger 92% Rally

    Chainlink Price Alert: $13 Support Test Could Trigger 92% Rally

    Chainlink (LINK) is showing signs of strength as it tests a critical support level at $13, with technical analysis suggesting a potential 92% rally if this key zone holds. Currently trading at $14.30, LINK has maintained relative stability despite broader market uncertainty, outperforming many altcoins with a 27% recovery from its March 11 lows.

    Renowned crypto analyst Ali Martinez has identified a crucial technical setup that could determine LINK’s next major move. According to Martinez’s analysis, the $13 level represents the lower boundary of a well-defined price channel that has historically preceded significant rallies.

    SPONSORED

    Trade LINK with up to 100x leverage on perpetual contracts

    Trade Now on Defx

    Technical Analysis Points to Significant Upside Potential

    The current price action shows several bullish indicators:

    • Strong support established at $13
    • Potential breakout target of $25 (75% upside)
    • Extended target at $50 if momentum builds (92% potential gain)
    • Key resistance at $15 needs to be cleared

    Similar to how Cardano recently showed bullish signals on its 4-hour chart, LINK’s technical setup suggests an imminent move. The token’s ability to hold above $13 despite recent market volatility demonstrates underlying strength.

    Market Context and Trading Volumes

    LINK has experienced a significant correction, falling over 61% from its December peak of $30. However, current market data shows:

    • Increasing trading volume near support levels
    • Growing institutional interest
    • Improved market sentiment as macro conditions stabilize

    Key Price Levels to Watch

    Traders should monitor these critical price points:

    • Support: $13 (primary), $12 (secondary)
    • Resistance: $15 (immediate), $17 (previous support turned resistance)
    • Breakout confirmation level: $15.50

    FAQ Section

    What is the current Chainlink price prediction?

    Analysts suggest a potential rally to $25 if $13 support holds, with an extended target of $50 under optimal conditions.

    Is Chainlink a good investment in 2025?

    Technical indicators and market fundamentals suggest positive momentum, but investors should conduct thorough research and consider their risk tolerance.

    What could trigger a LINK price rally?

    A confirmed break above $15 resistance, increased institutional adoption, and improving market sentiment could catalyze upward movement.