Bitcoin (BTC) faces mounting bearish pressure as it tests a crucial support level at $105,000, marking a significant pullback from its recent all-time high of $112,000. This market development comes as technical indicators suggest potential further downside, with on-chain metrics showing increased selling activity.
Market Pressure Intensifies as Global Factors Weigh In
The current price action is heavily influenced by macroeconomic factors, particularly the Federal court’s decision to reinstate former President Trump’s tariffs on multiple countries. This unexpected development has introduced new volatility across risk assets, including the cryptocurrency market.
Key market indicators paint a concerning picture:
- Bitcoin Cumulative Net Taker Volume has turned negative
- Support zone between $105K-$106K under heavy testing
- Trading volume shows significant bearish momentum
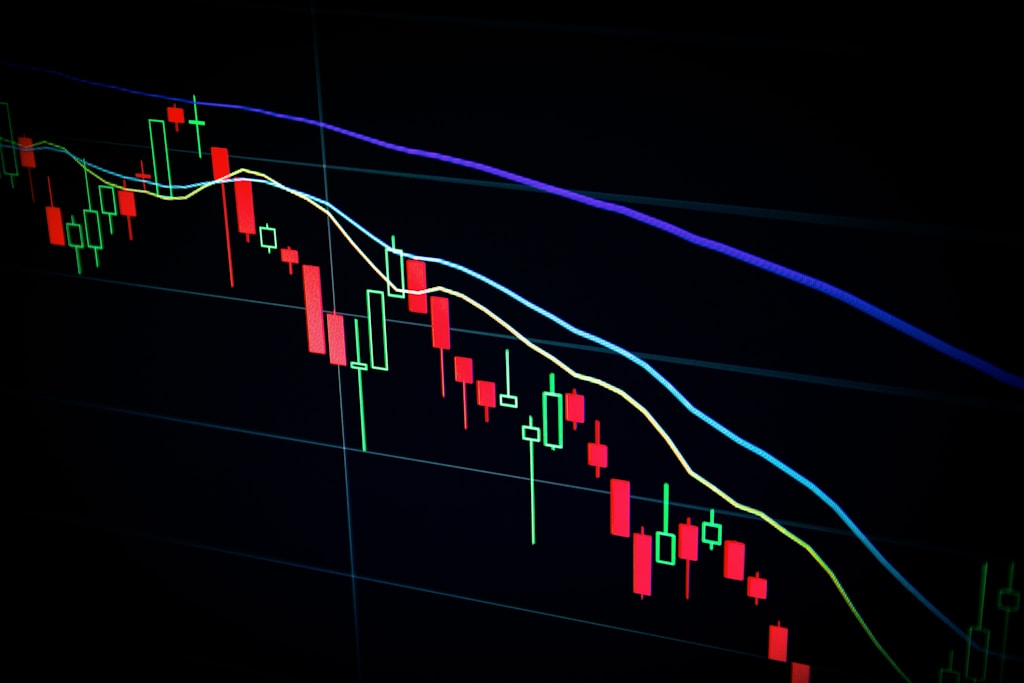
Technical Analysis Reveals Critical Support Levels
The 4-hour chart analysis shows Bitcoin trading below several key moving averages:
- 34-period EMA: Bearish crossover
- 50 SMA: Price action below indicator
- 100 SMA: Supporting bearish momentum
A breakdown below the current support could trigger a cascade of selling, potentially leading to a retest of $102,000, where the 200 SMA provides the next significant support level.
SPONSORED
Trade Bitcoin with up to 100x leverage and maximize your profit potential
On-Chain Metrics Signal Growing Bearish Pressure
CryptoQuant data reveals increasing aggressive selling pressure, with the Bitcoin Cumulative Net Taker Volume showing sustained negative readings. This metric historically precedes significant price movements, suggesting potential further downside if buying pressure doesn’t materialize soon.
Market Outlook and Key Levels to Watch
For bulls to regain control, Bitcoin needs to:
- Hold the $105K support level
- Reclaim $109K resistance
- Break above the recent high of $112K
Failure to maintain these levels could trigger a deeper correction, potentially testing lower support zones. Recent liquidation data shows significant market stress, with over $644 million in positions liquidated during the recent downturn.
Frequently Asked Questions
What’s causing Bitcoin’s current price decline?
The decline is primarily driven by macroeconomic factors, including Trump tariff reinstatement and increased selling pressure from short-term holders.
What are the key support levels to watch?
Critical support levels include $105K-$106K zone, followed by $103,600 and the 200 SMA near $102K.
Could Bitcoin recover from current levels?
A recovery is possible if bulls defend the $105K support and successfully reclaim $109K, which could signal renewed upward momentum.