Tag: Bitcoin Liquidations

  • Bitcoin Short Liquidations Surge 11.5% – Bullish Signal or Market Top?

    Bitcoin Short Liquidations Surge 11.5% – Bullish Signal or Market Top?

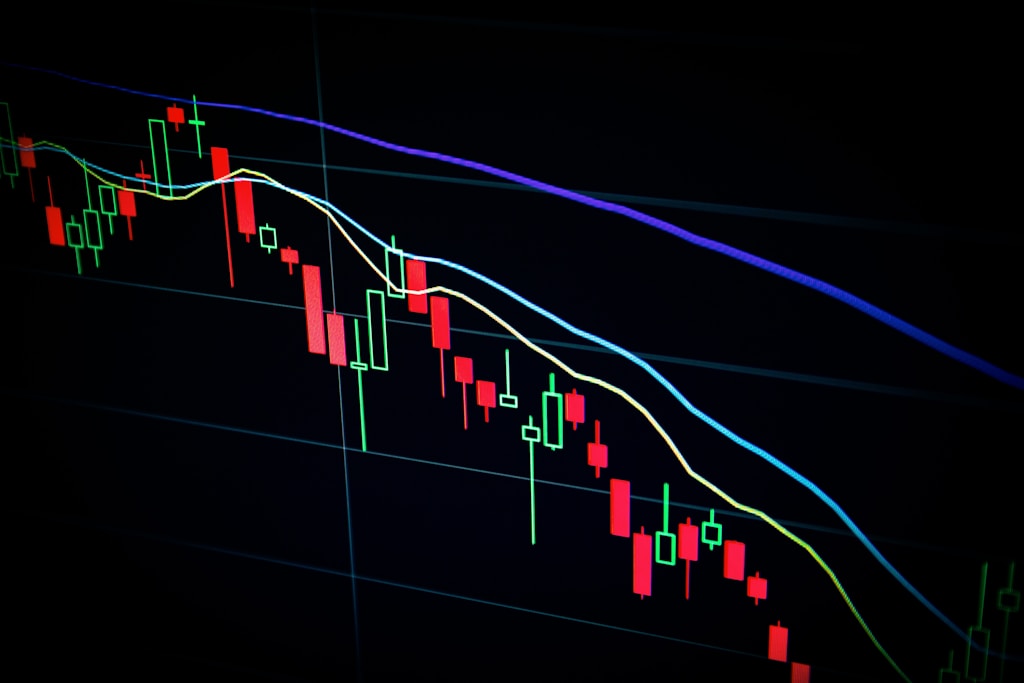
    Recent data reveals Bitcoin short liquidations have significantly outpaced long positions, raising questions about market direction as BTC trades near $104,800. This analysis explores whether the current liquidation pattern signals continued upside or warns of an impending correction.

    Bitcoin Liquidation Metrics Show Bearish Bets Getting Crushed

    According to data from CryptoQuant, the Bitcoin liquidation dominance oscillator has entered negative territory at -11.5%, indicating a clear dominance of short position liquidations. This trend aligns with recent whale accumulation patterns that have supported BTC’s upward momentum.

    SPONSORED

    Maximize your trading potential with up to 100x leverage on perpetual contracts

    Trade Now on Defx

    Historical Context: Short Liquidation Patterns

    The current -11.5% reading sits well below previous market tops:

    • December 2024: -16.5%
    • April 2024: -19%
    • January 2023: -24%

    This suggests the market hasn’t reached the extreme levels typically associated with local tops, despite Bitcoin trading near $104,800. The moderate reading aligns with recent on-chain metrics indicating sustained bull market strength.

    Institutional Activity Provides Additional Context

    Glassnode’s analysis of Unspent Realized Price Distribution (URPD) reveals significant institutional positioning:

    • Large holders (100-10k BTC) dominate activity above $90,000
    • Mega-whales (>100k BTC) concentrated at $74k-76k
    • Institutional whales (10k-100k BTC) active at $78k-79k, $85k-90k, and current levels

    Market Implications and Trading Outlook

    The current liquidation pattern suggests continued bullish momentum without overheating signals. Key factors supporting this view:

    • Moderate short liquidation levels compared to historical tops
    • Strong institutional positioning at key price levels
    • Absence of extreme leverage indicators

    FAQ Section

    What does the liquidation oscillator indicate?

    The liquidation oscillator measures the balance between long and short liquidations, with negative values indicating more short positions being liquidated than longs.

    Is the current market overheated?

    With the oscillator at -11.5%, current levels suggest healthy market conditions without the extreme readings (-16% to -24%) typically associated with market tops.

    What role are institutions playing?

    On-chain data shows significant institutional accumulation between $74k-90k, providing strong support levels below current prices.

  • Bitcoin Liquidations Hit $185M as Long-Term Holders Buy the Dip

    Bitcoin Liquidations Hit $185M as Long-Term Holders Buy the Dip

    Bitcoin’s recent price correction from $112,000 to $106,600 has triggered a significant market event, with over-leveraged traders facing substantial losses while long-term investors capitalize on the opportunity. This price action reveals a stark contrast between different market participants’ strategies and risk management approaches.

    Understanding the $185M Liquidation Event

    According to CryptoQuant analysis, the weekend’s price movement resulted in approximately $185 million in long position liquidations. The cascade occurred in two major waves:

    • First wave: $97 million liquidated at $110,900
    • Second wave: $88 million wiped out below $109,000

    These liquidations primarily affected ‘late longs’ – leveraged positions opened after recent price rallies by traders attempting to capture continued upward momentum. Despite recent predictions of Bitcoin reaching $200,000, these aggressive positions proved unsustainable during short-term volatility.

    Long-Term Holder Accumulation Reaches New Heights

    While short-term traders faced liquidations, long-term holders (LTH) demonstrated strong conviction by increasing their positions. The LTH realized capitalization has surpassed $28 billion – a new record since April 2025. This accumulation pattern suggests growing institutional confidence in Bitcoin’s long-term value proposition.

    SPONSORED

    Trade Bitcoin with up to 100x leverage and maximize your profit potential

    Trade Now on Defx

    Market Structure Remains Healthy

    Several indicators suggest this bull run differs from previous cycles:

    • Limited market euphoria despite new all-time highs
    • Strong institutional buying pressure
    • Healthy technical indicators showing minimal overheating
    • Growing long-term holder base

    Expert Analysis and Price Targets

    Market analysts remain bullish on Bitcoin’s prospects. Notable predictions include:

    • Gert Van Lagen: $300,000 price target for current cycle
    • Recent achievement of highest weekly close in history
    • Continued institutional interest, including potential new purchases by Michael Saylor’s Strategy

    FAQ Section

    What caused the recent Bitcoin liquidations?

    The liquidations were triggered by a price drop from $112,000 to $106,600, affecting over-leveraged long positions that were opened during the recent rally.

    How are long-term holders responding to the dip?

    Long-term holders are actively accumulating Bitcoin, with the LTH realized capitalization exceeding $28 billion for the first time since April 2025.

    What’s the current Bitcoin price outlook?

    Bitcoin currently trades at $109,535, up 1.9% in 24 hours, with analysts maintaining bullish predictions ranging from $200,000 to $300,000 for this cycle.