Tag: Bitcoin Metrics

  • Bitcoin Realized Cap Metric Signals Strong Bull Market Despite $105K Range

    Bitcoin Realized Cap Metric Signals Strong Bull Market Despite $105K Range

    Bitcoin’s on-chain metrics are painting a bullish picture despite recent price consolidation around $105,000, with the Realized Cap Impulse metric showing remarkable strength that suggests the current bull market remains firmly intact.

    Key Realized Cap Metrics Signal Continued Strength

    While Bitcoin’s price action has shown signs of weakness lately, key on-chain metrics suggest strong support levels remain intact. The Realized Cap Impulse, a critical indicator tracking the Bitcoin network’s total cost basis, has maintained firm positioning at crucial support levels despite recent market turbulence.

    According to data from Alphractal, an advanced on-chain analytics platform, the Realized Cap Impulse metric is demonstrating persistent strength – a key signal that typically precedes continued upward price movement. This metric’s resilience suggests substantial underlying demand for Bitcoin, even as prices consolidate.

    SPONSORED

    Trade Bitcoin with up to 100x leverage on perpetual contracts

    Trade Now on Defx

    Short-Term Correction Could Precede Major Rally

    While the overall trend remains bullish, analysts are noting the possibility of a healthy correction. On-Chain College, a prominent crypto analyst, suggests Bitcoin could see a pullback to the $95,000 support zone before continuing its upward trajectory. This aligns with recent analysis of key resistance levels around $105,000.

    Looking Ahead: Key Price Targets and Timeline

    The Realized Cap Impulse is expected to maintain its upward trajectory through October 2025, potentially driving Bitcoin toward the $125,000 level. However, Alphractal warns this could be the final major move before a prolonged bearish cycle beginning in late 2025.

    FAQ Section

    What is the Bitcoin Realized Cap Impulse?

    The Realized Cap Impulse is an on-chain metric that measures changes in Bitcoin’s total cost basis, providing insights into market participant behavior and potential price trends.

    What support levels should traders watch?

    Key support levels are converging around $95,000, with additional technical support at $105,000. These levels are crucial for maintaining the current bull market structure.

    When might the bull market end?

    According to Alphractal’s analysis, the current bull phase could extend through October 2025 before transitioning into a bearish cycle lasting approximately one year.
  • Bitcoin Warning: NVT Ratio Signals 82K Price Could Be Mirage

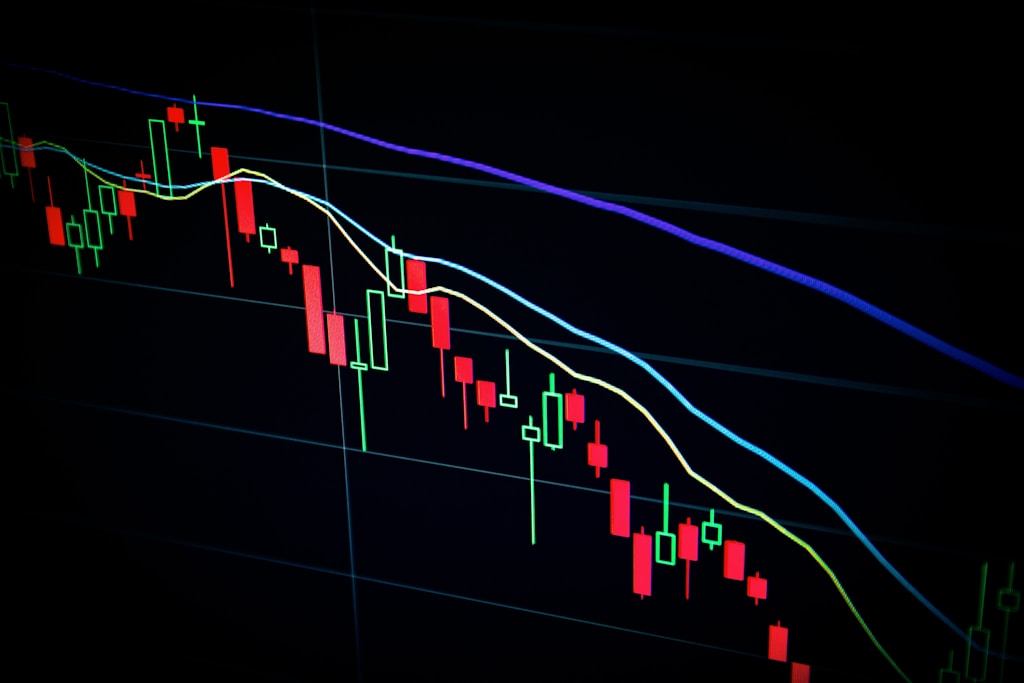
    Bitcoin’s recent price action near $90,000 appears to be losing steam, with concerning signals emerging from key on-chain metrics. The leading cryptocurrency has declined 6.4% over the past week to $82,000, prompting analysts to question whether the rally was built on solid fundamentals.

    This analysis comes as significant exchange outflows of 30,000 BTC have failed to prevent downward pressure, suggesting a potential disconnect between whale accumulation and price action.

    NVT Ratio Raises Red Flags

    CryptoQuant analyst BorisVest’s examination of the Network Value to Transactions (NVT) ratio reveals troubling divergences between Bitcoin’s market capitalization and actual network usage. The elevated NVT Golden Cross reading indicates price inflation may be driven more by speculation than organic demand.

    SPONSORED

    Trade Bitcoin with up to 100x leverage on perpetual contracts

    Trade Now on Defx

    Funding Rates Signal Bearish Sentiment

    Adding to concerns, funding rates have entered a “dead cross” pattern, with short-term rates falling below long-term averages. This technical formation historically precedes significant price corrections and suggests traders are increasingly risk-averse.

    The cautious outlook aligns with recent hedge fund predictions of a potential 40% drop, though such extreme scenarios remain speculative.

    What This Means for Traders

    Market participants should monitor several key metrics:

    • Daily transaction volumes
    • NVT ratio movements
    • Funding rate trends
    • Exchange flow dynamics

    FAQ Section

    What is the NVT Ratio?

    The Network Value to Transactions ratio measures Bitcoin’s market cap relative to its daily transaction volume, helping identify potential price bubbles.

    Why are funding rates important?

    Funding rates indicate market sentiment in perpetual futures markets, with negative rates suggesting bearish positioning.

    What could trigger a recovery?

    Increased transaction volumes, positive funding rates, and renewed institutional interest could support price recovery.

    As the market digests these signals, traders should maintain strict risk management and watch for potential consolidation or further downside in the coming weeks.