Tag: Bitcoin Price Analysis

  • Bitcoin Price Alert: Analyst Warns of 60% Crash to $49K on Volume Drop

    Bitcoin Price Alert: Analyst Warns of 60% Crash to $49K on Volume Drop

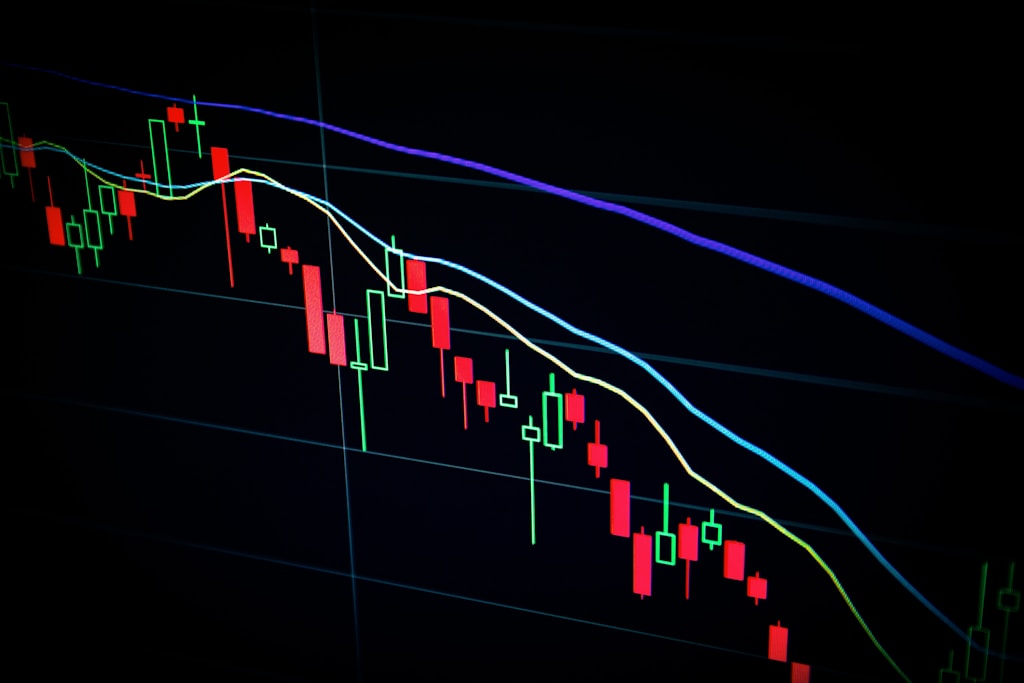
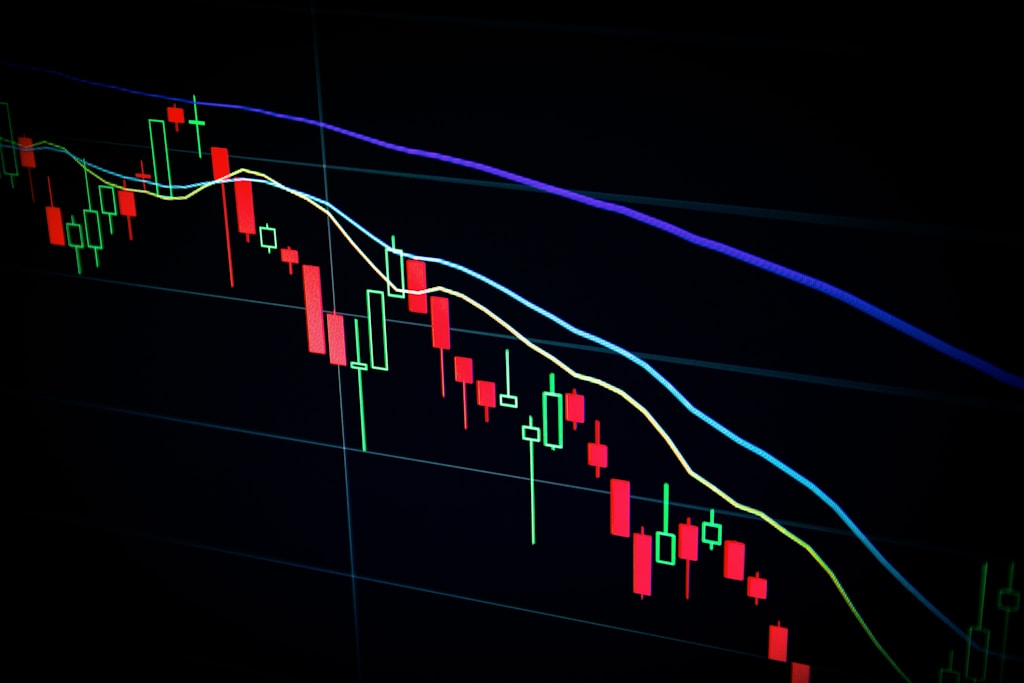
    A prominent crypto analyst has issued a stark warning about Bitcoin’s price trajectory, suggesting a potential 60% crash to $49,000 based on concerning volume metrics. This analysis comes amid broader market turbulence that has already pushed Bitcoin below key support levels.

    Critical Volume Analysis Points to Major Correction

    According to respected analyst Melika Trader’s detailed TradingView analysis, Bitcoin is precariously positioned above critical support zones. The concerning pattern emerges from volume profile data on Binance, showing dangerously low trading activity at current price levels.

    Key warning signals include:

    • Loss of crucial $83,000 support level
    • Breakdown of $75,000 trend line support
    • Minimal trading volume above $70,000
    • High-volume zone clustering near $30,000

    SPONSORED

    Trade Bitcoin with up to 100x leverage and maximize your profit potential

    Trade Now on Defx

    Silver Lining: Only 20% of Traders at Risk

    Despite the bearish outlook, Melika Trader highlights an important nuance: approximately 80% of Bitcoin holders entered positions below $35,000. This suggests most investors remain in profit even if the predicted correction materializes.

    CryptoQuant CEO Confirms Bear Market Signals

    Supporting this bearish thesis, CryptoQuant’s CEO Ki Young Ju points to concerning metrics in the Realized Cap versus Market Cap relationship. The analysis shows capital inflow failing to drive price appreciation – a classic bear market indicator.

    Key Support Levels to Watch

    Critical support levels traders should monitor:

    • $75,000 – Previous trend line support
    • $49,000 – Projected bottom target
    • $35,000 – Major accumulation zone
    • $30,000 – High-volume support region

    FAQ: Bitcoin Price Correction

    How long could this bear market last?

    According to Ki Young Ju, historical data suggests real market reversals typically require at least six months to complete.

    What’s causing the current selling pressure?

    Multiple factors contribute, including significant ETF outflows and broader market concerns over potential trade tariffs.

    Should investors be concerned?

    Long-term holders who entered below $35,000 maintain strong profit margins even with a correction to $49,000.

    At press time, Bitcoin trades at $77,000, showing a 7% decline over 24 hours. Traders should maintain strict risk management given the potential for increased volatility.
  • Bitcoin Price Set for New ATH by Q1 2026 Despite 23% Drop: Analyst

    Bitcoin’s recent 23% price correction has sparked intense debate about its long-term trajectory. As investors continue accumulating during this dip, prominent crypto analyst Miles Deutscher presents a compelling case for why current macroeconomic conditions could catalyze Bitcoin’s next all-time high.

    Understanding the Current Market Context

    Bitcoin currently trades at $83,313, showing resilience with a 0.90% weekly gain despite significant headwinds. The recent decline stems primarily from new US tariffs announced between February and April 2025, creating broader market uncertainty.

    The Macro Catalyst for Bitcoin’s Next Rally

    Deutscher outlines a series of economic events that could fuel Bitcoin’s ascent:

    • Short-term dollar weakness and lower interest rates benefiting crypto assets
    • Reduced US Treasury Bill purchases leading to liquidity tightening
    • Market bottoming as recession fears get priced in
    • Federal Reserve response with potential rate cuts and QE by 2026
    • Increased dollar liquidity through various economic tools

    Timeline to New All-Time High

    The analyst projects a new Bitcoin ATH between Q3 2025 and Q1 2026, driven by:

    • Resolution of current market uncertainty
    • Federal Reserve policy shifts
    • Improved global liquidity conditions
    • Quality altcoin recovery following Bitcoin’s lead

    SPONSORED

    Maximize your trading potential with up to 100x leverage on perpetual contracts

    Trade Now on Defx

    Market Indicators and Trading Volume

    Current market metrics show:

    • Bitcoin price: $83,313
    • Weekly performance: +0.90%
    • Daily trading volume: $14.25 billion (68.68% decrease)

    FAQ: Bitcoin’s Path to New ATH

    When could Bitcoin reach its new all-time high?

    According to Deutscher’s analysis, Bitcoin could achieve a new ATH between Q3 2025 and Q1 2026, following the expected economic policy shifts.

    What are the main catalysts for Bitcoin’s potential rally?

    Key catalysts include Federal Reserve policy changes, improved liquidity conditions, and the resolution of current market uncertainty driven by US tariffs.

    How will altcoins perform during this period?

    High-quality altcoins are expected to follow Bitcoin’s upward trajectory, while tokens with limited utility may struggle to maintain value.

  • Bitcoin Price Shows Strong Buy Signal at $81K Support Level

    Bitcoin Price Shows Strong Buy Signal at $81K Support Level

    Bitcoin’s recent price action at the critical $81,254 support level is presenting what technical analysts identify as a prime buying opportunity, with multiple indicators suggesting a potential trend reversal. Recent data shows significant capital inflows testing this key support level, reinforcing its importance as a potential springboard for future gains.

    Technical Analysis Reveals Bullish Convergence

    The cryptocurrency market’s flagship asset has demonstrated remarkable resilience after touching the $81,332 support zone. This price level has become increasingly significant as it aligns with several technical indicators suggesting a potential bottom formation:

    • RSI showing signs of bullish divergence
    • MACD displaying a positive crossover
    • Strong buying volume at support

    Key Resistance Levels and Price Targets

    Market analysts have identified critical resistance zones that Bitcoin needs to overcome for continued upward momentum:

    Resistance Level Significance
    $84,576 Immediate resistance
    $86,000 Major psychological level

    SPONSORED

    Trade Bitcoin with up to 100x leverage and maximize your profit potential

    Trade Now on Defx

    Market Sentiment and Trading Volume Analysis

    Despite recent selling pressure, analysis of trading patterns shows significant accumulation occurring at current levels. The 2.9% bounce from recent lows has injected renewed optimism into the market.

    FAQ Section

    What makes $81,254 a significant support level?

    This price point represents a confluence of technical indicators, including historical support and key Fibonacci retracement levels.

    What are the key resistance levels to watch?

    The immediate resistance zone lies between $84,576 and $86,000, with these levels representing significant technical and psychological barriers.

    What technical indicators support a bullish outlook?

    The RSI showing upward momentum and MACD’s positive crossover are primary indicators suggesting potential upside movement.

  • Bitcoin Price Target $175K by September: Analyst Reveals 231-Day Cycle

    Bitcoin Price Target $175K by September: Analyst Reveals 231-Day Cycle

    Bitcoin (BTC) could be gearing up for an explosive price rally to $175,000 by September, according to prominent analyst Egrag Crypto’s latest cycle analysis. Despite the recent correction from January’s all-time high, technical indicators suggest a major breakout could be imminent as BTC enters a critical accumulation phase.

    Understanding Bitcoin’s 231-Day Cycle Pattern

    Following Bitcoin’s recent price action, which aligns with reduced buying activity from short-term holders, Egrag Crypto has identified a compelling fractal pattern based on a 33-bar (231-day) cycle. This technical formation has historically preceded significant price rallies in Bitcoin’s market structure.

    Key cycle characteristics include:

    • Initial correction phase lasting 2-3 months
    • Accumulation period near cycle lows
    • Explosive breakout phase targeting new highs
    • Current cycle projects June breakout potential

    Critical Price Levels to Watch

    For this bullish scenario to play out, several key technical levels must hold:

    Price Level Significance
    $69,500 – $71,500 Critical support zone
    $100,000 Major psychological resistance
    $175,000 Projected cycle top target

    The current market structure shows remarkable resilience, particularly in light of recent US tariff announcements that had minimal impact on Bitcoin’s price. This demonstrates Bitcoin’s growing strength as a store of value during economic uncertainty.

    SPONSORED

    Trade Bitcoin with up to 100x leverage on perpetual contracts

    Trade Now on Defx

    Exchange Activity Signals Market Transition

    Recent data from crypto expert Ali Martinez reveals declining exchange activity, suggesting a potential trend shift as investors await the next major catalyst. Current market metrics show:

    • Trading volume: $43.48 billion (↑26.52%)
    • Market inflows: $5.16 billion (24-hour)
    • Current BTC price: $83,805

    FAQ: Bitcoin’s $175K Price Target

    When could Bitcoin reach $175,000?

    According to Egrag Crypto’s analysis, Bitcoin could potentially reach $175,000 by September 2025, following a breakout in June.

    What could invalidate this bullish scenario?

    A price drop below the $69,500-$71,500 support zone could invalidate the bullish setup and potentially signal the end of the current bull run.

    How does this align with previous Bitcoin cycles?

    The projected move follows Bitcoin’s historical 231-day cycle pattern, which has previously preceded major price rallies.

  • Bitcoin Support Level at $69K Critical for Bull Run Continuation

    Bitcoin Support Level at $69K Critical for Bull Run Continuation

    Bitcoin’s price trajectory has reached a crucial juncture, with analysts identifying $69,000 as a make-or-break support level that could determine the continuation of the current bull run. As Bitcoin continues to show remarkable resilience against broader market pressures, particularly following recent trade tariff announcements, understanding this key support level becomes essential for traders and investors.

    Bitcoin’s Current Market Position

    The flagship cryptocurrency started April with impressive momentum, reaching $87,000 on April 2, before experiencing a pullback to $84,000 by April 4. Despite this retracement, Bitcoin has demonstrated notable stability compared to both altcoins and traditional markets, suggesting underlying strength in the current market structure.

    SPONSORED

    Trade Bitcoin with up to 100x leverage and maximize your profit potential

    Trade Now on Defx

    Understanding the $69,000 Support Level

    According to CryptoQuant analyst Burak Kesmeci, the Bitcoin Spot ETF Realized Price currently stands at $69,000, representing a crucial support level. This metric measures the average acquisition price of Bitcoin across all spot ETFs since their launch in early 2024.

    Why This Level Matters

    • Historical Support: The ETF realized price has served as strong support since ETF launches
    • Institutional Interest: Represents significant institutional investment levels
    • Technical Significance: Multiple tests of this level have been successfully defended

    Short-term Holder Dynamics

    While $69,000 represents the bottom support, the short-term holder (STH) realized price at $90,570 could signal the resumption of the bull run. Recent analysis shows that short-term holder behavior will be crucial for Bitcoin’s next major move.

    Market Outlook and Trading Implications

    Current market conditions show Bitcoin trading at $83,900, with a 1% increase over 24 hours but a slight weekly decline. Traders should monitor these key levels:

    • Critical Support: $69,000
    • Current Resistance: $90,570 (STH realized price)
    • Immediate Target: $87,000 (recent high)

    FAQ Section

    What happens if Bitcoin breaks below $69,000?

    A sustained break below this level could trigger a deeper correction and potentially signal the end of the current bull cycle.

    How long could Bitcoin stay in this range?

    Historical patterns suggest consolidation periods can last 2-4 weeks before a decisive move in either direction.

    What factors could push Bitcoin above $90,570?

    Increased institutional buying, positive regulatory news, or broader market stability could catalyze a move above this resistance level.

  • Bitcoin Price Enters ‘Perfect Buy Zone’ After Trump Tariff Shock

    Bitcoin’s price has entered what analysts are calling the ‘perfect buy zone’ following a dramatic 48-hour decline triggered by Donald Trump’s sweeping tariff announcement. The leading cryptocurrency dropped to $81,332, presenting what technical analysts describe as an optimal entry point for strategic investors. Recent analysis shows this price movement could signal a bullish shift despite initial market turbulence.

    Market Analysis: Understanding the Current Bitcoin Price Action

    The recent price movement has created what technical analysts identify as a crucial support zone between $81,000 and $84,000. This zone coincides with several key technical indicators:

    • Hourly bullish structure formation
    • Key downward trendline break at $84,700
    • Previous support level at $81,000

    SPONSORED

    Trade Bitcoin with up to 100x leverage and maximize your profit potential

    Trade Now on Defx

    Critical Price Levels to Monitor

    Traders should focus on these key price zones:

    Level Type Price Range Significance
    Immediate Resistance $84,576 – $86,000 Critical breakout zone
    Current Support $81,000 – $82,500 Buy zone
    Secondary Support $78,363 – $79,500 Last defense level

    Market Impact of Trump’s Tariff Announcement

    Bitcoin has shown remarkable resilience compared to traditional markets following Trump’s announcement of tariffs on 185 countries. While the S&P 500 experienced significant pressure, Bitcoin’s quick recovery from the $81,332 low demonstrates its growing strength as a hedge against political uncertainty.

    Trading Strategy and Risk Management

    For traders looking to capitalize on the current market conditions, consider these strategic approaches:

    • Set buy orders in the $81,000-$82,500 range
    • Place stop losses below $78,363
    • Target initial profit taking at $86,000
    • Monitor volume patterns for confirmation of trend reversal

    Frequently Asked Questions

    Why is this considered an ideal buy zone for Bitcoin?

    The current price level represents a confluence of technical support levels and oversold conditions, suggesting a potential reversal point.

    What impact could Trump’s tariffs have on Bitcoin long-term?

    Historical data suggests that global trade tensions often lead to increased cryptocurrency adoption as investors seek alternative stores of value.

    How long might this buying opportunity last?

    Market indicators suggest this zone could remain viable for 24-48 hours, though rapid price movements could shorten this window.

    At press time, Bitcoin trades at $83,695, showing signs of recovery with a 2.9% bounce from recent lows. Trading volume has begun to stabilize, indicating potential accumulation at these levels.

  • Bitcoin Price Tests $78.6K Support as Trump Tariffs Fuel Market Fear

    Bitcoin (BTC) faces a critical juncture as it struggles to maintain support levels amid growing macroeconomic uncertainty. The leading cryptocurrency is currently testing key technical levels after being rejected at descending resistance, with analysts eyeing $78,600 as a potential bearish target.

    In a significant development that has rattled markets, Trump’s recent tariff announcements have triggered widespread selling pressure across crypto markets, adding another layer of complexity to Bitcoin’s technical outlook.

    Market Analysis: Key Support and Resistance Levels

    Bitcoin is currently trading at $83,500, down 25% from January’s all-time high. The asset faces several critical technical levels:

    • Immediate resistance: $85,000 (4H 200MA)
    • Key breakthrough level: $86,000 (4H EMA)
    • Critical support: $81,000
    • Bearish target: $78,600

    Trading volume has shown concerning signs of decline, typically a precursor to major price movements. While retail investors show signs of panic selling, whale addresses have been accumulating, creating an interesting dynamic in the market.

    SPONSORED

    Trade Bitcoin with up to 100x leverage and maximize your profit potential

    Trade Now on Defx

    Macro Factors Influencing Bitcoin’s Price Action

    The current market uncertainty is largely attributed to:

    • Trump’s new tariff policies affecting global markets
    • Declining trading volumes across major exchanges
    • Technical rejection at descending resistance
    • Growing institutional uncertainty

    Expert Analysis and Price Targets

    According to crypto analyst Carl Runefelt, the failure to break above descending resistance, combined with declining volume, suggests further downside potential. The $78,600 level remains a crucial target if current support fails to hold.

    FAQ Section

    Q: What is the next major support level for Bitcoin?
    A: The immediate critical support lies at $81,000, with $78,600 being the next major support level if current levels fail.

    Q: How are Trump’s tariffs affecting Bitcoin?
    A: The tariffs have increased market uncertainty and risk-off sentiment, leading to increased selling pressure across crypto assets.

    Q: What would signal a potential recovery?
    A: A decisive break above $86,000 with increasing volume would signal potential recovery momentum.

  • Bitcoin Price Eyes $150K as Short-Term Holders Show Diamond Hands

    Bitcoin (BTC) is showing renewed signs of strength, currently trading at $85,215 with a 2.2% daily gain. Despite remaining 21.2% below its January peak of $109,000, on-chain metrics suggest a potential major rally ahead.

    In a significant development that aligns with recent analysis showing strong holder conviction, short-term Bitcoin investors are displaying unprecedented resilience during the current market correction.

    Short-Term Holders Signal Market Bottom Formation

    CryptoQuant’s latest analysis reveals a dramatic shift in short-term holder behavior, potentially setting the stage for Bitcoin’s next major price movement. These investors, defined as those holding BTC for 1-3 months, are demonstrating unusual patience despite being underwater on their positions.

    Key findings from the analysis include:

    • 28% of Bitcoin’s circulating supply is currently held by short-term investors
    • Realized losses are significantly lower compared to previous correction phases
    • Selling pressure has decreased substantially, indicating potential accumulation

    SPONSORED

    Trade Bitcoin with up to 100x leverage and maximize your profit potential

    Trade Now on Defx

    On-Chain Metrics Support Bullish Outlook

    The Short-Term Holder Net Realized PNL to Exchanges metric has reached levels historically associated with market bottoms. This technical indicator, combined with recent whale accumulation patterns, suggests strong potential for upward price movement.

    Path to $150,000: Key Factors

    Several catalysts could drive Bitcoin toward the $150,000 target:

    • Conversion of short-term holders to long-term investors
    • Decreasing selling pressure on exchanges
    • Historical pattern alignment with previous bull market cycles
    • Institutional interest maintaining strong momentum

    FAQ Section

    What defines a short-term Bitcoin holder?

    Short-term holders are investors who have held their Bitcoin for 1-3 months or less.

    Why is the current holder behavior significant?

    Unlike previous market cycles, short-term holders are showing unusual resilience by not panic selling during price corrections.

    What technical indicators support the $150K target?

    The combination of reduced selling pressure, whale accumulation, and historical market cycle patterns suggests potential for significant upside movement.

    Featured image: Shutterstock

  • Bitcoin Price Eyes Q2 Rally: 2017 Pattern Signals Major Breakout

    Bitcoin Price Eyes Q2 Rally: 2017 Pattern Signals Major Breakout

    Bitcoin (BTC) appears poised for a significant Q2 rally as historical patterns from 2017 emerge, despite currently struggling to maintain the $84,000 level. Recent technical analysis suggests key support levels could determine the trajectory of this potential breakout.

    Current Market Dynamics

    Bitcoin’s recent price action has been marked by volatility, with the flagship cryptocurrency experiencing an 8.2% weekly decline to $81,278 before recovering. The crucial $84,000 resistance level continues to pose a significant challenge, having rejected multiple breakout attempts since the post-November range breakdown.

    SPONSORED

    Maximize your trading potential with up to 100x leverage on perpetual contracts

    Trade Now on Defx

    2017 Pattern Comparison

    Analyst Ted Pillows has identified striking similarities between current market conditions and Bitcoin’s behavior during Q2 2017. During that period, BTC consolidated for the first two months before initiating a dramatic rally from $1,400 to $20,000 by December 2017.

    Technical Indicators and Market Structure

    The current consolidation phase is occurring between two critical EMAs – the 21-week and 50-week moving averages. Recent NVT ratio analysis suggests caution, though historical Q2 performance data remains predominantly bullish.

    Price Targets and Support Levels

    Key levels to watch include:

    • Immediate resistance: $84,000-$85,000
    • Current support: $81,278
    • Re-accumulation target: $93,500

    FAQ Section

    Why is the Q2 comparison to 2017 significant?

    The 2017 pattern showed similar consolidation before a major breakout, leading to Bitcoin’s previous bull run.

    What are the key resistance levels to watch?

    The primary resistance zone lies between $84,000-$85,000, with secondary resistance at $88,000-$89,000.

    Could Bitcoin reach new all-time highs in 2025?

    Historical patterns and current market dynamics suggest potential for new highs, though careful risk management remains essential.

  • Bitcoin Price Surges to $83K as Institutional Buyers Show Strength

    Bitcoin’s price has demonstrated remarkable resilience, bouncing back to $83,000 after a brief dip to $81,000, driven by significant institutional buying pressure. This recovery comes as major players continue to accumulate BTC, signaling strong fundamental support for the leading cryptocurrency.

    Key Highlights of Bitcoin’s Recent Price Action

    • Weekend dip to $81,000 support level
    • Quick recovery to $83,000 within 24 hours
    • Strategy (MSTR) announces $1.92 billion BTC purchase
    • Metaplanet adds $13.3 million in Bitcoin to holdings

    As reported in recent coverage of Strategy’s massive Bitcoin acquisition, institutional interest in Bitcoin continues to grow despite short-term price volatility. This latest recovery demonstrates the market’s maturity and the increasing role of institutional capital in stabilizing price movements.

    Institutional Buying Analysis

    The recent dip presented an opportunity for institutional investors to accumulate Bitcoin at more attractive price levels. Strategy’s purchase of $1.92 billion worth of BTC represents one of the largest single acquisitions in recent months, bringing their total holdings to 528,185 BTC.

    SPONSORED

    Trade Bitcoin with up to 100x leverage and maximize your profit potential

    Trade Now on Defx

    Market Implications and Technical Outlook

    The swift recovery from $81,000 suggests strong buying pressure at key support levels. Technical indicators point to continued institutional accumulation, with several key metrics showing bullish divergence.

    FAQ Section

    Q: What caused Bitcoin’s recent price dip?
    A: The weekend dip to $81,000 was primarily driven by profit-taking and temporary market uncertainty.

    Q: How significant is the institutional buying?
    A: The combined purchases from Strategy and Metaplanet total over $1.93 billion, representing substantial institutional confidence in Bitcoin.

    Q: What are the key support levels to watch?
    A: Current technical analysis indicates strong support at $81,000, with secondary support at $78,500.

    Looking Ahead

    With institutional buying providing strong support and market sentiment remaining positive, Bitcoin’s price action suggests potential for further upside. Traders and investors should monitor institutional flow data and technical levels for additional confirmation of the bullish trend.