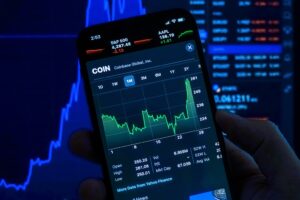
Tag: Bitcoin Price Analysis

  • Bitcoin Price Eyes 14% Jump to $100K as Key $90K Level Nears

    Bitcoin Price Eyes 14% Jump to $100K as Key $90K Level Nears

    Bitcoin (BTC) has demonstrated remarkable resilience, climbing nearly 5% over the past week and setting its sights on a potential 14% surge to the coveted $100,000 level. The leading cryptocurrency’s recent price action suggests a significant breakout could be imminent as it approaches crucial resistance zones.

    Bitcoin’s Technical Setup Shows Bullish Momentum

    After successfully reclaiming the $84,000-$85,000 range that had previously acted as resistance, Bitcoin has established a solid foundation for further upward movement. The flagship cryptocurrency has maintained steady momentum, breaking above $88,000 and showing signs of strength at current levels.

    SPONSORED

    Maximize your trading potential with up to 100x leverage on perpetual contracts

    Trade Now on Defx

    Critical Price Levels to Watch

    According to analyst Alex Clary, Bitcoin’s technical indicators are aligning favorably, with the cryptocurrency showing:

    • RSI bullish divergence
    • V-shaped recovery pattern
    • Breakout above downtrend resistance
    • Strong support at $86,000

    Weekly Close Requirements for Continued Uptrend

    Rekt Capital’s analysis highlights two critical levels that Bitcoin needs to secure:

    • $88,400 (21-week EMA)
    • $93,500 (Re-Accumulation Range Low)

    Market Correlation and External Factors

    The cryptocurrency’s correlation with traditional markets, particularly the S&P 500, continues to play a significant role in its price action. This relationship suggests broader market sentiment remains a key driver for Bitcoin’s movements.

    FAQ Section

    Q: What is the next major resistance level for Bitcoin?
    A: The $90,000 level represents the next significant resistance, with $93,500 being a crucial technical target.

    Q: What could trigger the projected 14% price increase?
    A: A successful break and hold above $90,000, combined with positive technical indicators and market sentiment, could fuel the rally to $100,000.

    Q: What are the key support levels to monitor?
    A: The primary support zones are at $86,000 and $88,400, with the latter being particularly significant as it aligns with the 21-week EMA.

    Conclusion

    As Bitcoin approaches the critical $90,000 resistance level, the technical setup suggests a potential 14% surge to $100,000 is within reach. However, traders should remain vigilant of key support levels and market correlations that could influence this projected movement.

  • Bitcoin Price Target $110K Before $76.5K: Arthur Hayes Makes Bold Call

    Former BitMEX CEO Arthur Hayes has made a striking Bitcoin price prediction that’s capturing the crypto market’s attention. In a bold forecast, Hayes projects Bitcoin will reach $110,000 before retesting lower levels around $76,500, suggesting significant upside potential in the near term.

    This analysis comes at a crucial time, as Bitcoin recently approached its previous all-time high of $108,786, with the market showing signs of consolidation between $81,000 and $89,000.

    Market Stability and Accumulation Phase

    Bitcoin’s current trading pattern reveals a period of relative stability, with decreased selling pressure and gradual accumulation by buyers. This consolidation phase typically precedes significant price movements, supporting Hayes’ bullish outlook.

    SPONSORED

    Trade Bitcoin with up to 100x leverage on perpetual contracts

    Trade Now on Defx

    Federal Reserve Policy Shift: The Catalyst for Growth

    Hayes’ prediction is largely based on anticipated changes in Federal Reserve monetary policy. The potential transition from quantitative tightening (QT) to quantitative easing (QE) could inject significant liquidity into the financial system, historically a catalyst for Bitcoin price appreciation.

    Technical Analysis and Price Targets

    Currently trading at $86,600, Bitcoin shows strong support above $80,000. Hayes suggests that once Bitcoin breaks above $110,000, it could continue climbing toward $250,000, representing a potential 188% increase from current levels.

    Market Impact and Trading Implications

    This forecast comes as institutional interest in Bitcoin continues to grow, with significant inflows into crypto investment products. Traders should monitor key resistance levels and potential catalysts that could drive prices toward Hayes’ targets.

    FAQ Section

    What factors support Hayes’ $110K Bitcoin prediction?

    Hayes cites changing Fed monetary policy, market momentum, and institutional adoption as key drivers for his bullish outlook.

    When could Bitcoin reach the $110K target?

    While Hayes doesn’t provide a specific timeline, the prediction is based on near-term market dynamics and monetary policy shifts.

    What are the key risk factors to consider?

    Potential risks include regulatory changes, macroeconomic uncertainties, and technical resistance levels around previous all-time highs.

  • Bitcoin Price Target $200K: Kiyosaki Warns of FOMO-Driven Rally

    Bitcoin Price Target $200K: Kiyosaki Warns of FOMO-Driven Rally

    Key Takeaways:

    • Robert Kiyosaki predicts Bitcoin will surpass $200,000 in 2025
    • Rich Dad Poor Dad author warns against fear-based investment paralysis
    • Analysis suggests unprecedented FOMO could drive historic price movement

    Robert Kiyosaki, the renowned author of ‘Rich Dad Poor Dad,’ has issued a striking prediction for Bitcoin’s price trajectory, forecasting that the leading cryptocurrency will surge beyond $200,000 this year. This bold projection comes as Bitcoin continues its impressive rally near $90,000, with market sentiment indicating strong bullish momentum.

    Kiyosaki, who has consistently advocated for Bitcoin as a hedge against traditional financial system instability, emphasizes that while FOMO (Fear Of Missing Out) is driving significant price appreciation, many potential investors remain paralyzed by fear, potentially missing out on historic wealth creation opportunities.

    Understanding the $200K Bitcoin Price Prediction

    The author’s latest prediction aligns with his previous bullish stance on Bitcoin, as evidenced in his earlier forecast of Bitcoin reaching $1 million by 2030. His current analysis points to several key factors:

    • Institutional adoption acceleration
    • Post-halving supply dynamics
    • Growing mainstream FOMO
    • Global economic uncertainty

    SPONSORED

    Maximize your Bitcoin trading potential with up to 100x leverage on perpetual contracts

    Trade Now on Defx

    Market Psychology: Fear vs. FOMO

    Kiyosaki’s analysis highlights a crucial psychological dynamic in the current market: while FOMO drives prices higher, many potential investors remain sidelined due to fear. This paradoxical situation could create even more explosive price action as these hesitant investors eventually enter the market.

    Expert Analysis and Market Implications

    Market analysts note that Kiyosaki’s prediction coincides with several technical indicators suggesting continued upward momentum. Recent market sentiment data and technical analysis support the possibility of extended price appreciation.

    Frequently Asked Questions

    Q: What timeframe does Kiyosaki give for Bitcoin reaching $200K?

    A: Kiyosaki expects Bitcoin to surpass $200,000 before the end of 2025.

    Q: What factors support this price prediction?

    A: Key factors include institutional adoption, post-halving effects, increasing FOMO, and global economic uncertainty.

    Q: How does this prediction compare to other expert forecasts?

    A: This prediction aligns with several institutional forecasts but represents one of the more bullish near-term targets.

    Conclusion

    As Bitcoin continues its upward trajectory, Kiyosaki’s $200,000 price prediction adds to the growing chorus of bullish forecasts from market experts. While the target may seem ambitious, the combination of technical factors and market psychology suggests significant upside potential remains in the current cycle.

  • Bitcoin Price Warning: Expert Predicts Q2 ‘Brutal Bleed’ or New ATH

    Bitcoin Price Warning: Expert Predicts Q2 ‘Brutal Bleed’ or New ATH

    Real Vision’s Chief Crypto Analyst Jamie Coutts has issued a critical warning for Bitcoin’s Q2 outlook, suggesting the leading cryptocurrency faces two potential extremes: a severe downturn or a surge to unprecedented all-time highs. This analysis comes as Bitcoin recently touched $87,000 amid significant short liquidations.

    Bitcoin’s DRS Model Signals Market Divergence

    Coutts’ newly developed Bitcoin Derivatives Risk Score (DRS) model highlights concerning parallels with previous market cycles. The analyst notes that Q1 2024’s ‘Category 5 euphoria’ resulted in a relatively modest 30% correction – a stark contrast to similar historical patterns that typically saw 50-70% declines.

    SPONSORED

    Maximize your trading potential with up to 100x leverage on perpetual contracts

    Trade Now on Defx

    Global Liquidity: The Key Catalyst

    The analysis draws particular attention to global liquidity conditions, which have experienced their longest contraction in Bitcoin’s history. As markets prepare for potential economic headwinds, Coutts suggests an inevitable liquidity injection could catalyze Bitcoin’s next major move.

    Market Implications and Price Targets

    Current market indicators place Bitcoin’s DRS in a ‘low-risk quantile,’ suggesting limited predictive power for immediate price action. However, Coutts projects potential new all-time highs by May 2024, driven by:

    • Derivatives market leverage (4x larger than spot)
    • Anticipated global liquidity expansion
    • Historical market cycle patterns

    FAQ Section

    What is the Bitcoin Derivatives Risk Score (DRS)?

    The DRS is a new metric developed by Jamie Coutts that measures market risk by analyzing derivatives market behavior and liquidity conditions.

    When could Bitcoin reach new all-time highs?

    According to Coutts’ analysis, Bitcoin could potentially reach new ATHs by May 2024 or the end of Q2.

    What are the key risk factors to watch?

    Investors should monitor global liquidity conditions, derivatives market leverage, and potential government refinancing challenges in heavily indebted economies.

    At time of publication, Bitcoin trades at $87,703, as markets await clarity on its next major move.

  • Bitcoin Selling Pressure Eases: BTC Eyes $90K Breakthrough

    Bitcoin Selling Pressure Eases: BTC Eyes $90K Breakthrough

    Bitcoin’s market dynamics are showing signs of positive shift as selling pressure significantly diminishes, potentially setting the stage for a push toward the critical $90,000 level. Recent Bitcoin ETF inflows of $744M have helped stabilize the market, suggesting growing institutional confidence.

    Market Analysis: Reduced Selling Pressure Signals Recovery

    According to CryptoQuant data, the Cumulative Net Taker Volume indicator reveals a notable decrease in aggressive selling over the past month. This technical signal, combined with Bitcoin’s resilient price action above $85,000, suggests the potential for renewed upward momentum.

    Key price levels to watch:

    • Current support: $86,000
    • Immediate resistance: $87,500
    • Critical breakthrough level: $90,000
    • Secondary support: $85,000

    Technical Indicators Point to Growing Stability

    Bitcoin’s price action around the 200-day moving average demonstrates a crucial battle between bulls and bears. Recent technical analysis suggests potential for significant upside, particularly if BTC can maintain support above $85,000.

    SPONSORED

    Maximize your trading potential with up to 100x leverage on perpetual contracts

    Trade Now on Defx

    Market Sentiment and Outlook

    While macroeconomic uncertainties persist, several factors support a potentially bullish scenario:

    • Decreased selling pressure from short-term holders
    • Growing institutional involvement through ETFs
    • Technical support at key price levels
    • Reduced market volatility

    FAQ: Bitcoin Price Action

    Q: What is causing the reduction in selling pressure?
    A: Decreased aggressive market orders and growing institutional investment through ETFs have contributed to reduced selling pressure.

    Q: What price level needs to break for confirmed bullish momentum?
    A: A sustained break above $90,000 would confirm bullish momentum and potentially trigger a broader market rally.

    Q: What are the key support levels to watch?
    A: Primary support exists at $86,000, with secondary support at $85,000. These levels are crucial for maintaining bullish momentum.

  • Bitcoin Price Stalls at $84K: Cup and Handle Pattern Signals $115K Target

    Bitcoin Price Stalls at $84K: Cup and Handle Pattern Signals $115K Target

    Bitcoin’s price action has entered a critical phase as the leading cryptocurrency consolidates around $84,000, following a technical pattern that suggests potential for significant upside. Recent analysis of Bitcoin’s bullish wedge pattern aligns with the current cup and handle formation, potentially setting up for a major move in Q2 2025.

    Bitcoin’s Technical Setup: Understanding the Cup and Handle Pattern

    According to renowned crypto analyst Ali Martinez, Bitcoin has completed a classic cup-and-handle formation with a peak near $109,000. This technical pattern typically signals continuation of the broader uptrend, with the current price action representing a crucial consolidation phase before the next potential leg up.

    Key levels to watch:

    • Current Price: $84,100
    • Immediate Resistance: $87,300
    • Pattern Target: $115,000
    • Critical Support: $81,000

    Market Context and Trading Volume Analysis

    The broader market context shows Bitcoin attempting to recover from a 29% correction since its January all-time high. Market sentiment has reached a 6-month low, creating a potential springboard for a strong recovery if key technical levels are reclaimed.

    SPONSORED

    Trade Bitcoin with up to 100x leverage on perpetual contracts

    Trade Now on Defx

    Technical Indicators and Price Targets

    The 4-hour timeframe shows critical technical confluence at $87,300, where both the 200-day MA and EMA intersect. A breakthrough above this level could trigger renewed momentum toward the psychological $90,000 barrier.

    FAQ: Bitcoin Cup and Handle Pattern

    Q: What is a cup and handle pattern?
    A: It’s a bullish continuation pattern resembling a cup with a handle, typically signaling the end of a consolidation period.

    Q: What’s the success rate of cup and handle patterns?
    A: Historical data shows approximately 65% success rate when properly formed in crypto markets.

    Q: How long does it take for the pattern to complete?
    A: Typically 7-65 weeks, with the current formation taking about 12 weeks to develop.

    Looking Ahead: Key Price Levels to Watch

    For the bullish scenario to play out, Bitcoin needs to:

    • Hold support above $84,000
    • Break through $87,300 resistance
    • Maintain momentum above $90,000
    • Target the pattern objective of $115,000

    Traders should monitor volume profiles and order book depth for confirmation of directional moves, while maintaining appropriate risk management strategies given the current market volatility.

  • Bitcoin Price Tests $85K Support: Fibonacci Levels Signal 21% Upside

    Bitcoin Price Tests $85K Support: Fibonacci Levels Signal 21% Upside

    Key Takeaways:

    • Bitcoin currently trading between $84,968 and $85,168
    • Market cap stands at $1.68 trillion with $10.64B 24-hour volume
    • Price remains 21.7% below January 2025 all-time high
    • Fibonacci retracement levels suggest potential rebound

    Bitcoin’s price action is reaching a critical juncture as the leading cryptocurrency tests crucial support at $85,000. As whale activity hits a 2025 peak, technical indicators suggest a potential rebound could be imminent if current levels hold.

    The flagship cryptocurrency has established a tight trading range between $84,968 and $85,168 over the past hour, with market participants closely monitoring key Fibonacci retracement levels for directional cues. The current price action comes as Bitcoin ETF inflows reached $166 million, providing additional support for the critical $85K level.

    Technical Analysis: Fibonacci Levels in Focus

    The current price structure shows Bitcoin trading approximately 21.7% below its all-time high recorded on January 20, 2025. Key Fibonacci retracement levels from the recent correction indicate:

    • 0.618 Fib level: $88,450 (immediate resistance)
    • 0.786 Fib level: $92,300 (secondary resistance)
    • 0.382 Fib level: $83,600 (key support)

    Market Statistics

    Metric Value
    Market Capitalization $1.68 trillion
    24h Trading Volume $10.64 billion
    Intraday Range $83,682 – $85,233

    SPONSORED

    Trade Bitcoin with precision using advanced charting and up to 100x leverage

    Trade Now on Defx

    Frequently Asked Questions

    Q: What is the significance of the $85K support level?
    A: The $85K level represents a key psychological and technical support zone, coinciding with significant ETF inflow activity and whale accumulation patterns.

    Q: What could trigger a potential rebound?
    A: A combination of sustained ETF inflows, positive technical indicators, and strong institutional buying could catalyze an upward movement.

    Q: What are the key resistance levels to watch?
    A: Primary resistance levels are established at $88,450 and $92,300, based on Fibonacci retracement analysis.

  • Bitcoin Price Warning: Two Black Swan Events Could Trigger $50K Drop

    Bitcoin Price Warning: Two Black Swan Events Could Trigger $50K Drop

    Bitcoin’s recent stabilization above $80,000 has sparked intense debate among analysts, with market expert Doctor Profit identifying two potential black swan scenarios that could significantly impact BTC’s price trajectory. Recent market data showing a 35% crash in Bitcoin open interest to $37B adds weight to these bearish concerns.

    Understanding the M2 Money Supply Impact

    Doctor Profit’s analysis centers on the crucial relationship between Bitcoin’s price and M2 money supply dynamics. Unlike traditional markets, which typically show a 6-month lag in response to M2 changes, Bitcoin exhibits more immediate reactions to liquidity shifts.

    SPONSORED

    Trade Bitcoin with up to 100x leverage and maximize your profit potential

    Trade Now on Defx

    Two Critical Bearish Scenarios

    The analysis outlines two potential bearish scenarios:

    • Scenario 1: A controlled decline to the $70,000-$74,000 range
    • Scenario 2: A severe black swan event pushing prices toward $50,000

    Technical Analysis and Price Targets

    The weekly EMA50, dubbed the ‘Golden Line,’ has proven crucial in recent price action. While some analysts maintain bullish targets above $100K, Doctor Profit suggests preparing for potential downside risks.

    Market Outlook and Trading Strategy

    Despite short-term bearish scenarios, the long-term outlook remains constructive, with potential price targets between $120,000-$140,000 by mid-2024. Current market conditions suggest:

    • Support level: $80,000
    • Critical resistance: $87,400
    • Key accumulation zone: $70,000-$74,000

    FAQ Section

    What could trigger a Bitcoin black swan event?

    Potential triggers include regulatory crackdowns, major exchange failures, or significant macroeconomic shocks.

    How low could Bitcoin go in a worst-case scenario?

    According to Doctor Profit’s analysis, a severe black swan event could push prices toward the $50,000 region.

    When might the bull market resume?

    The analysis suggests a potential resumption of bullish momentum around May or June 2024.

    At time of writing, BTC trades at $84,000, showing 3.5% and 12% losses over 14-day and 30-day periods respectively.

  • Bitcoin Price Target $128K After MicroStrategy’s $711M BTC Buy

    Bitcoin Price Target $128K After MicroStrategy’s $711M BTC Buy

    MicroStrategy’s latest $711M Bitcoin purchase signals a major shift in institutional sentiment, potentially setting up BTC for a significant rally. Recent technical analysis suggests Bitcoin could surge 64% to $128K, and this massive institutional buy adds fundamental support to that thesis.

    MicroStrategy’s Strategic Bitcoin Accumulation

    Michael Saylor’s software company announced plans to raise $711M through an upsized STRF perpetual offering, specifically earmarked for Bitcoin purchases. This move comes as Bitcoin’s hot supply has crashed 50%, creating a potential supply squeeze scenario.

    Market Impact Analysis

    The timing of this purchase is particularly significant for several reasons:

    • Current BTC price: $84,000
    • Total MicroStrategy Bitcoin holdings post-purchase: Will exceed 205,000 BTC
    • Average institutional entry point in 2024: $71,000

    SPONSORED

    Trade Bitcoin with up to 100x leverage and maximize your profit potential

    Trade Now on Defx

    Alternative Investment Opportunities

    For investors seeking exposure to Bitcoin’s upside without directly purchasing BTC at current prices, several emerging projects offer interesting alternatives:

    1. BTC Bull Token ($BTCBULL)

    A new tokenized Bitcoin exposure product offering automated rewards based on BTC price milestones. Currently in presale at $0.002425.

    2. Meme Index ($MEMEX)

    A diversified approach to capturing crypto market momentum through curated meme coin exposure. Presale price: $0.0166883.

    3. Bitcoin Minetrix ($BTCMTX)

    Innovative stake-to-mine platform allowing retail investors to participate in Bitcoin mining without hardware investment. Current token price: $0.0148.

    Expert Analysis

    Market analysts suggest MicroStrategy’s move could trigger a cascade of institutional buying, particularly as Bitcoin ETF inflows continue to surge.

    FAQs

    What does MicroStrategy’s purchase mean for Bitcoin’s price?

    The $711M buy indicates strong institutional confidence and could reduce available supply, potentially driving prices higher.

    Is Bitcoin still a good investment at $84K?

    While price points are high, institutional buying and supply dynamics suggest continued upside potential.

    How can retail investors participate in the Bitcoin rally?

    Options include direct BTC purchases, Bitcoin ETFs, or alternative projects like $BTCBULL, $MEMEX, and $BTCMTX.

    Time to read: 5 minutes

  • Bitcoin Price Target $112K: Key $94K Level Could Trigger Rally

    Bitcoin’s path to a potential $112,000 price target has emerged, with crypto analyst Ali Martinez identifying a crucial technical threshold that could trigger the next major rally. This analysis comes as Bitcoin continues testing critical support levels in March 2025.

    Critical Price Levels for Bitcoin’s Next Move

    Using Market Value to Realized Value (MVRV) Extreme Deviation Pricing Bands analysis, Martinez has outlined two pivotal price points that could determine Bitcoin’s trajectory. The primary threshold sits at $94,000 – a breakthrough above this level could catalyze a surge toward $112,000. Conversely, a drop below $76,000 might trigger a decline to $58,000 or potentially $44,000 in bearish conditions.

    SPONSORED

    Trade Bitcoin with up to 100x leverage and maximize your profit potential

    Trade Now on Defx

    Understanding MVRV Bands and Current Market Position

    MVRV Extreme Deviation Pricing Bands serve as a vital tool for identifying potential market tops and bottoms. Currently, Bitcoin trades between the mean (yellow band) and +0.5 standard deviation (orange band), suggesting a critical juncture for price action.

    Short Squeeze Potential and Market Sentiment

    Adding another dimension to the bullish case, crypto trader Merlijn The Trader has identified approximately $2 billion in short positions that could face liquidation if Bitcoin reaches $87,000. This potential short squeeze scenario aligns with recent shifts in market sentiment and declining open interest.

    Expert Analysis and Support Levels

    Rekt Capital emphasizes the importance of the $84,000 support level, noting that a daily close above this threshold is crucial for maintaining bullish momentum. Meanwhile, Arthur Hayes suggests that the recent drop to $77,000 may have marked this cycle’s bottom.

    FAQ Section

    What is the key price level Bitcoin needs to break?

    Bitcoin needs to break and hold above $94,000 to potentially reach the $112,000 target.

    What happens if Bitcoin falls below support?

    A drop below $76,000 could trigger a decline to $58,000 or potentially $44,000 in bearish conditions.

    How significant is the potential short squeeze?

    Approximately $2 billion in short positions could face liquidation if Bitcoin reaches $87,000, potentially accelerating price movement.