
Bitcoin Treasury Companies Face Test as Max Keiser Questions Strategy Clones
Bitcoin maximalist Max Keiser has raised serious concerns about the surge in Bitcoin treasury companies, questioning whether these new entrants...
Bitcoin maximalist Max Keiser has raised serious concerns about the surge in Bitcoin treasury companies, questioning whether these new entrants...
In a groundbreaking development for Bitcoin adoption, Michael Saylor, co-founder of Strategy, suggests the Bank of England (BoE) may soon...
Time to Read: 8 minutes Amboss Technologies has unveiled Rails, a groundbreaking self-custodial Bitcoin service that enables users to earn...

In a remarkable display of crypto community support, Ross Ulbricht, the recently freed Silk Road founder, has received a substantial...
In a decisive move that signals continued institutional caution toward cryptocurrency, Meta Platforms' shareholders overwhelmingly rejected a proposal to explore...

Panama is making bold strides toward widespread Bitcoin adoption, with major announcements from Panama City's mayor Mayer Mizrachi at the...
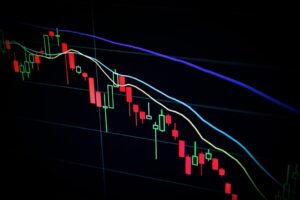
Bitcoin's recent price action has triggered warnings from analysts after falling 4.36% from its new all-time high of $111,970. The...

Bitcoin continues to demonstrate resilience above the psychological $100,000 mark, currently trading at $103,700 despite recent market turbulence. Recent on-chain...
Key Takeaways: Robert Kiyosaki predicts even small Bitcoin holdings could generate significant wealth Rich Dad Poor Dad author warns of...
Bitcoin's market dominance has reached a critical threshold of 64%, potentially signaling an imminent altcoin season as technical indicators suggest...


