Tag: Bitcoin

  • Bitcoin Price Target $150K: Bull Flag Pattern Signals Major Breakout

    Bitcoin Price Target $150K: Bull Flag Pattern Signals Major Breakout

    Bitcoin’s price trajectory is showing strong bullish signals, with a prominent technical analyst identifying a pattern that could propel BTC to $150,000. This analysis comes as Bitcoin network activity reaches new 2025 highs, suggesting growing market momentum despite recent price fluctuations.

    Key Technical Analysis Points to Major Bitcoin Rally

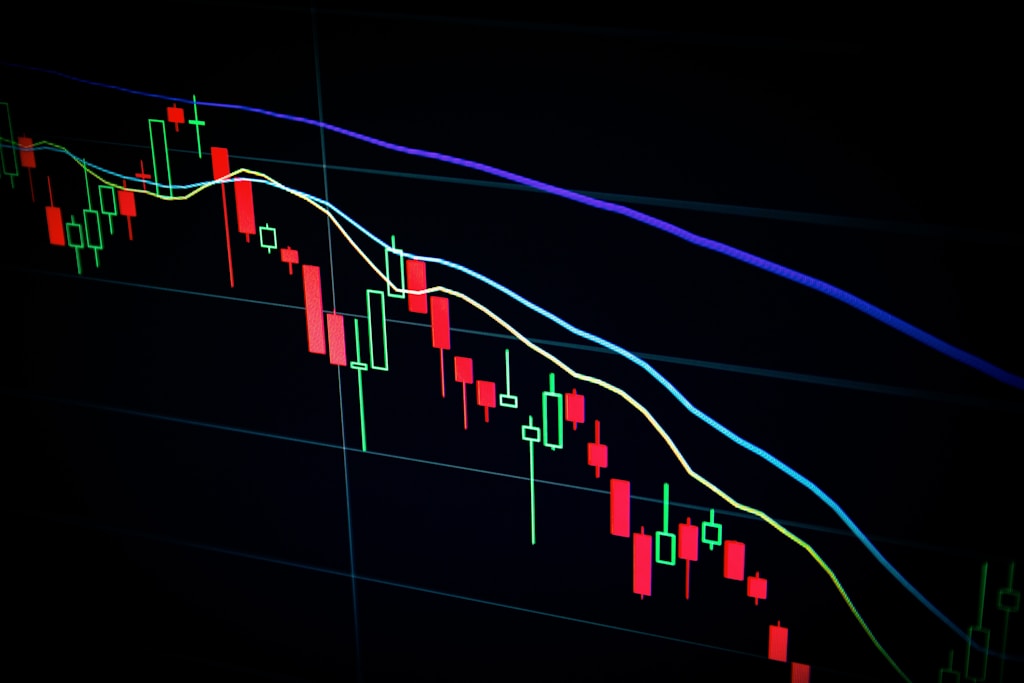
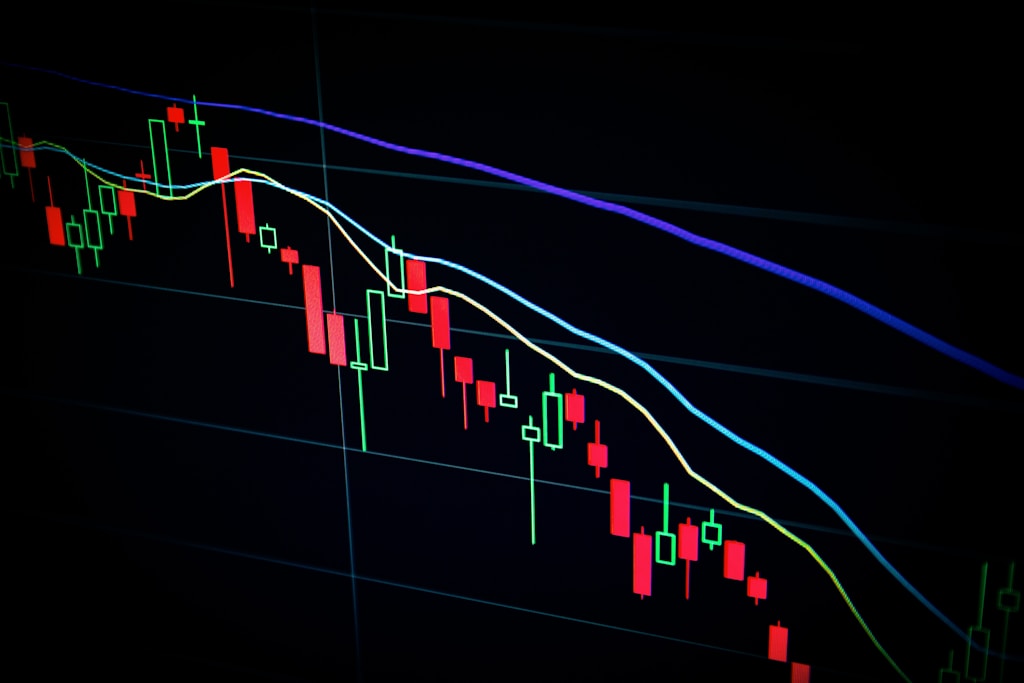
    Chartered Market Technician Tony Severino has identified a compelling bull flag pattern on Bitcoin’s daily chart, suggesting significant upside potential. The pattern, characterized by a strong upward movement followed by consolidation, typically precedes substantial price increases in trending markets.

    SPONSORED

    Maximize your Bitcoin trading potential with up to 100x leverage on perpetual contracts

    Trade Now on Defx

    Technical Indicators Supporting the Bullish Case

    Several key technical indicators are aligning to support this bullish outlook:

    • Bull flag pattern formation on the daily timeframe
    • Bollinger Bands squeeze indicating potential volatility expansion
    • Price holding above critical $105,000 support level
    • Failure to reach lower Bollinger Band suggesting potential ‘head fake’

    Critical Price Levels to Watch

    Traders should monitor these key price levels:

    • Immediate resistance: $111,000
    • Critical support: $101,000
    • Target projection: $150,000

    Market Context and Volume Analysis

    This technical setup gains additional credibility when viewed alongside recent whale accumulation patterns at $104,000, suggesting strong institutional interest at current price levels.

    FAQ Section

    What is a bull flag pattern?

    A bull flag is a technical chart pattern showing a strong upward trend followed by a consolidation period, typically leading to another strong move higher.

    How reliable are these price predictions?

    While technical analysis provides valuable insights, markets can be unpredictable. Always conduct thorough research and manage risk appropriately.

    What could invalidate this bullish scenario?

    A daily close below $101,000 could invalidate the bull flag pattern and suggest a potential trend reversal.
  • Bitcoin Price Forms Cup and Handle Pattern: $120K Target in Sight

    Reading Time: 8 minutes

    Bitcoin’s price action is showing a highly bullish technical formation as the leading cryptocurrency consolidates near $105,000, with the emergence of a cup and handle pattern suggesting significant upside potential. Following similar patterns from the 2024 rally, technical analysts are eyeing a potential surge to $120,000.

    Current Market Status

    As of 8:00 AM Eastern Time:

    • Current Trading Range: $104,881 – $105,266
    • Market Capitalization: $2.08 trillion
    • 24-hour Trading Volume: $24.93 billion
    • 24-hour Range: $103,655 – $105,213

    Technical Analysis: Cup and Handle Formation

    The cup and handle pattern, a bullish continuation pattern, has formed on Bitcoin’s daily chart. This technical formation consists of:

    • A rounded bottom ‘cup’ formation
    • A smaller ‘handle’ consolidation phase
    • Typically signals continuation of the previous uptrend

    SPONSORED

    Trade Bitcoin with up to 100x leverage on perpetual contracts

    Trade Now on Defx

    Market Implications

    The formation of this pattern coincides with several other bullish indicators:

    • Strong institutional buying pressure
    • Decreasing exchange reserves
    • Positive funding rates on major exchanges

    Expert Analysis

    Technical analysts suggest the cup and handle pattern could propel Bitcoin toward the $120,000 level, representing a potential 15% surge from current levels. This aligns with recent whale accumulation patterns at the $104,000 level.

    FAQ Section

    What is a cup and handle pattern?

    A cup and handle is a technical chart pattern resembling a cup with a handle, typically indicating a bullish continuation pattern in uptrends.

    What is the predicted price target?

    Based on the current pattern, technical analysts project a potential move to $120,000, measuring from the pattern’s breakout point.

    How reliable is this pattern?

    Cup and handle patterns have historically shown around 65% reliability in crypto markets, particularly during bull market conditions.

    Risk Considerations

    Investors should note potential risks:

    • Pattern invalidation below $103,000
    • General market volatility
    • Macro economic factors

    Conclusion

    The emergence of this cup and handle pattern, combined with strong market fundamentals and institutional interest, suggests Bitcoin could be preparing for its next major move. Traders should monitor key support levels and volume patterns for confirmation of the pattern’s validity.

  • Bitcoin Price Eyes $120K as Trump Pushes Fed Rate Cut Agenda

    Bitcoin’s recent surge to $112K and subsequent market movements have caught the attention of former President Trump, who is now actively pushing for Federal Reserve rate cuts that could further fuel crypto market growth. Recent market volatility triggered by Trump-related events demonstrates his ongoing influence on crypto markets.

    Market Impact of Trump’s Fed Rate Cut Push

    Trump’s recent Truth Social post criticizing the Federal Reserve’s delayed rate cuts has sparked renewed interest in crypto markets. The former president highlighted that Europe has implemented 10 rate cuts while the US continues to maintain higher rates, potentially affecting economic competitiveness.

    SPONSORED

    Trade Bitcoin with up to 100x leverage on perpetual contracts

    Trade Now on Defx

    Rate Cut Timeline and Bitcoin Price Implications

    According to CME Group data, while the June 18 Fed meeting is expected to maintain current rates (4.25%-4.50%), over 51% of market participants anticipate a rate cut by mid-September. Technical analysts are already predicting a push toward $120K, which could accelerate with favorable Fed policy.

    Top Altcoins Positioned for Growth

    • BTC Bull Token ($BTCBULL): Offering Bitcoin airdrops at $150K and $200K price milestones
    • Solaxy ($SOLX): Solana’s first Layer-2 solution with $45M raised
    • PepeCoin ($PEP): Showing strong momentum with 28% monthly gains

    Expert Analysis

    “When further rate cuts come sooner than expected, that will impact heavily on crypto prices, particularly Bitcoin and select altcoins.” – Carlo Pruscino, CMC Markets

    FAQ Section

    When is the next Federal Reserve rate decision?

    The next Fed meeting is scheduled for June 18, 2025.

    What is the current Fed interest rate?

    The current rate stands at 4.25%-4.50%.

    How do rate cuts affect Bitcoin price?

    Rate cuts typically increase investment in risk assets like Bitcoin due to lower borrowing costs and reduced yields in traditional investments.

    Disclaimer: This article is not financial advice. Always conduct thorough research before making investment decisions.

  • Bitcoin Whales Accumulate at $104K While Retail Traders Stay Cautious

    Bitcoin Whales Accumulate at $104K While Retail Traders Stay Cautious

    Bitcoin’s recent pullback from its $112,000 all-time high has created a notable divergence between institutional and retail investors, with on-chain data suggesting major players are actively accumulating while smaller traders remain hesitant. This behavioral pattern often precedes significant price movements, making the current market dynamics particularly noteworthy for investors.

    The cryptocurrency market has shown increased volatility following recent market turbulence that triggered nearly $1 billion in liquidations. However, large-scale investors appear unfazed by the short-term price action.

    Whale vs. Retail Divergence Signals Potential Trend Shift

    According to fresh data from Alphractal, the Whale vs. Retail Ratio has begun trending upward, indicating increased risk appetite among institutional players. This metric has historically served as a leading indicator for major price movements, with previous divergences often preceding sustained rallies.

    SPONSORED

    Trade Bitcoin with up to 100x leverage on perpetual contracts

    Trade Now on Defx

    Technical Analysis Points to Critical Support Levels

    BTC currently trades at $104,341, maintaining position above several key technical levels:

    • 34-day EMA: $103,256
    • Critical support: $103,600
    • 50-day SMA: $101,026
    • Major resistance zone: $108,000-$109,000

    Macro Factors Influence Market Sentiment

    The current market structure is developing against a backdrop of significant macro factors:

    • Rising U.S. bond yields
    • Persistent inflation concerns
    • Increasing geopolitical tensions
    • Growing institutional interest in crypto as a hedge

    Frequently Asked Questions

    What does the Whale vs. Retail Ratio indicate?

    This metric measures the positioning of large investors compared to retail traders, with rising values suggesting institutional accumulation.

    Why is the $103,600 level significant?

    This price point represents a crucial support level that has historically acted as a pivot for price action.

    What could trigger the next major move in Bitcoin?

    A combination of sustained whale accumulation, favorable macro conditions, and a break above the $109,300 resistance could catalyze the next significant rally.

    As the market continues to evolve, the growing divergence between whale and retail behavior could prove to be a pivotal indicator for Bitcoin’s next major move. Traders should closely monitor these patterns while maintaining appropriate risk management strategies.

  • Bitcoin Eyes $120K: Analysts See Pattern Repeat from 2024 Rally

    Bitcoin Eyes $120K: Analysts See Pattern Repeat from 2024 Rally

    Bitcoin (BTC) appears to be following a familiar pattern that could propel its price to $120,000, according to multiple analysts tracking the cryptocurrency’s recent price action. Despite hitting a one-month low near $100,000 amid the recent Trump-Musk feud that triggered nearly $1 billion in liquidations, technical indicators suggest BTC is preparing for its next major breakout.

    Historical Pattern Points to Major Breakout

    Crypto trader Coinvo has identified striking similarities between Bitcoin’s current price action and its movement during the 2024 rally. The analysis shows BTC following a predictable pattern of consolidation followed by significant upward momentum, much like the period preceding its Q1 2024 all-time high.

    SPONSORED

    Trade Bitcoin with up to 100x leverage on perpetual contracts

    Trade Now on Defx

    Key Technical Levels to Watch

    The Cryptonomist has identified a bullish falling wedge formation developing over the past three weeks, with critical support at $101,000. A successful breakout above $105,000 could trigger a rally toward the $118,000-$120,000 range.

    Market Structure Analysis

    According to analyst Alex Clay, Bitcoin’s recent price action suggests accumulation below the “Broken Supply Zone,” setting up for what could be the “real breakout” toward $120,000. This analysis gains further credibility when considering major institutional buying pressure from players like Metaplanet.

    Short-term Outlook

    Market watcher Daan Crypto Trades suggests Bitcoin could range between current levels for the next two weeks, with $106,700 serving as a crucial resistance level. A break above this mark could signal the end of the current correction phase and the start of a new rally toward all-time highs.

    FAQ Section

    Q: What is the key resistance level Bitcoin needs to break?
    A: The critical resistance level is $106,700, with $105,000 serving as an initial hurdle.

    Q: How long might the current consolidation last?
    A: Analysts suggest a 2-week ranging period before the next significant move.

    Q: What’s the potential upside target if Bitcoin breaks out?
    A: The immediate target range is $118,000-$120,000 based on current technical analysis.

    As of this writing, Bitcoin trades at $104,224, showing a 2.6% increase over the past 24 hours.

  • Bitcoin Liquidations Hit $970M as Trump-Musk Feud Rocks Market

    Bitcoin Liquidations Hit $970M as Trump-Musk Feud Rocks Market

    The cryptocurrency market witnessed a massive $970 million liquidation cascade as an unexpected feud between former President Donald Trump and Tesla CEO Elon Musk triggered significant Bitcoin price volatility. This market turmoil has particularly impacted leveraged traders, with long positions bearing the brunt of the selloff.

    Market Impact: Bitcoin Price Swings and Mass Liquidations

    Bitcoin experienced dramatic price swings in the past 24 hours, dropping from $105,800 to $100,400 before partially recovering to $104,100. While BTC’s losses were contained to under 2%, other cryptocurrencies faced steeper declines, with Ethereum falling nearly 6% and Dogecoin dropping 7%.

    SPONSORED

    Trade with up to 100x leverage on perpetual contracts

    Trade Now on Defx

    Understanding the Trump-Musk Catalyst

    The market turbulence originated from a public spat between Trump and Musk regarding the One Big Beautiful Bill Act. The confrontation escalated when Musk made controversial allegations about Trump’s connection to the Epstein files, leading to increased market uncertainty.

    Liquidation Analysis: Long Positions Hit Hardest

    According to CoinGlass data, long positions accounted for 88% ($854 million) of total liquidations. Bitcoin led the liquidations with $346 million, followed by Ethereum at $286 million.

    Market Outlook and Trading Implications

    This significant long squeeze event signals potential market repositioning, with traders now closely monitoring key support levels. Bitcoin’s $100,000 support level remains crucial for maintaining market stability.

    FAQ Section

    What caused the recent crypto market liquidations?

    The liquidations were triggered by market volatility following a public dispute between Donald Trump and Elon Musk, leading to rapid price movements in Bitcoin and other cryptocurrencies.

    How much was liquidated in the crypto market?

    Total liquidations reached $970 million, with $854 million (88%) coming from long positions.

    Which cryptocurrencies were most affected?

    Bitcoin ($346M) and Ethereum ($286M) saw the largest liquidation volumes, while Dogecoin experienced a 7% price decline.

  • Bitcoin Miners Trigger $100K Support Test: Hash Ribbon Signals Buy Zone

    Bitcoin Miners Trigger $100K Support Test: Hash Ribbon Signals Buy Zone

    Bitcoin has demonstrated resilience after a sharp correction to the $100,000 level, with on-chain metrics revealing increasing miner activity that could shape price action in the coming weeks. The recent market turbulence triggered by Trump-Musk tensions appears to be stabilizing as BTC recovers to $104,891.

    Record Miner Exchange Inflows Signal Potential Volatility

    According to CryptoQuant data, Bitcoin miners have transferred unprecedented amounts of BTC to exchanges, with daily inflows exceeding $1 billion between May 19-28. This surge in miner-to-exchange transfers has historically preceded significant price movements, as miners represent key liquidity providers in the ecosystem.

    Key metrics to watch:

    • Daily miner inflows: Over $1 billion (all-time high)
    • Current BTC price: $104,891
    • 24-hour recovery: +4.89%

    Hash Ribbon Buy Signal Emerges Amid Miner Capitulation

    While increased miner selling activity might suggest near-term pressure, the Hash Ribbon indicator has flashed a historically significant buy signal. This technical metric, which analyzes the relationship between 30-day and 60-day moving averages of network hashrate, suggests miners may be entering a recovery phase after recent stress.

    SPONSORED

    Trade Bitcoin with up to 100x leverage on perpetual contracts

    Trade Now on Defx

    Market Impact and Trading Implications

    Historical data suggests that Hash Ribbon buy signals have marked profitable entry points, with previous instances leading to significant rallies. However, traders should note that current market conditions present unique challenges, particularly given the recent high-profile market turbulence.

    Frequently Asked Questions

    What does increased miner selling mean for Bitcoin price?

    While miner selling can create short-term pressure, it often leads to healthier market conditions by transferring BTC to stronger hands and reducing future selling pressure.

    How reliable is the Hash Ribbon indicator?

    The Hash Ribbon has historically been accurate in identifying major buying opportunities, though past performance doesn’t guarantee future results.

    What levels should traders watch?

    Key support remains at $100,000, while resistance sits at $108,000. The Hash Ribbon signal suggests accumulation may be favorable at current levels.

  • Bitcoin MVRV Bearish Cross Signals Potential $105K Support Test

    The Bitcoin market is showing concerning signals as a key on-chain metric forms a bearish pattern. The Market Value to Realized Value (MVRV) ratio has crossed below its 200-day simple moving average (SMA), potentially foreshadowing significant downside risk for BTC, which currently trades near $105,000.

    Key MVRV Ratio Insights

    According to respected crypto analyst Ali Martinez, Bitcoin’s MVRV ratio has formed a bearish cross by dropping below its 200-day SMA. This technical development mirrors a similar pattern from February 2025, which preceded a notable price decline.

    This bearish signal comes amid broader market uncertainty, as recent market turbulence has pushed Bitcoin closer to critical support levels.

    Understanding MVRV Dynamics

    The MVRV ratio compares two crucial Bitcoin metrics:

    • Market Value: The current total market capitalization based on spot price
    • Realized Value: The aggregate value of all BTC based on their last on-chain movement

    When MVRV crosses below its 200-day moving average, it often indicates:

    • Decreasing profit margins for current holders
    • Potential shift in market sentiment
    • Higher risk of continued downward pressure

    SPONSORED

    Trade Bitcoin with up to 100x leverage on perpetual contracts

    Trade Now on Defx

    Market Implications

    The current MVRV bearish cross gains additional significance considering Bitcoin’s recent price action. Recent data shows increased selling pressure from miners, which could amplify the bearish signal’s impact.

    Technical Outlook

    Key levels to watch:

    • Current Price: $105,000
    • Critical Support: $100,000
    • Weekly RSI: Showing potential divergence
    • Volume Profile: Declining buy-side pressure

    FAQ

    What does the MVRV ratio tell us about Bitcoin?
    The MVRV ratio indicates the average profit/loss of all Bitcoin holders based on the price when they acquired their coins versus current market value.

    How reliable is the MVRV bearish cross as a signal?
    Historical data shows the MVRV bearish cross has preceded significant corrections, though past performance doesn’t guarantee future results.

    What are the key support levels to watch?
    The psychological $100,000 level represents crucial support, with secondary support at the 200-day moving average near $95,000.

    Conclusion

    While the MVRV bearish cross raises legitimate concerns, investors should consider multiple indicators and maintain appropriate risk management strategies. The coming weeks will be crucial in determining whether this signal leads to a significant correction or proves to be a temporary deviation.

  • Bitcoin Price Target $180K: Historical Halving Data Signals Major Rally

    Bitcoin Price Target $180K: Historical Halving Data Signals Major Rally

    Bitcoin’s recent dip to $103,450 has sparked intense market speculation, with analyst Klarch presenting compelling evidence for a potential surge to $180,000 based on historical halving cycles. As Bitcoin maintains strong support above $100,000, this temporary pullback could set the stage for the next major rally.

    Bitcoin’s Post-Halving Pattern Points to Massive Upside

    A detailed analysis of Bitcoin’s post-halving performance reveals a consistent pattern of exponential growth. Historical data shows:

    • 2016 Halving: 280% growth within 365 days
    • 2020 Halving: 550% surge in 367 days
    • 2024 Halving: Currently only 70% growth after 416 days

    This comparative analysis suggests Bitcoin is significantly undervalued compared to previous cycles, with substantial room for growth ahead.

    SPONSORED

    Trade Bitcoin with up to 100x leverage and maximize your profit potential

    Trade Now on Defx

    Institutional Demand Driving Scarcity

    The current market dynamics show striking similarities to major institutional accumulation patterns, with several key factors supporting the bullish thesis:

    • Spot ETF inflows creating sustained buying pressure
    • Reduced exchange supply due to institutional holdings
    • Strategic accumulation by major players like Michael Saylor’s Strategy

    Technical Indicators Support Bullish Outlook

    Recent price action shows Bitcoin establishing strong support levels:

    • January 20, 2025: New ATH at $112,100
    • May 22, 2025: Secondary peak at $111,980
    • Current consolidation above $103,000 suggesting healthy market structure

    FAQ: Bitcoin’s Path to $180,000

    Q: What timeframe is projected for reaching $180,000?
    A: Based on historical halving cycles, this target could be reached by late 2025.

    Q: What are the main risks to this prediction?
    A: Key risks include potential ETF outflows, regulatory changes, or broader market instability.

    Q: How does this compare to other price predictions?
    A: VanEck’s similar target adds credibility to the $180,000 projection.

    Conclusion: Multiple Catalysts Align

    With institutional demand growing, halving cycles progressing, and technical indicators aligning, Bitcoin’s path to $180,000 appears increasingly probable. However, investors should maintain awareness of market risks and practice appropriate position sizing.

  • Bitcoin Miners Trigger $100K Support Test: Record Exchange Transfers

    Bitcoin Miners Trigger $100K Support Test: Record Exchange Transfers

    Bitcoin’s recent price stability above $100,000 faces a significant test as miners transfer unprecedented amounts of BTC to exchanges, potentially signaling increased selling pressure. Despite maintaining crucial $100K support for 30 days, on-chain metrics suggest mounting bearish pressure.

    Record-Breaking Miner Activity Threatens Bitcoin Price

    According to CryptoQuant data, Bitcoin miners are transferring coins to exchanges at historic rates, with daily inflows exceeding $1 billion between May 19-28, 2025. This surge in miner-to-exchange transfers could significantly impact market dynamics, potentially pushing BTC below the psychological $100,000 level.

    SPONSORED

    Trade Bitcoin with up to 100x leverage and maximize your profit potential

    Trade Now on Defx

    Technical Indicators Flash Warning Signs

    The Bitcoin Market Value to Realized Value (MVRV) ratio has dipped below its 200-day SMA, historically a reliable indicator of potential price corrections. This technical development, combined with recent market turbulence following the Trump-Musk dispute, suggests increased downside risk.

    Market Impact and Price Projections

    Several prominent analysts, including Anup Ziddi, project potential price drops to the $96,000 range if BTC fails to maintain support above $107,000. However, whale accumulation patterns indicate strong buying interest at lower levels, potentially limiting downside risk.

    FAQ Section

    What does increased miner-to-exchange transfer mean?

    When miners transfer large amounts of Bitcoin to exchanges, it often indicates an intention to sell, which can increase supply and potentially lower prices.

    How low could Bitcoin price go?

    Technical analysts suggest support levels around $96,000, though strong whale accumulation may prevent deeper corrections.

    What are the bullish factors to consider?

    New Bitcoin whales are actively accumulating, which could create a supply squeeze effect and potentially support prices in the medium term.