Tag: Btc Price

  • Bitcoin Taker Buy Volume Hits 100M BTC – Price Surge Imminent?

    Bitcoin Taker Buy Volume Hits 100M BTC – Price Surge Imminent?

    Bitcoin’s market dynamics are showing significant bullish signals as the Taker Buy Volume reaches a critical milestone amid recent macroeconomic tensions. Bitcoin’s resilience as a hedge against market uncertainty is being tested once again as new trade tariffs shake traditional markets.

    Bitcoin Price Holds Strong Despite Market Turbulence

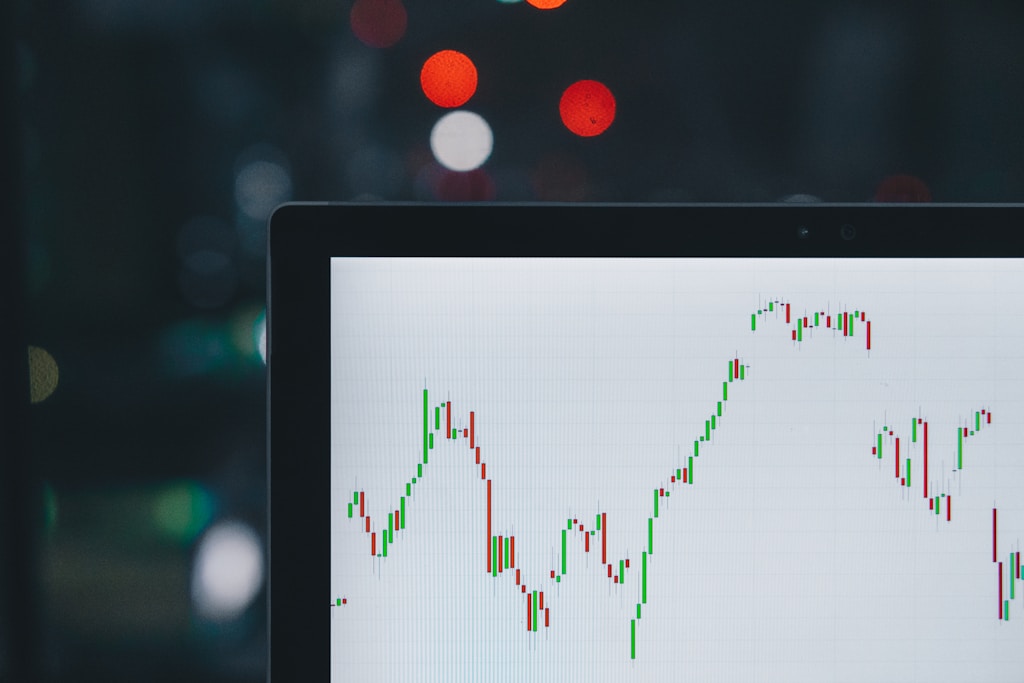
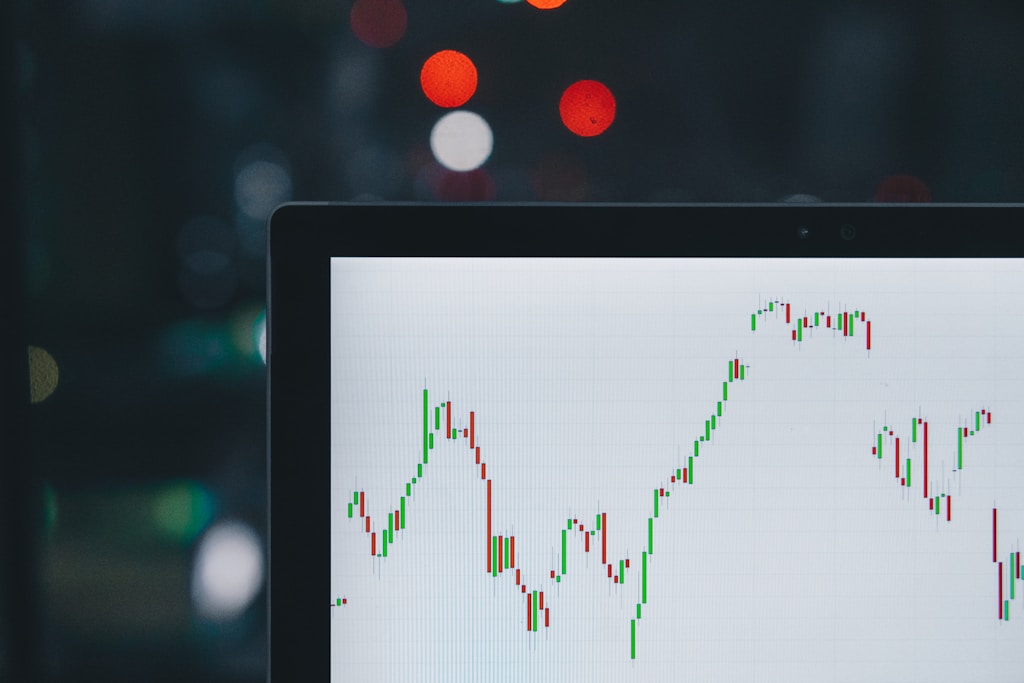
    In a remarkable display of market strength, Bitcoin has maintained its position around $84,000 despite significant headwinds in traditional markets. While the Nasdaq faces mounting pressure from trade tensions, Bitcoin’s price action suggests a potential decoupling from traditional market correlations.

    Understanding Taker Buy Volume

    The Taker Buy Volume metric has emerged as a crucial indicator for Bitcoin’s price trajectory. This technical indicator measures the total volume of buy orders filled by takers in perpetual swap markets, providing valuable insights into market sentiment and potential price movements.

    SPONSORED

    Trade Bitcoin with up to 100x leverage and maximize your profit potential

    Trade Now on Defx

    Key Market Indicators

    • Current Bitcoin Price: $84,000
    • 24-hour Change: +2%
    • Taker Buy Volume: 101.18 million BTC
    • Market Sentiment: Bullish

    Expert Analysis and Price Predictions

    According to crypto analyst Maartunn, the surge in Taker Buy Volume beyond 100 million BTC represents a significant milestone. Historical data suggests that such volume increases often precede substantial price movements, potentially signaling an imminent bullish breakout.

    Frequently Asked Questions

    What is Taker Buy Volume?

    Taker Buy Volume represents the total amount of cryptocurrency purchased by market participants who execute orders against existing sell orders in the order book.

    Why is the 100M BTC milestone significant?

    This level historically indicates strong buying pressure and has preceded significant price movements in previous market cycles.

    How does this metric compare to previous bull runs?

    Current Taker Buy Volume levels mirror patterns seen during previous bull market phases, suggesting similar price action may follow.

    Market Implications and Trading Opportunities

    The combination of strong Taker Buy Volume and Bitcoin’s resilience against macro headwinds presents a compelling case for potential price appreciation. Traders should monitor key support levels and volume patterns for confirmation of this bullish setup.
  • Bitcoin Trading Patterns Reveal 50% Short-Term Traders on Binance

    Bitcoin Trading Patterns Reveal 50% Short-Term Traders on Binance

    Bitcoin’s recent price trajectory continues to show significant volatility, with the leading cryptocurrency experiencing a sharp pullback from $87,000 to $81,332. Currently trading at $82,600, BTC has recorded a 7.6% weekly decline, highlighting the market’s ongoing uncertainty.

    This analysis aligns with recent technical indicators suggesting potential resistance at the $88,000 level, as market participants navigate through increased volatility.

    Key Findings from Binance User Analysis

    A comprehensive study by CryptoQuant analyst Maartunn has unveiled fascinating insights into trader behavior on Binance, the world’s largest cryptocurrency exchange. The data reveals three critical patterns:

    • Over 50% of users make second deposits within 16 days
    • 10% of traders return within 24 hours
    • One-third of users reload accounts within a week

    SPONSORED

    Maximize your trading potential with up to 100x leverage on perpetual contracts

    Trade Now on Defx

    Market Impact Analysis

    This trading pattern suggests a predominantly short-term focused market, which could explain recent price volatility. The high frequency of rapid deposits and trading activity indicates that short-term speculation currently dominates market movements, potentially increasing price volatility.

    Expert Insights and Market Outlook

    The CryptoQuant Bull Score Index currently stands at 10, indicating strongly bearish conditions. This metric has been signaling caution since Bitcoin traded at $96,000, suggesting potential continued downside pressure.

    Frequently Asked Questions

    What does the high frequency of deposits indicate?

    The rapid deposit patterns suggest a market dominated by short-term traders rather than long-term investors, potentially leading to increased price volatility.

    How might this affect Bitcoin’s price stability?

    The prevalence of short-term trading could lead to more frequent price swings as traders quickly enter and exit positions.

    What’s the significance of the Bull Score Index?

    The current reading of 10 indicates strongly bearish market conditions, suggesting potential continued downward pressure on Bitcoin’s price.

  • Bitcoin Short-Term Holders Halt Buying: $90K Target at Risk

    Bitcoin Short-Term Holders Halt Buying: $90K Target at Risk

    Bitcoin’s recent surge toward $88,000 has hit a significant roadblock as short-term holders (STHs) show signs of reduced accumulation, potentially threatening the anticipated push to $90,000. This critical shift in market dynamics comes as key supply metrics signal increased volatility ahead.

    Key Findings from On-Chain Analysis

    • Short-term holder supply dropped significantly over a 3-month period
    • BTC price declined below $83,000 support level
    • Historical patterns suggest potential for recovery despite current weakness

    SPONSORED

    Trade Bitcoin with up to 100x leverage and maximize your profit potential

    Trade Now on Defx

    Understanding the Supply Age Bands Metric

    Advanced investment platform Alphractal’s analysis reveals concerning trends in Bitcoin’s Supply Age Bands, a crucial metric for understanding market sentiment. The data shows:

    Time Period Supply Change Impact
    3-month window Significant decline Bearish short-term
    6-month window Moderate decline Mixed signals

    Historical Context and Future Implications

    While current data suggests bearish momentum, historical patterns from 2013 and 2021 demonstrate that declining STH supply doesn’t always predict prolonged downturns. Bitcoin’s resilience at key support levels remains a crucial factor for potential recovery.

    FAQ Section

    What does decreasing STH supply mean for Bitcoin?

    Decreasing STH supply typically indicates reduced short-term investor confidence but doesn’t necessarily predict long-term price action.

    Could Bitcoin still reach new highs in 2025?

    Historical data suggests Bitcoin can achieve new highs despite temporary STH supply decreases, with potential for significant price appreciation within 6 months.

    What are the key support levels to watch?

    Current critical support levels include $82,000 and $80,000, with the latter being particularly significant for maintaining bullish momentum.

    Technical Analysis and Price Outlook

    Current price action shows BTC trading at $82,982, down 0.16% in 24 hours. Key resistance levels remain at:

    • Primary resistance: $88,000
    • Secondary resistance: $90,000
    • Support level: $82,000

    Conclusion: Strategic Outlook

    While short-term holder behavior raises concerns, Bitcoin’s historical resilience and current market structure suggest potential for recovery. Investors should monitor Supply Age Bands metrics closely while maintaining perspective on longer-term market cycles.

  • Bitcoin Price Analysis: Key Volume Ratio Signals Final Bull Run Peak

    Bitcoin (BTC) appears poised for one final upward surge before this bull market cycle concludes, according to fresh on-chain analysis from CryptoQuant. Despite BTC’s recent 23% correction from its $108,786 all-time high, key metrics suggest the leading cryptocurrency still has room to run.

    The ongoing market uncertainty has been largely driven by President Trump’s new tariff policies, which have pushed US recession risk above 53%. However, historical patterns indicate this pullback may be temporary.

    Critical Volume Ratio Points to Final Bull Run Phase

    CryptoQuant analyst Crypto Dan has identified a crucial indicator – the ratio of BTC volume traded over 6-12 months – that historically marks different phases of market cycles. This metric provides valuable insight into new capital flows and has shown strong correlation with previous bull runs.

    The analysis reveals a clear pattern:

    • First ratio decline: Signals early bull phase ending
    • Recovery period: Attracts new retail investors
    • Second decline: Marks the ultimate cycle peak

    SPONSORED

    Trade Bitcoin with up to 100x leverage on perpetual contracts

    Trade Now on Defx

    Market Sentiment Remains Bullish Despite Correction

    Multiple indicators suggest investors view the current pullback as a temporary setback rather than the end of the bull cycle:

    • Short-term holders maintaining positions despite being at a loss
    • Reduced exchange inflows indicating lower selling pressure
    • Current price holding steady at $82,086 support level

    Frequently Asked Questions

    When will Bitcoin reach its cycle peak?

    Based on current volume ratio analysis, the final peak could occur within the next 3-6 months, though exact timing remains uncertain.

    What price levels should investors watch?

    Key resistance levels lie at $90,000 and $100,000, while major support exists at $80,000 and $75,000.

    How does this cycle compare to previous ones?

    The current cycle shows similar volume ratio patterns to 2017 and 2021, suggesting we’re in the final phase before peak.

  • Trump’s Bitcoin Strategy: Tariffs Could Fuel Strategic BTC Reserve Plan

    Trump’s Bitcoin Strategy: Tariffs Could Fuel Strategic BTC Reserve Plan

    In a surprising development that has caught the attention of crypto analysts, recent market turbulence following Trump’s implementation of new global tariffs might be part of a larger strategy to accumulate Bitcoin at lower prices for a potential strategic reserve.

    Market Impact and Strategic Analysis

    While Bitcoin markets have shown significant volatility in response to the tariff announcements, with prices testing critical support levels, some experts suggest this could be part of a calculated move to create buying opportunities for large-scale Bitcoin acquisition.

    SPONSORED

    Trade Bitcoin with up to 100x leverage on perpetual contracts

    Trade Now on Defx

    Economic Implications

    The implementation of new tariffs has led to increased market uncertainty, with recession risk indicators reaching concerning levels. However, this market disruption could create ideal conditions for strategic Bitcoin accumulation by institutional players.

    Expert Perspectives

    Marathon Digital Holdings’ advisor suggests that the tariff strategy might be deliberately designed to create market conditions favorable for large-scale Bitcoin purchases. This theory aligns with growing institutional interest in cryptocurrency as a strategic asset.

    FAQ Section

    How could tariffs impact Bitcoin prices?

    Tariffs can create market uncertainty, potentially leading to short-term price volatility while offering strategic buying opportunities.

    What is the connection between trade policy and Bitcoin?

    Trade policies affecting traditional markets can drive investors toward alternative assets like Bitcoin as a hedge against economic uncertainty.

    Could this strategy affect global Bitcoin adoption?

    If large-scale institutional buying occurs, it could accelerate Bitcoin adoption and potentially drive prices higher in the long term.

    Market Outlook

    As global markets adjust to the new tariff landscape, Bitcoin’s role as a potential strategic reserve asset continues to evolve. The coming months will be crucial in determining whether this theoretical strategy materializes into concrete action.

  • Bitcoin Price Nears $80K: Key Support Level Holds Despite Trump Tariffs

    Bitcoin Price Nears $80K: Key Support Level Holds Despite Trump Tariffs

    Bitcoin Price Nears $80K: Key Support Level Holds Despite Trump Tariffs

    Bitcoin (BTC) is showing resilience at critical support levels despite a 5% decline following President Trump’s recent tariff announcement, suggesting a potential turning point in the market’s reaction to macroeconomic shocks. The initial market reaction saw Bitcoin drop sharply, but technical indicators point to underlying strength.

    Market Analysis: Bitcoin’s Resilience at Key Support

    While traditional markets tumbled to new yearly lows, Bitcoin has maintained its position above the crucial $75,000 support level, demonstrating what technical analysts refer to as “higher lows” – a potentially bullish signal amid market uncertainty.

    Joel Kruger, LMAX Group market strategist, sees this as a pivotal moment: “This moment feels like a turning point. We see market participants increasingly drawn to BTC’s appeal as a store-of-value asset and a compelling diversification tool amid the uncertainty.”

    SPONSORED

    Trade Bitcoin with up to 100x leverage on perpetual contracts

    Trade Now on Defx

    Institutional Perspective: JPMorgan’s Analysis

    JPMorgan analysts, led by Nikolaos Panigirtzoglou, highlight that Bitcoin’s current price remains above their estimated production cost of $62,000 – a metric that has historically served as a reliable price floor. However, they maintain skepticism about Bitcoin’s “digital gold” narrative, pointing to its continued correlation with equity markets during periods of stress.

    Competing Store of Value: Gold vs Bitcoin

    Traditional safe-haven asset gold has outperformed during this market turbulence, dropping only 1.25% to $3,126 per ounce and remaining within striking distance of its all-time high of $3,200. This performance contrasts with Bitcoin’s more volatile reaction to the tariff news.

    Expert Perspectives on Bitcoin’s Market Role

    Javier Rodriguez Alarcon, chief commercial officer at crypto exchange XBTO and former Goldman Sachs executive, offers a cautionary view: “Despite talk that bitcoin could act as a hedge against dollar-centric volatility, in practice we’re still seeing a strong correlation between digital assets and broader risk markets in moments of uncertainty.”

    FAQ Section

    What is causing Bitcoin’s current price volatility?

    The primary driver is President Trump’s new tariff announcement, which has sparked broader market uncertainty and risk-off sentiment across various asset classes.

    Is Bitcoin still considered a safe-haven asset?

    While some analysts maintain this view, recent market behavior shows Bitcoin still exhibits significant correlation with traditional risk assets during periods of market stress.

    What are the key support levels to watch?

    The critical support level is currently at $75,000, with JPMorgan’s production cost estimate of $62,000 serving as a potential longer-term floor.

  • Bitcoin Price Crashes 7% as Trump’s Tariff Shock Rattles Markets

    Bitcoin Price Crashes 7% as Trump’s Tariff Shock Rattles Markets

    Bitcoin’s price experienced a dramatic 7.2% plunge on Wednesday, dropping from $88,526 to $82,150 in just four hours after former President Trump announced sweeping reciprocal tariffs. This market shock, which follows the pattern of recent tariff-related volatility, represents one of the most significant intraday drops for BTC in 2025.

    Understanding the Tariff Impact on Crypto Markets

    The announcement, made during Trump’s “Make America Wealthy Again Event,” outlined plans to implement reciprocal tariffs on 185 countries simultaneously. This unprecedented move sent shockwaves through global markets, with the S&P 500 futures market losing $2 trillion in market capitalization within minutes.

    SPONSORED

    Trade Bitcoin with up to 100x leverage and maximize your profit potential

    Trade Now on Defx

    Market Analysis and Expert Insights

    JPMorgan analysts project the tariffs could raise approximately $400 billion in revenue, equivalent to 1.3% of GDP. This could potentially trigger a recession, especially when combined with the anticipated 1-1.5% increase in PCE prices.

    As recent technical analysis suggests, Bitcoin’s price action may face additional pressure as the tariff situation develops, potentially testing key support levels.

    Economic Implications and Recovery Prospects

    Despite the initial shock, Bitcoin showed signs of resilience, recovering to $83,207 at press time. However, experts warn that continued market uncertainty could lead to increased volatility in the coming weeks.

    FAQ Section

    • How long will the tariff impact last? Analysts expect market volatility to continue for several weeks as global markets adjust to the new tariff regime.
    • Will Bitcoin recover from this drop? While short-term pressure remains, institutional buying activity suggests strong support at current levels.
    • How does this affect crypto trading strategy? Risk management becomes crucial during periods of heightened volatility, with experts recommending reduced leverage and wider stop-losses.
  • Bitcoin Whales Buy the Dip While Retail Investors Panic Sell: Key Insights

    Recent on-chain data reveals a significant divergence in Bitcoin investor behavior, with mega whales accumulating while retail traders rush to exit positions. This analysis explores the latest trends and what they could mean for BTC’s price trajectory.

    Key Takeaways from Recent Bitcoin Trading Activity

    • Mega whales (holders >10,000 BTC) showing strong accumulation signals
    • Retail investors (< 1 BTC) accelerating their selloff
    • Bitcoin price currently stabilizing around $84,900

    This market behavior closely mirrors patterns seen in recent ETF outflows, suggesting a broader shift in market dynamics.

    Understanding the Accumulation Trend Score

    Glassnode’s data presents a clear picture of the current market structure through their Accumulation Trend Score metric. This indicator provides crucial insights into investor behavior by tracking:

    • Wallet balance changes
    • Address sizes
    • Overall market participation

    SPONSORED

    Trade Bitcoin with up to 100x leverage and maximize your profit potential

    Trade Now on Defx

    Market Implications and Future Outlook

    The current divergence between retail and whale behavior could signal a potential trend reversal. Historical data suggests that when mega whales accumulate against retail sentiment, significant price movements often follow.

    Frequently Asked Questions

    What defines a Bitcoin mega whale?

    A mega whale is typically defined as an entity holding more than 10,000 BTC in their wallet(s).

    Why is retail investor behavior important?

    Retail behavior often serves as a contrary indicator, with mass selling potentially signaling market bottoms.

    What could this mean for Bitcoin’s price?

    While not guaranteed, whale accumulation during retail panic has historically preceded significant price recoveries.

    As the market continues to evolve, monitoring these behavioral patterns becomes crucial for understanding potential price movements and market dynamics.

  • Bitcoin Fear & Greed Index Nears Neutral as BTC Reclaims $85K Level

    The Bitcoin market sentiment is showing signs of stabilization as the leading cryptocurrency recovers to $85,000, with the Fear & Greed Index approaching neutral territory. This shift comes amid recent market turbulence triggered by Trump’s tariff announcements, highlighting the resilience of Bitcoin’s price action.

    Understanding the Current Market Sentiment

    The Fear & Greed Index, a crucial metric developed by Alternative.me, currently stands at 44, just three points shy of the neutral zone. This represents a significant improvement from yesterday’s reading of 34, which had placed the market firmly in fear territory.

    SPONSORED

    Trade Bitcoin with up to 100x leverage and maximize your profit potential

    Trade Now on Defx

    Key Sentiment Indicators

    The index analyzes five critical factors:

    • Market Volatility
    • Trading Volume
    • Market Dominance
    • Social Media Sentiment
    • Google Trends Data

    Recent Market Movement Analysis

    Bitcoin’s price action has shown remarkable resilience, bouncing back from a recent low that saw the Fear & Greed Index touch 26, narrowly avoiding the extreme fear zone. This recovery aligns with analysts’ predictions of a potential push toward $100,000.

    Technical Outlook and Market Implications

    With the sentiment indicator approaching neutral levels, traders should consider:

    • Historical pattern recognition
    • Counter-trend trading opportunities
    • Risk management strategies

    FAQ Section

    What does a neutral Fear & Greed reading mean for Bitcoin?

    A neutral reading suggests balanced market sentiment, potentially indicating a period of price consolidation before the next significant move.

    How reliable is the Fear & Greed Index as a trading indicator?

    While not definitive, the index has historically served as a useful contrary indicator, especially at extreme readings.

    What factors could push Bitcoin beyond $85,000?

    Institutional adoption, regulatory clarity, and macroeconomic factors could catalyze further price appreciation.

    At the time of writing, Bitcoin trades at $85,000, down 4% over the past week but showing signs of recovery as market sentiment improves.

  • Bitcoin Price Holds $84K as Trump’s Liberation Day Tariffs Shake Markets

    Bitcoin Price Holds $84K as Trump’s Liberation Day Tariffs Shake Markets

    Bitcoin Price Holds $84K as Trump’s Liberation Day Tariffs Shake Markets

    Bitcoin demonstrates remarkable resilience amid global market uncertainty, maintaining an $84,609 price level as markets brace for President Donald Trump’s anticipated ‘Liberation Day’ tariffs. As traditional safe-haven assets face increasing pressure, Bitcoin’s stability suggests growing institutional confidence in digital assets.

    Market Metrics at a Glance

    • Current Price: $84,609
    • Market Capitalization: $1.67 trillion
    • 24-hour Trading Volume: $19.84 billion
    • Daily Range: $81,188 – $85,438

    SPONSORED

    Trade Bitcoin with up to 100x leverage and maximize your profit potential

    Trade Now on Defx

    Technical Analysis and Market Sentiment

    Bitcoin’s price action shows remarkable strength, particularly considering the broader market context. Key resistance levels remain at $85,500, with strong support established at the $81,000 mark.

    Impact of Trump’s Liberation Day Tariffs

    The announcement of sweeping tariffs has created ripples across global markets, yet Bitcoin’s stability suggests its emerging role as a potential hedge against geopolitical uncertainty. This aligns with recent analysis showing Bitcoin’s growing status as digital gold.

    FAQ Section

    How will Trump’s tariffs affect Bitcoin’s price?

    Historical data suggests that geopolitical uncertainty often drives investors toward alternative assets like Bitcoin, potentially supporting price stability.

    What are the key support levels to watch?

    Current technical analysis indicates strong support at $81,000, with secondary support at $79,500.

    Is Bitcoin becoming a safe-haven asset?

    Recent market behavior, including today’s stability amid global uncertainty, supports Bitcoin’s growing role as a safe-haven asset.

    Market Outlook

    As global markets adjust to potential trade policy shifts, Bitcoin’s resilience at the $84K level suggests strong fundamental support. Analysts maintain bullish projections, with some targeting the $90,000 level in the near term.