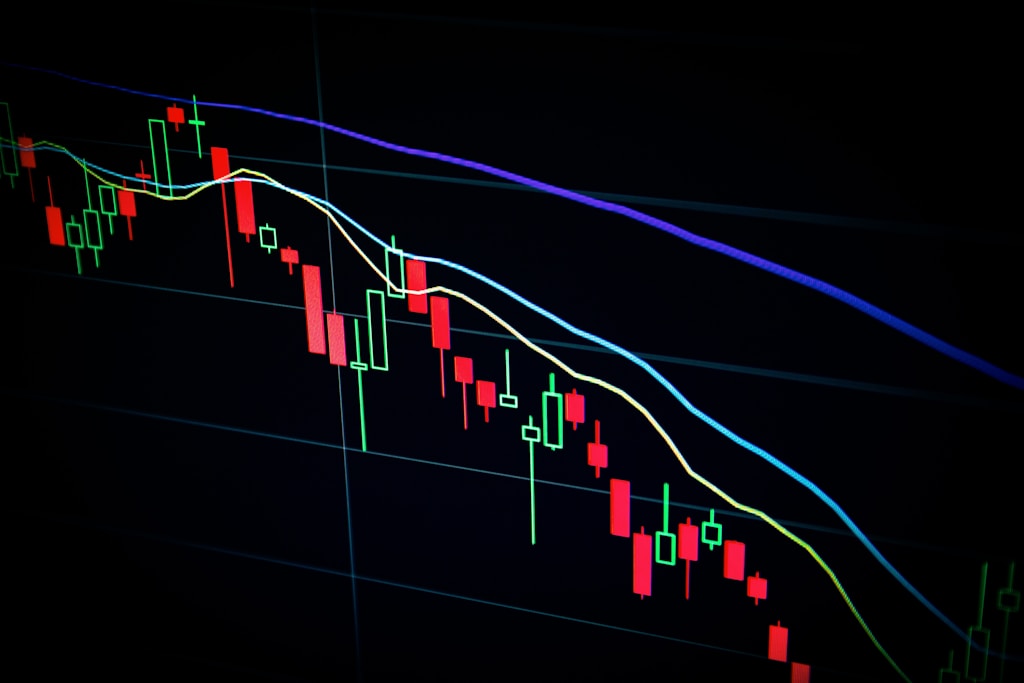
Tag: Btc Price

  • Bitcoin Price Plunges Below $82K: Bears Target $78.5K Support

    Bitcoin’s price trajectory has taken a bearish turn, with BTC dropping significantly below the crucial $85,000 level. As recent market analysis predicted, the leading cryptocurrency is showing increased selling pressure, forcing traders to reassess their positions.

    Key Bitcoin Price Levels to Watch

    The current price action reveals several critical support and resistance levels:

    • Immediate Resistance: $82,750
    • Key Resistance Zone: $83,500
    • Current Support: $81,500
    • Critical Support: $80,650
    • Major Support: $78,500

    Technical Analysis Breakdown

    Bitcoin’s price structure shows concerning bearish signals:

    • Trading below the 100-hour Simple Moving Average
    • Formation of a bearish trend line at $82,750
    • RSI indicating oversold conditions below 50
    • MACD gaining momentum in the bearish zone

    SPONSORED

    Trade Bitcoin with up to 100x leverage and maximize your profit potential

    Trade Now on Defx

    Potential Scenarios

    Two primary scenarios are emerging:

    Bullish Case

    If Bitcoin manages to break above $83,500:

    • Initial target: $84,200
    • Secondary target: $84,800
    • Maximum upside potential: $85,000

    Bearish Case

    If the current support fails:

    • First support test: $81,500
    • Secondary support: $80,650
    • Worst-case scenario: $78,500

    FAQ

    What’s causing Bitcoin’s current price decline?

    The decline appears to be driven by increased selling pressure and technical factors, including the break below key moving averages and support levels.

    Where is the strongest support level for Bitcoin?

    The strongest support level sits at $78,500, which could act as a major bottom if reached.

    What technical indicators should traders watch?

    Key indicators include the hourly MACD, RSI below 50, and the 100-hour Simple Moving Average.

    Traders should maintain strict risk management practices given the current market volatility. The next 24-48 hours will be crucial in determining Bitcoin’s short-term direction.

  • Bitcoin Price Dips Below $82K: Weekend Selloff Hits Crypto Market

    Key Takeaways:

    • Bitcoin (BTC) drops to $81,551 support level
    • Weekly decline of 4.27% raises market concerns
    • Altcoins experience significant 9-12% losses

    The cryptocurrency market is experiencing significant pressure as Bitcoin (BTC) dipped toward the $80,000 mark during weekend trading, marking a concerning trend for digital asset investors. As of Sunday evening, Bitcoin is trading at $81,678, showing minimal recovery from its recent low of $81,551.

    This price movement follows earlier predictions of increased market volatility, with the leading cryptocurrency recording a 4.27% decline over the past week.

    Market Analysis and Technical Outlook

    The current price action suggests a potential continuation of the bearish trend, with several key support levels now under scrutiny. Technical analysts point to $80,000 as a critical psychological support level that bulls must defend to prevent further downside.

    SPONSORED

    Navigate market volatility with up to 100x leverage on perpetual contracts

    Trade Now on Defx

    Impact on Altcoin Market

    The broader cryptocurrency market has not been spared from this downturn, with major altcoins experiencing even steeper declines ranging from 9% to 12%. This widespread correction indicates a potential shift in market sentiment that could have longer-term implications.

    FAQ Section

    Q: What’s causing the current Bitcoin price decline?
    A: The weekend selloff appears to be driven by a combination of profit-taking and reduced trading volume during weekend hours.

    Q: Should investors be concerned about this dip?
    A: While significant, this correction remains within normal market behavior parameters, especially considering Bitcoin’s recent all-time highs.

    Q: What are the key support levels to watch?
    A: Primary support levels include $80,000, followed by $78,500 and $75,000.

  • Bitcoin CME Gap Targets $83K: Critical Support Levels Revealed

    Bitcoin (BTC) is approaching a significant technical milestone as price action converges toward the anticipated Chicago Mercantile Exchange (CME) gap close near $83,000. This development comes amid increasing market volatility and could signal a crucial turning point for the leading cryptocurrency. Recent analysis of Bitcoin’s key support levels aligns with current market movements.

    CME Gap Analysis and Price Targets

    According to crypto analyst Astronomer, Bitcoin is likely to test the critical support zone between $83,000 and $84,000, coinciding with the CME gap closure. This technical phenomenon occurs when weekend trading creates price disparities between CME futures and spot markets.

    SPONSORED

    Trade Bitcoin with up to 100x leverage and maximize your profit potential

    Trade Now on Defx

    Support Levels and Trading Outlook

    Key technical levels to watch include:

    • Primary support: $83,000 – $84,000 range
    • Secondary support: $81,400 – $82,400 zone
    • Potential bounce target: $86,000 (weekly open)
    • Take profit levels: Multiple targets up to $88,000

    Market Indicators and Historical Patterns

    Historical data suggests bearish Friday closes often precede negative price action early the following week. The pre-New York Open (NYO) phase currently leaves room for potential intraday reversals, while the lack of significant liquidations could indicate further downside potential.

    Recovery Scenarios and Risk Factors

    While short-term bearish signals dominate, the macro trend remains stable. A successful hold at the CME gap level could trigger a recovery toward $86,000, with further upside potential to $88,000. However, traders should monitor the worst-case support zone at $81,400 – $82,400, as a break below could accelerate selling pressure.

    Frequently Asked Questions

    What is a CME gap in Bitcoin trading?

    A CME gap occurs when Bitcoin’s price moves during weekend hours when the CME futures market is closed, creating a price disparity that often gets filled during regular trading hours.

    Why are the $83,000-$84,000 levels significant?

    These levels represent both the CME gap closure target and a crucial technical support zone that could determine Bitcoin’s next major price movement.

    What could trigger a bearish scenario?

    A break below the $81,400 support level could signal increased selling pressure and potentially lead to a deeper market correction.

  • Bitcoin Price Crashes to $81.6K: Market Fear Intensifies

    Bitcoin Price Crashes to $81.6K: Market Fear Intensifies

    Bitcoin’s price trajectory took a sharp downturn this weekend, with the leading cryptocurrency plummeting to $81,629 – a significant drop that has intensified market fears and sparked concerns about potential further corrections. This price action comes as key support levels face mounting pressure in the broader crypto market.

    Market Overview: Crypto Sentiment Turns Bearish

    The cryptocurrency market witnessed a substantial decline, with the total market capitalization dropping 2.14% to $2.66 trillion. This bearish price action has triggered widespread concern among investors and traders alike.

    SPONSORED

    Navigate volatile markets with up to 100x leverage on perpetual contracts

    Trade Now on Defx

    Technical Analysis: Critical Support Levels

    The current price action suggests Bitcoin is testing several crucial support levels:

    • Primary support: $81,500
    • Secondary support: $80,000
    • Last-line defense: $78,500

    Market Sentiment Indicators

    The Fear and Greed Index has shifted significantly towards the fear zone, indicating growing uncertainty in the market. This sentiment shift aligns with recent exchange outflow data that suggested potential accumulation at higher levels.

    Expert Outlook

    Market analysts remain divided on Bitcoin’s short-term trajectory. While some view this as a healthy correction within a broader bull market, others warn of potential further downside.

    FAQs

    What caused Bitcoin’s recent price drop?

    The decline appears to be driven by a combination of profit-taking and broader market uncertainty.

    Will Bitcoin recover from this dip?

    Historical patterns suggest that such corrections are common during bull markets, though past performance doesn’t guarantee future results.

    What are the key levels to watch?

    The $80,000 psychological level remains crucial for maintaining bullish momentum.

  • Bitcoin Price Dips Below $84K: Critical Support Levels Revealed

    Bitcoin’s price has entered a critical phase after dropping below $84,000, following one of its strongest weekly performances that saw the cryptocurrency reach $88,000. The latest market movement, triggered by February’s core inflation data, has left investors questioning the strength of key support levels.

    As Bitcoin continues testing crucial support zones, on-chain data from Glassnode provides essential insights into potential price floors that could determine BTC’s next major move.

    Understanding Bitcoin’s Current Support Structure

    Glassnode’s cost basis distribution analysis reveals several critical support levels that could influence Bitcoin’s price trajectory:

    • $84,100: 40,000 BTC accumulated
    • $82,090: 50,000 BTC accumulated
    • $80,920: 20,000 BTC accumulated

    SPONSORED

    Trade Bitcoin with up to 100x leverage and maximize your profit potential

    Trade Now on Defx

    Deeper Support Zones and Risk Analysis

    The analysis identifies additional support levels that could become crucial if current levels fail:

    • $74,000: Strong support with 49,000 BTC accumulated
    • $71,000: Major accumulation zone with 41,000 BTC

    Notably, the previously strong $78,000 support level has weakened following recent sell-offs, potentially creating vulnerability in the short term.

    Market Impact and Trading Implications

    The current 4% decline brings several key considerations for traders:

    • Short-term volatility expected around $84,000
    • Increased trading volume at support levels
    • Potential for quick rebounds from accumulation zones

    Frequently Asked Questions

    What caused Bitcoin’s recent price drop?

    The decline was primarily triggered by February’s core inflation data release and subsequent market reactions.

    Where is the strongest support level for Bitcoin?

    According to Glassnode data, the $82,090 level shows the strongest support with 50,000 BTC accumulated.

    Could Bitcoin fall to $71,000?

    While possible, multiple strong support levels would need to break first, with $74,000 serving as a major buffer zone.

    As the market continues to digest these developments, traders should maintain close attention to these key support levels and corresponding volume patterns for potential entry and exit points.

  • Bitcoin Exchange Outflows Hit 2025 High: Major Rally Ahead?

    Bitcoin Exchange Outflows Hit 2025 High: Major Rally Ahead?

    Bitcoin Exchange Outflows Hit 2025 High: Major Rally Ahead?

    Bitcoin continues to show resilience above $84,000 despite recent market volatility, with exchange flow data suggesting a potentially bullish outlook. A comprehensive analysis by CryptoQuant reveals significant shifts in investor behavior that could signal an impending price movement.

    Current Market Status:

    • Bitcoin Price: $84,263
    • 24h Change: -3.2%
    • Weekly Performance: +0.2%
    • Key Support Level: $84,000

    Exchange Flow Analysis Points to Accumulation Phase

    Recent data from CryptoQuant shows a compelling trend that aligns with previous analysis indicating potential price rallies following significant exchange outflows. Since February 6, 2025, Bitcoin has experienced consistent withdrawals from centralized exchanges, suggesting a strong accumulation phase.

    Key Exchange Flow Indicators:

    • Sustained negative netflow across major exchanges
    • Increased cold wallet transfers
    • Reduced exchange reserves

    SPONSORED

    Trade Bitcoin with up to 100x leverage and maximize your profit potential

    Trade Now on Defx

    Understanding the Bullish Case

    The current market dynamics share similarities with previous periods of price consolidation, where sustained exchange outflows preceded significant rallies. Analysts point to several key factors:

    • Reduced liquid supply on exchanges
    • Growing institutional interest
    • Long-term holder accumulation

    Risk Factors and Market Concerns

    Despite the bullish indicators, some warning signs have emerged in the derivatives market. Recent data shows reduced BTC flows to derivative platforms, traditionally interpreted as declining risk appetite among traders.

    Frequently Asked Questions

    What do exchange outflows indicate?

    Exchange outflows typically suggest investors are moving Bitcoin to long-term storage, often considered a bullish signal as it reduces selling pressure.

    How reliable are exchange flow indicators?

    While exchange flows are important indicators, they should be considered alongside other metrics for a complete market analysis.

    What could trigger the next Bitcoin rally?

    A combination of reduced liquid supply, increased institutional demand, and positive market sentiment could catalyze the next significant price movement.

    Conclusion and Market Outlook

    While Bitcoin’s short-term price action remains volatile, the underlying exchange flow metrics suggest growing confidence among long-term holders. Continued monitoring of these trends, alongside broader market indicators, will be crucial for investors positioning themselves for potential future price movements.

  • Bitcoin Whales Halt 290K BTC Selloff: Key $90K Level in Focus

    Bitcoin Whales Halt 290K BTC Selloff: Key $90K Level in Focus

    Bitcoin continues to hold steady above $85,000 as a significant shift in whale behavior signals potential accumulation phase. Recent on-chain data reveals major Bitcoin holders have stopped their months-long distribution pattern, suggesting renewed confidence in the market’s trajectory. As short-term holders face mounting pressure near the $90K resistance, whale activity could provide crucial support for the next leg up.

    Whale Distribution Pattern Ends: 290K BTC Selling Pressure Subsides

    According to CryptoQuant data, Bitcoin whales have concluded a significant distribution phase that saw approximately 290,000 BTC moved over five months. This substantial supply reduction from major holders appears to be shifting, with recent metrics indicating a return to accumulation patterns.

    Top analyst Axel Adler’s research shows wallet balances exceeding 1,000 BTC are now showing signs of growth, marking a potential turning point in market dynamics. This behavioral change among large holders could provide the foundation needed for Bitcoin to challenge the critical $88,000-$91,000 resistance zone.

    SPONSORED

    Trade Bitcoin with up to 100x leverage and maximize your profit potential

    Trade Now on Defx

    Technical Analysis: $85,500 Support Holds Key

    Bitcoin’s price action remains supported by the convergence of the 200-day moving average and 200-day EMA near $85,500. This critical support level has proven resilient, though broader market uncertainties continue to influence trading sentiment.

    Market Outlook and Key Levels to Watch

    For Bitcoin to establish a clear bullish trajectory, breaking above $90,000 remains crucial. The current range between $85,000 and $88,000 represents a consolidation phase, with whales’ shifting behavior potentially providing the catalyst needed for the next major move.

    Risk Factors and Support Levels

    • Primary Support: $85,500 (200-day MA convergence)
    • Critical Resistance: $88,000-$91,000 zone
    • Risk Level: $81,000 (breakdown target)

    FAQ Section

    What does the 290K BTC reduction in whale holdings mean?

    This significant reduction represents a distribution phase that has now ended, potentially signaling the start of a new accumulation cycle.

    Why is the $90K level so important for Bitcoin?

    The $90,000 level represents a major psychological barrier and liquidity zone that could trigger significant price action once breached.

    What could trigger a bearish scenario?

    Failure to break above $90K combined with a loss of the $85,500 support could lead to increased selling pressure and a potential drop toward $81,000.

  • Bitcoin Whales Add 48 New 100+ BTC Wallets as Price Nears $90K

    Bitcoin Whales Add 48 New 100+ BTC Wallets as Price Nears $90K

    Bitcoin whales are showing renewed confidence in the market as on-chain data reveals a significant surge in large-scale accumulation. According to recent analysis, 48 new wallets holding over 100 BTC each have emerged, signaling strong institutional interest as Bitcoin trades near $90,000.

    Whale Accumulation Signals Growing Market Confidence

    Seasoned crypto analyst Ali Martinez has identified a notable uptick in whale activity, with dozens of new wallets now holding substantial Bitcoin positions. This accumulation pattern mirrors the behavior seen in previous whale accumulation phases that preceded major price rallies.

    The leading cryptocurrency has demonstrated remarkable resilience, climbing over 15% from its March 10 low of $76,600. Currently trading at $88,069, Bitcoin’s price action is supported by several bullish fundamentals:

    • 48 new wallets holding 100+ BTC have emerged
    • A dormant whale wallet from 2017 has reactivated, with holdings now worth $250 million
    • Significant increase in whale accumulation since late 2024

    SPONSORED

    Trade Bitcoin with up to 100x leverage and maximize your profit potential

    Trade Now on Defx

    Technical Indicators Support Bullish Outlook

    Multiple technical indicators are aligning to support Bitcoin’s bullish momentum. The Relative Strength Index (RSI) has broken out of a multi-month downtrend, while prominent analysts project potential targets as high as $112,000 if Bitcoin breaks above $94,000 resistance.

    Expert Analysis and Price Projections

    Former BitMEX CEO Arthur Hayes suggests that Bitcoin likely found its cycle bottom at $76,600 on March 10. Additionally, digital asset management firm Bitwise indicates that current risk-adjusted metrics make this an opportune time for Bitcoin investment.

    FAQ Section

    What defines a Bitcoin whale?

    A Bitcoin whale typically refers to any wallet holding 100 or more BTC, though definitions can vary among analysts.

    Why is whale accumulation significant?

    Whale accumulation often precedes major price movements as it indicates strong conviction from wealthy investors and institutions.

    What are the key resistance levels to watch?

    The primary resistance level is at $94,000, with $112,000 identified as the next major target if this level is broken.

  • Bitcoin Short-Term Holders Surge 201K BTC: Key Metrics Signal $90K Push

    Bitcoin’s market dynamics are showing renewed strength as short-term holders accumulate significant positions, with on-chain data revealing a dramatic increase in their supply. This surge comes as Bitcoin continues to hold strong above $85,000, suggesting potential for further upside.

    Short-Term Holder Supply Reaches 5.75M BTC

    According to renowned on-chain analyst Axel Adler Jr., Bitcoin short-term holders have added an impressive 201,743 BTC to their positions since January 1, 2025. This accumulation has pushed their total holdings to approximately 5,750,076 BTC, demonstrating significant confidence in Bitcoin’s current market trajectory.

    SPONSORED

    Trade Bitcoin with up to 100x leverage and maximize your profit potential

    Trade Now on Defx

    Historical Context and Market Implications

    While the current accumulation is substantial, it’s worth noting that it remains below previous cycle peaks. Historical data shows that short-term holders controlled over 8.4 million BTC during the last major bull run, suggesting potential room for growth in the current cycle.

    Key Metrics and Price Indicators

    The Short-Term Holders SOPR (Spent Output Profit Ratio) has risen above 1, traditionally a signal that holders may consider taking profits. However, despite approximately 200,000 BTC currently sitting at an unrealized loss of $17 billion, analysts remain optimistic about holder behavior.

    Market Outlook and Trading Volume

    Bitcoin currently trades at $87,580, showing resilience despite a 13% decline in trading volume over the past 24 hours. Recent analysis suggests Bitcoin could target $95,000 as market fundamentals remain strong.

    FAQ Section

    What defines a Bitcoin short-term holder?

    Short-term holders are typically defined as investors who have held their Bitcoin for 155 days or less.

    Why is the SOPR indicator important?

    The SOPR indicator helps measure whether holders are selling at a profit (>1) or loss (<1), providing insight into potential selling pressure.

    What could drive Bitcoin to $90,000?

    Continued institutional adoption, strong holder metrics, and reduced selling pressure from short-term holders could support Bitcoin’s push toward $90,000.

  • Bitcoin Whales Accumulate 129K BTC During Price Dip: Key Analysis

    Bitcoin Whales Accumulate 129K BTC During Price Dip: Key Analysis

    Bitcoin Whales Accumulate 129K BTC During Price Dip: Key Analysis

    In a significant market development, blockchain analytics firm Glassnode reports that Bitcoin whales have accumulated over 129,000 BTC since March 11, despite recent price volatility. This accumulation pattern emerges as Bitcoin continues to show resilience above key support levels, suggesting strong institutional confidence in the leading cryptocurrency.

    Key Findings from Glassnode’s Analysis

    • Large investors have added 129,000+ BTC to their holdings
    • Accumulation occurred during a period of price consolidation
    • Smaller holders continue to realize profits through selling

    SPONSORED

    Maximize your Bitcoin trading potential with up to 100x leverage

    Trade Now on Defx

    Market Impact and Analysis

    This accumulation pattern bears striking similarity to previous whale behavior before major price rallies. As Bitcoin eyes potential moves toward $95,000, this institutional buying pressure could serve as a catalyst for the next leg up.

    Retail vs. Institutional Behavior

    The contrasting behavior between large and small holders creates an interesting market dynamic:

    • Whales: Strategic accumulation during dips
    • Retail: Profit-taking and reduced exposure
    • Net effect: Transfer of assets from weak to strong hands

    Technical Outlook

    Current market metrics suggest a strong foundation for continued upward momentum:

    • Support levels holding firm
    • Reduced selling pressure from retail investors
    • Increased institutional participation

    FAQ Section

    What defines a Bitcoin whale?

    A Bitcoin whale typically refers to an entity holding 1,000 BTC or more.

    Why is whale accumulation significant?

    Whale accumulation often precedes major price movements and indicates strong institutional confidence.

    How does this affect Bitcoin’s price outlook?

    Historical data suggests that periods of whale accumulation frequently lead to sustained price appreciation.

    Market Implications

    The current accumulation pattern could signal the start of another bullish phase in the Bitcoin market. Investors should monitor these developments closely as they often precede significant price movements.