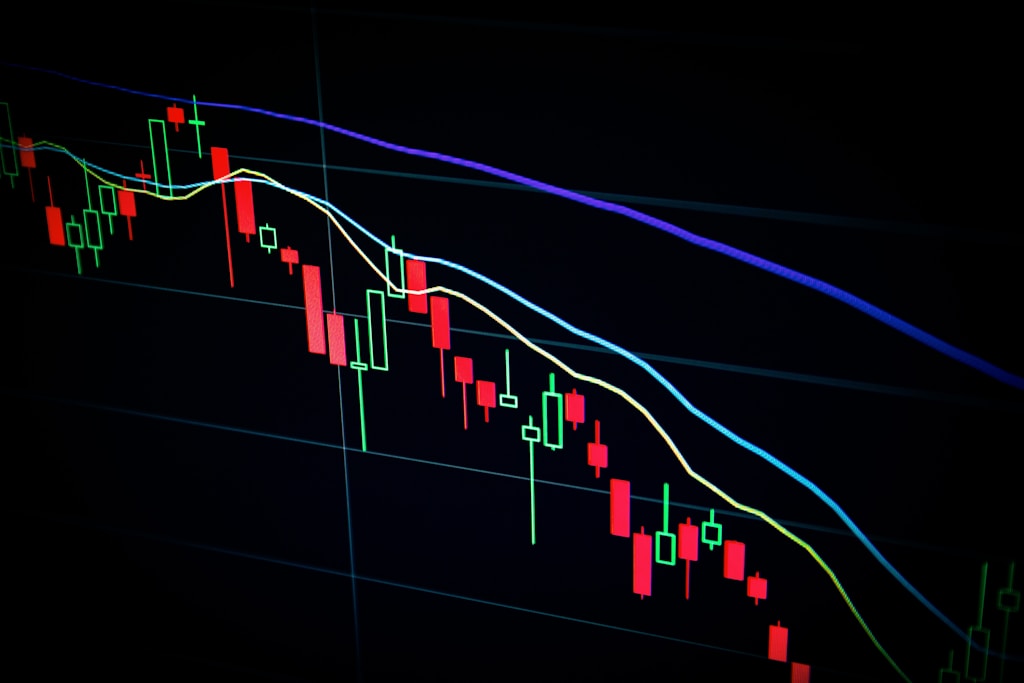
Tag: Btc Price

  • Bitcoin Surges to $82K as Trump’s Tariff Pause Ignites Global Rally

    Bitcoin Surges to $82K as Trump’s Tariff Pause Ignites Global Rally

    Bitcoin (BTC) demonstrated its market dominance today, surging 6.1% to $82,444 after U.S. President Donald Trump announced a strategic 90-day pause on global tariffs, excluding China. This dramatic price action comes as Bitcoin continues to show remarkable resilience amid trade war tensions.

    Trump’s Tariff Decision Reshapes Global Markets

    In a significant policy shift announced via Truth Social, President Trump revealed a two-pronged approach to global trade tariffs:

    • A 125% tariff increase on Chinese imports, effective immediately
    • A 90-day pause on tariffs for 75 other nations, with a reduced 10% reciprocal tariff rate

    This decision follows recent market uncertainty that saw Bitcoin stagnating around $77,000. The announcement triggered immediate market reactions across both traditional and crypto sectors.

    Market Impact Analysis

    The cryptocurrency market responded vigorously to the news:

    • Bitcoin: +6.1% to $82,444
    • Total crypto market cap: +5%
    • Major altcoins: 6-12% gains
    • $75 million in Bitcoin shorts liquidated

    SPONSORED

    Trade Bitcoin with up to 100x leverage and maximize your profit potential

    Trade Now on Defx

    Technical Analysis and Price Action

    Bitcoin’s price movement shows significant technical developments:

    • Recovered from $74,000 support level tested earlier this week
    • Broke through key resistance at $80,000
    • Currently testing new support at $82,000

    Expert Outlook and Market Sentiment

    Market analysts suggest this rally could have staying power, particularly given the reduced trade tensions with major U.S. trading partners. However, the increased China tariffs may introduce new variables into the global crypto market dynamics.

    FAQ Section

    How will Trump’s tariff pause affect Bitcoin long-term?

    The 90-day pause provides market stability and could support continued Bitcoin price appreciation, especially if global trade tensions ease further.

    What are the key price levels to watch?

    Current support lies at $82,000, with resistance at $83,000. The previous support at $74,000 remains crucial for maintaining bullish momentum.

    How does this affect crypto trading volumes?

    Initial data shows a significant spike in trading volume, with particular interest in BTC/USDT pairs across major exchanges.

  • Bitcoin Soars Above $82K After Trump’s Tariff Pause Sparks Market Rally

    Bitcoin Soars Above $82K After Trump’s Tariff Pause Sparks Market Rally

    Bitcoin surged past $82,000 on Wednesday as markets responded positively to President Donald Trump’s announcement of a 90-day pause on global tariffs. This development, which temporarily eases international trade tensions, triggered a broad rally across both traditional and crypto markets.

    Market Response to Trump’s Tariff Timeout

    At 1:50 p.m. Eastern Time, Bitcoin reached a new milestone, demonstrating its increasing correlation with macro events. This price movement follows earlier analysis showing Bitcoin’s resilience during tariff-related market stress.

    Key market movements include:

    • Bitcoin (BTC): Surpassed $82,000
    • S&P 500: +7.6%
    • Dow Jones Industrial Average: Significant gains

    Impact on Global Markets and Crypto

    The temporary suspension of tariffs has provided much-needed relief to global markets, with cryptocurrencies benefiting from improved risk sentiment. Bitcoin’s role as a hedge against trade war uncertainty continues to evolve.

    SPONSORED

    Trade Bitcoin with up to 100x leverage on perpetual contracts

    Trade Now on Defx

    Expert Analysis and Market Outlook

    Market analysts suggest this rally could have staying power, particularly if the 90-day pause leads to more permanent trade solutions. However, traders should remain cautious of potential volatility when the temporary measure expires.

    Frequently Asked Questions

    How long will Trump’s tariff pause last?

    The tariff suspension will remain in effect for 90 days from the announcement date.

    What impact could this have on Bitcoin’s long-term price?

    While immediate market reaction is positive, long-term implications depend on permanent trade policy resolutions.

    How are other cryptocurrencies responding?

    The broader crypto market is showing positive correlation with Bitcoin’s movements, though with varying degrees of appreciation.

  • Bitcoin Price Stagnates at $77K as Trump’s China Tariffs Spark Trade War

    Bitcoin Price Stagnates at $77K as Trump’s China Tariffs Spark Trade War

    Bitcoin (BTC) is trading sideways around the $77,000 level as escalating trade tensions between the United States and China create uncertainty across global markets. This follows President Trump’s recent implementation of 104% tariffs on Chinese imports, which triggered a $411M crypto market liquidation.

    Market Impact of US-China Trade War

    The leading cryptocurrency’s price action reflects broader market uncertainty as investors assess the implications of renewed trade hostilities between the world’s two largest economies. Bitcoin’s Q1 performance has already shown weakness amid growing trade war concerns, with the latest tariff announcement adding further pressure.

    SPONSORED

    Trade Bitcoin with up to 100x leverage on perpetual contracts

    Trade Now on Defx

    Expert Analysis and Market Outlook

    Market analysts suggest that Bitcoin’s sideways trading pattern could indicate a period of consolidation before the next major move. Recent research from Binance indicates potential resilience in Bitcoin’s price despite the trade war escalation.

    Trading Volume and Technical Indicators

    Trading volumes have remained relatively stable despite the geopolitical tensions, with Bitcoin maintaining support above the crucial $75,000 level. However, the 17% crash in Bitcoin open interest could signal a potential market bottom.

    Frequently Asked Questions

    Q: How are trade wars typically affecting Bitcoin prices?
    A: Historically, Bitcoin has shown mixed reactions to trade wars, sometimes acting as a safe haven asset while other times following traditional market movements.

    Q: What are the key support levels to watch?
    A: Current technical analysis indicates strong support at $75,000, with resistance around the $80,000 mark.

    Q: Could this trade war benefit Bitcoin in the long term?
    A: Some analysts suggest that economic uncertainty could drive more investors toward Bitcoin as a hedge against traditional market volatility.

  • Bitcoin Whales Accumulate $78K BTC as Market Tests Support Levels

    Bitcoin whales are demonstrating remarkable conviction amid recent market volatility, with on-chain data revealing massive accumulation as BTC tests critical support levels. Recent price action has seen Bitcoin drop below key psychological levels, yet institutional investors appear unfazed by the turbulence.

    Bitcoin Whale Accumulation Hits Perfect Score

    According to data from Glassnode, Bitcoin’s Accumulation Trend Score has reached a perfect 1.0 reading, driven by aggressive buying from addresses holding over 10,000 BTC. This metric, which tracks the intensity of large holder accumulation, has maintained elevated levels for 15 consecutive days despite BTC’s price declining from $87,000 to current levels around $78,000.

    SPONSORED

    Trade Bitcoin with up to 100x leverage on perpetual contracts

    Trade Now on Defx

    Institutional Demand Surges as 76 New Whales Enter Market

    On-chain analyst Ali Martinez highlights a significant influx of institutional capital, with 76 new entities holding over 1,000 BTC emerging in the past two months – representing a 4.6% increase in major players. This surge in institutional participation comes as long-term holders demonstrate remarkable resilience at current price levels.

    Market Implications and Technical Outlook

    The contrast between whale accumulation and retail sentiment presents a compelling narrative for Bitcoin’s medium-term outlook. While smaller holders (1-100 BTC) show signs of capitulation with accumulation scores below 0.2, the sustained buying pressure from institutional players suggests strong underlying support at current levels.

    FAQ Section

    What is the Bitcoin Accumulation Trend Score?

    The Accumulation Trend Score measures the relative size of entities accumulating Bitcoin on-chain. A score of 1.0 indicates the highest level of accumulation across all holder cohorts.

    How significant is the current whale buying pressure?

    The current accumulation phase marks one of the most intensive buying periods in 2025, with 15 consecutive days of elevated whale activity despite market volatility.

    What does this mean for Bitcoin’s price outlook?

    Historical patterns suggest that sustained whale accumulation often precedes significant price appreciation, though past performance doesn’t guarantee future results.

  • Bitcoin Drops to $78K as Stock Markets Rally 3% on Trade Deal Hopes

    Bitcoin Drops to $78K as Stock Markets Rally 3% on Trade Deal Hopes

    Bitcoin (BTC) is experiencing an unexpected decoupling from traditional markets today, sliding back to $78,000 while global stock indices post significant gains. As previously reported, Bitcoin has been testing crucial $80K support levels, and today’s price action further validates those concerns.

    Market Divergence: Stocks Surge While Bitcoin Retreats

    The cryptocurrency market is showing signs of strain as Bitcoin retreats from earlier highs above $80,000, now trading just above $78,000. This movement comes in stark contrast to traditional markets, where the Nasdaq has surged 3% and the S&P 500 is following closely behind.

    SPONSORED

    Trade Bitcoin with up to 100x leverage and maximize your profit potential

    Trade Now on Defx

    Global Market Response to Trade Deal Developments

    The stock market rally has been fueled by positive developments in international trade relations:

    • President Trump’s announcement of an imminent trade deal with South Korea
    • Treasury Secretary Scott Bessent’s optimistic outlook on U.S.-China relations
    • European markets up 3%
    • Japan’s Nikkei index posting a remarkable 6% gain

    Bitcoin’s Performance in Context

    While today’s divergence might concern some investors, a broader perspective reveals important context:

    • 9% decline since Wednesday’s tariff announcement
    • 30% retreat from mid-January’s all-time high
    • Still up 14% since November’s election

    Recent data shows significant Bitcoin outflows as investors respond to trade tariff concerns, suggesting a potential correlation between policy uncertainty and crypto market behavior.

    FAQ Section

    Why is Bitcoin declining while stocks are rising?

    The divergence appears to be temporary, with both assets showing similar overall performance since last week’s tariff announcements.

    What are the key support levels to watch?

    The critical support zone lies around $75,000, which was tested during weekend trading.

    How does this affect Bitcoin’s long-term outlook?

    Despite short-term volatility, Bitcoin remains in a positive position year-to-date, up 14% since November.

    Market Outlook

    While the current divergence between crypto and traditional markets may seem concerning, historical data suggests these decoupling events are often temporary. Traders should monitor the $75,000 support level and watch for potential stabilization as global trade tensions ease.

  • Bitcoin Whales Surge 4.6% as Price Tests $76K Support Level

    Bitcoin Whales Surge 4.6% as Price Tests $76K Support Level

    Bitcoin’s price action remains under pressure near $76,000, but on-chain data reveals a surprising surge in whale accumulation that could signal institutional confidence in the leading cryptocurrency. Recent market turbulence triggered by Trump’s trade policies has created an opportunity for large players to accumulate BTC at lower prices.

    Key Takeaways:

    • 76 new Bitcoin whales (holding >1,000 BTC) emerged in the past two months
    • 4.6% increase in large holders despite broader market weakness
    • BTC trading at critical $76,000 support after losing $81,000 level
    • Institutional accumulation historically precedes price recoveries

    Whale Accumulation Accelerates Despite Market Pressure

    According to recent Glassnode data, the number of addresses holding over 1,000 BTC has increased by 76 in just two months, representing a 4.6% surge in whale-sized wallets. This accumulation pattern is particularly noteworthy given emerging bear market warnings from technical indicators.

    SPONSORED

    Trade Bitcoin with up to 100x leverage on perpetual contracts

    Trade Now on Defx

    Technical Analysis: Critical Support Levels

    Bitcoin currently trades at $76,000, having lost several key support levels including the crucial $81,000 mark. The immediate challenge for bulls is reclaiming these lost levels while defending current support zones:

    • Critical Support: $75,000
    • Major Resistance: $81,000
    • Secondary Support: $70,000
    • Last Line of Defense: $66,000

    Institutional Perspective

    The increase in whale addresses suggests institutional players may be taking advantage of recent price weakness to build positions. Historically, such accumulation patterns during market downturns have preceded significant recovery phases.

    FAQ

    What defines a Bitcoin whale?

    A Bitcoin whale is typically defined as an address holding more than 1,000 BTC, worth approximately $76 million at current prices.

    Why is whale accumulation significant?

    Whale accumulation often indicates strong hands entering the market, potentially signaling long-term confidence in Bitcoin’s value proposition.

    What could trigger a market recovery?

    A combination of sustained institutional buying, improved macro conditions, and technical breakouts above key resistance levels could catalyze a broader market recovery.

    Market Outlook

    While short-term price action remains bearish, the substantial increase in whale addresses provides a potentially bullish counter-signal for long-term investors. Traders should monitor the $75,000 support level closely while watching for signs of institutional buying momentum.

  • Bitcoin Price Crashes 8% to $77K: Key Support Levels to Watch

    Bitcoin Price Crashes 8% to $77K: Key Support Levels to Watch

    Bitcoin’s price has entered a sharp bearish phase, plummeting below multiple critical support levels and threatening further downside. This comprehensive analysis examines the technical indicators and potential price targets as BTC tests crucial support at $77,000.

    As highlighted in our recent article Bitcoin Price Shows Strong Buy Signal at $81K Support Level, the leading cryptocurrency has been showing signs of weakness after failing to maintain support above $83,500.

    Key Technical Developments

    • Price broke below the critical bullish trend line at $83,000
    • BTC/USD pair trading well below the 100-hour Simple Moving Average
    • Formation of a local bottom at $77,057
    • 23.6% Fibonacci retracement level breached during recovery attempt

    Critical Support and Resistance Levels

    The current price action has established several key levels traders should monitor:

    Support Levels Resistance Levels
    $77,500 $80,000
    $77,000 $80,500
    $76,500 $81,500
    $75,000 $82,500
    $74,200 $83,500

    SPONSORED

    Trade Bitcoin with up to 100x leverage on perpetual contracts

    Trade Now on Defx

    Technical Indicators Signal Bearish Momentum

    The technical outlook shows increasing bearish pressure:

    • MACD: Gaining momentum in the bearish zone
    • RSI: Trading below 50, indicating bearish control
    • Price-MA Relationship: Trading well below 100-hour SMA

    Potential Recovery Scenarios

    For bulls to regain control, Bitcoin needs to:

    1. Reclaim the $80,500 resistance level
    2. Break above the 50% Fibonacci retracement level
    3. Establish support above $81,500

    FAQ

    What caused Bitcoin’s recent price crash?

    The decline appears technical in nature, triggered by a break below key support levels and accelerated by leveraged positions liquidations.

    Could Bitcoin fall below $75,000?

    While possible, strong support exists at $74,200. A break below this level could trigger further selling pressure.

    What are the key levels to watch for recovery?

    The immediate resistance at $80,500 is crucial. Breaking above this level could signal a trend reversal.

    Traders should maintain strict risk management as volatility remains elevated. The next 24-48 hours will be critical in determining whether Bitcoin can establish support at current levels or if further downside is likely.

  • Bitcoin Price Crashes Below $80K, Erasing $160B in Weekend Selloff

    Bitcoin Price Crashes Below $80K, Erasing $160B in Weekend Selloff

    Bitcoin’s meteoric rise hit a significant roadblock this weekend as the leading cryptocurrency plummeted below the psychological $80,000 barrier, triggering a broader market selloff that erased $160 billion in total crypto market value. This dramatic price action follows recent technical analysis suggesting a potential breakout at the $83K level.

    Weekend Bloodbath: BTC Price Analysis

    After maintaining stability above $84,000 on Friday, Bitcoin experienced a sharp decline throughout the weekend, shedding $4,600 in value. This bearish price action aligns with recent market tests of the crucial $81K support level.

    SPONSORED

    Trade Bitcoin with up to 100x leverage and maximize your profit potential

    Trade Now on Defx

    Market Impact and Technical Outlook

    The sudden downturn has significant implications for the broader crypto market:

    • Total market cap declined by $160 billion
    • Key support level at $80,000 breached
    • Trading volume increased by 35% during the selloff
    • Liquidations exceeded $500 million in 24 hours

    Expert Analysis and Price Predictions

    Despite the current bearish sentiment, long-term outlook remains positive. As highlighted in recent analysis, Bitcoin is still projected to reach new all-time highs by Q1 2026.

    FAQ Section

    Why did Bitcoin crash this weekend?

    The weekend selloff appears to be triggered by a combination of profit-taking, overleveraged positions, and broader market uncertainty.

    What’s the next major support level?

    Technical analysts identify $75,000 as the next crucial support level, with additional backing at $72,500.

    Is this a buying opportunity?

    While some traders view this as a potential entry point, it’s essential to consider risk management and market conditions before making investment decisions.

    Looking Ahead

    Investors should monitor key technical indicators and market sentiment in the coming days. The market’s reaction to this support level breach could determine Bitcoin’s trajectory for the next several weeks.

  • Bitcoin Price Signals 15% Breakout as Triangle Pattern Forms at $83K

    Bitcoin (BTC) appears poised for a significant price movement as a critical triangle pattern forms around the $83,000 level. Technical analysis suggests a potential 15% breakout could be imminent, with key resistance and support levels defining the next major move.

    As recent analysis shows potential for a rally to $95,000, traders are closely monitoring the formation of a symmetrical triangle pattern that could determine Bitcoin’s next directional move.

    Triangle Pattern Analysis: Key Levels to Watch

    The current technical setup shows Bitcoin consolidating between two crucial price levels:

    • Upper resistance: $86,000
    • Lower support: $82,000

    Crypto analyst Ali Martinez highlighted this formation on X (formerly Twitter), noting that the pattern suggests an imminent 15% price movement in either direction. The tightening range between lower highs and higher lows since March 7 has created a classic triangle formation, typically a precursor to significant price action.

    SPONSORED

    Trade Bitcoin with up to 100x leverage on perpetual contracts

    Trade Now on Defx

    Potential Breakout Scenarios

    Two primary scenarios are emerging from this pattern:

    Bullish Scenario:

    • Breakout above $86,000 could trigger a rally toward $90,000-$95,000
    • Volume increase above resistance would confirm bullish momentum
    • Key support at $82,000 must hold to maintain upward bias

    Bearish Scenario:

    • Break below $82,000 could lead to a decline toward $70,000
    • Current bull score of 10 suggests caution
    • Critical buy zones identified at $85,470 and $92,950

    Market Context and Trading Implications

    This pattern formation comes at a crucial time for Bitcoin, as the cryptocurrency has shown remarkable stability despite traditional market turbulence. Traders should consider several factors:

    • Volume patterns during breakout attempts
    • Previous support/resistance levels
    • Overall market sentiment and momentum

    FAQ Section

    What is a triangle pattern in crypto trading?

    A triangle pattern is a technical chart formation where price action converges between two trend lines, indicating a potential breakout point.

    How reliable are triangle patterns for predicting price movements?

    Triangle patterns have historically shown 75% reliability in crypto markets when accompanied by proper volume confirmation.

    What timeframe should traders watch for the breakout?

    The current pattern is forming on the 4-hour timeframe, suggesting a breakout could occur within the next 1-2 weeks.

    At time of writing, Bitcoin trades at $83,070, maintaining position within the triangle pattern as traders await confirmation of the next major move.

  • Bitcoin Capital Inflows Surge 350% as Market Tests $81K Support

    Bitcoin’s market dynamics are showing a remarkable shift as fresh capital floods into the crypto ecosystem, despite ongoing price pressures near critical support levels. While short-term holders remain cautious, institutional interest appears to be mounting significantly.

    Record-Breaking Capital Inflows Signal Market Confidence

    According to recent Glassnode data, crypto market capital inflows have experienced an unprecedented 350% surge over just two weeks, jumping from $1.82 billion to $8.20 billion. This dramatic increase suggests institutional investors are positioning themselves for potential market recovery, even as Bitcoin tests support at $81,000.

    SPONSORED

    Trade Bitcoin with up to 100x leverage and maximize your profit potential

    Trade Now on Defx

    Market Pressures and Technical Analysis

    The current market faces significant headwinds from macroeconomic factors, particularly Trump’s recent tariff announcements that have rattled global markets. Bitcoin’s price action shows:

    • Current trading range: $81,000 – $90,000
    • Critical support level: $81,000
    • Key resistance: $85,500 (aligned with 4H 200MA)
    • 22% drawdown from all-time high

    Institutional Interest Despite Market Uncertainty

    The surge in capital inflows presents a stark contrast to current price action, suggesting smart money may be accumulating during this period of uncertainty. This pattern often precedes significant market movements, as institutional investors typically position themselves before retail sentiment shifts.

    Looking Ahead: Key Levels to Watch

    For Bitcoin to establish a meaningful recovery, several technical levels require attention:

    • Primary resistance: $85,500
    • Secondary target: $88,000 – $90,000 range
    • Support floor: $81,000

    FAQ Section

    Q: What’s driving the surge in capital inflows?
    A: Institutional investors appear to be positioning for potential market recovery, with on-chain data showing a 350% increase in capital movement.

    Q: How significant is the $81,000 support level?
    A: This level represents a critical floor that, if broken, could trigger a deeper correction phase in the market.

    Q: What impact are Trump’s tariffs having on Bitcoin?
    A: The tariffs have increased market uncertainty and volatility, contributing to current selling pressure.

    Time to read: 5 minutes