Key Takeaways:
- Bitcoin trades between $109,748-$109,818 with $2.18T market cap
- 24-hour trading volume reaches $38.10B amid strong momentum
- Price consolidation suggests potential for further upside
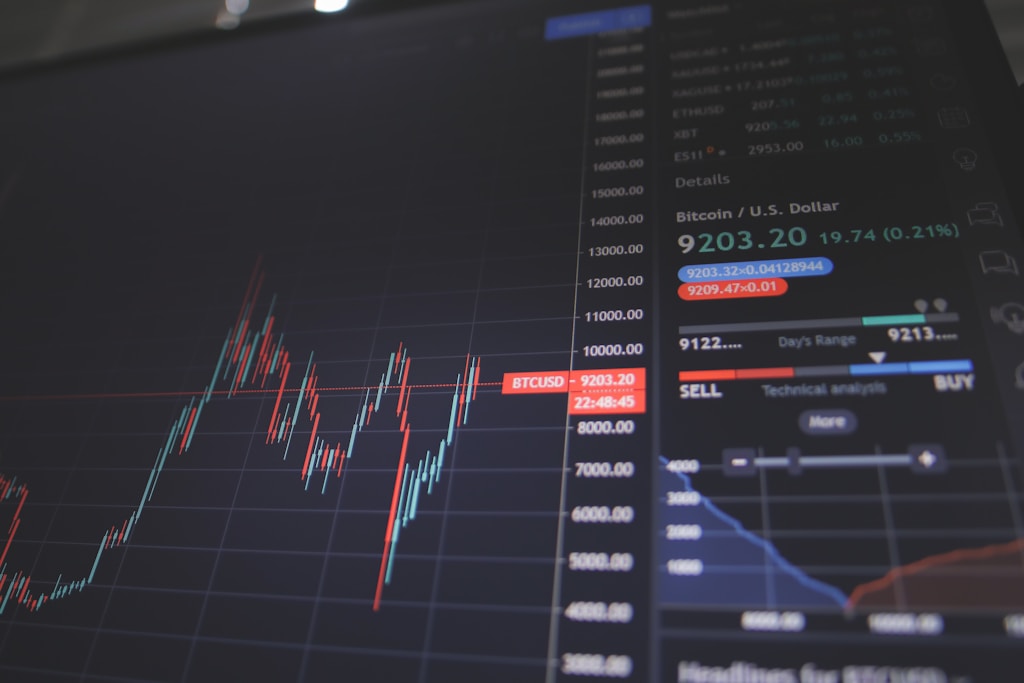
Bitcoin continues to demonstrate remarkable strength as it maintains its position above the crucial $109,000 level, following last week’s surge that liquidated $81M in short positions. The leading cryptocurrency is currently trading in a tight range between $109,748 and $109,818 as of Tuesday morning ET.
The market capitalization stands at an impressive $2.18 trillion, while the 24-hour trading volume of $38.10 billion indicates robust market participation. This sustained activity comes as on-chain metrics signal strong accumulation near these levels.
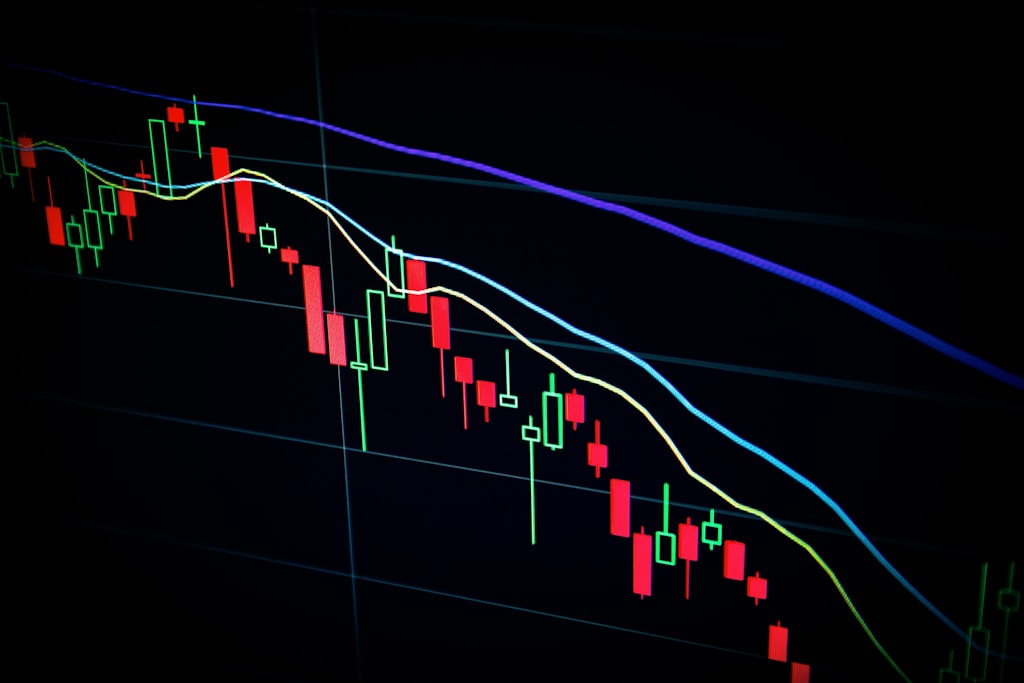
Technical Analysis and Market Structure
The intraday trading range of $107,115 to $110,282 reveals significant buyer support at lower levels, with bulls defending the psychological $107K support zone. The consolidation pattern forming near all-time highs suggests potential for another leg up if current levels hold.
SPONSORED
Trade Bitcoin with up to 100x leverage and maximize your profit potential
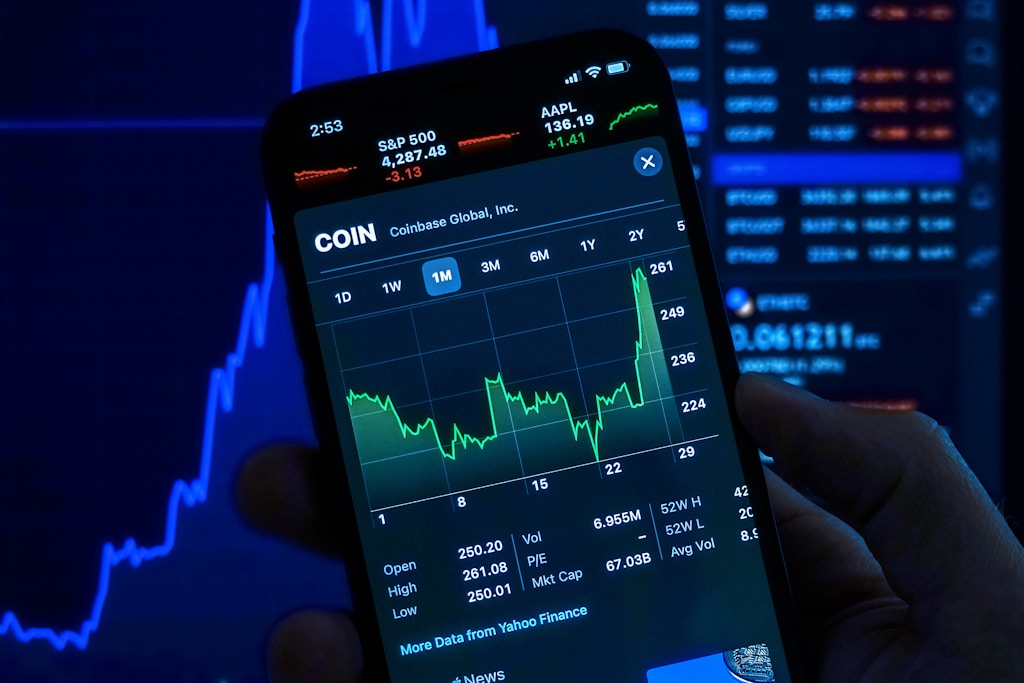
Market Sentiment and Institutional Interest
The sustained price action above $109K comes amid increasing institutional adoption, with BlackRock’s IBIT ETF recently hitting $70B in AUM. This institutional backing provides crucial support for current price levels.
FAQs
- What’s the next major resistance level for Bitcoin?
The immediate resistance lies at $110,282, with the psychological $111K level serving as the next major barrier. - Is the current consolidation bullish or bearish?
The high-level consolidation with strong volume typically suggests bullish continuation, especially given the recent market structure. - What factors are supporting the current price levels?
Institutional adoption, strong on-chain metrics, and sustained retail interest are key factors maintaining current price levels.
Traders should monitor key support levels and volume patterns for potential breakout signals as Bitcoin continues its impressive 2025 performance.