Tag: Cme Futures

  • XRP Futures Launch on CME Sparks Major Institutional Milestone

    XRP Futures Launch on CME Sparks Major Institutional Milestone

    In a groundbreaking development for the XRP ecosystem, the cryptocurrency has achieved a significant institutional milestone with the launch of XRP futures contracts on CME Group, marking a new era of mainstream adoption for the digital asset. This launch coincides with growing technical indicators suggesting a potential breakout to $2.40.

    CME’s XRP Futures Launch: A Game-Changing Development

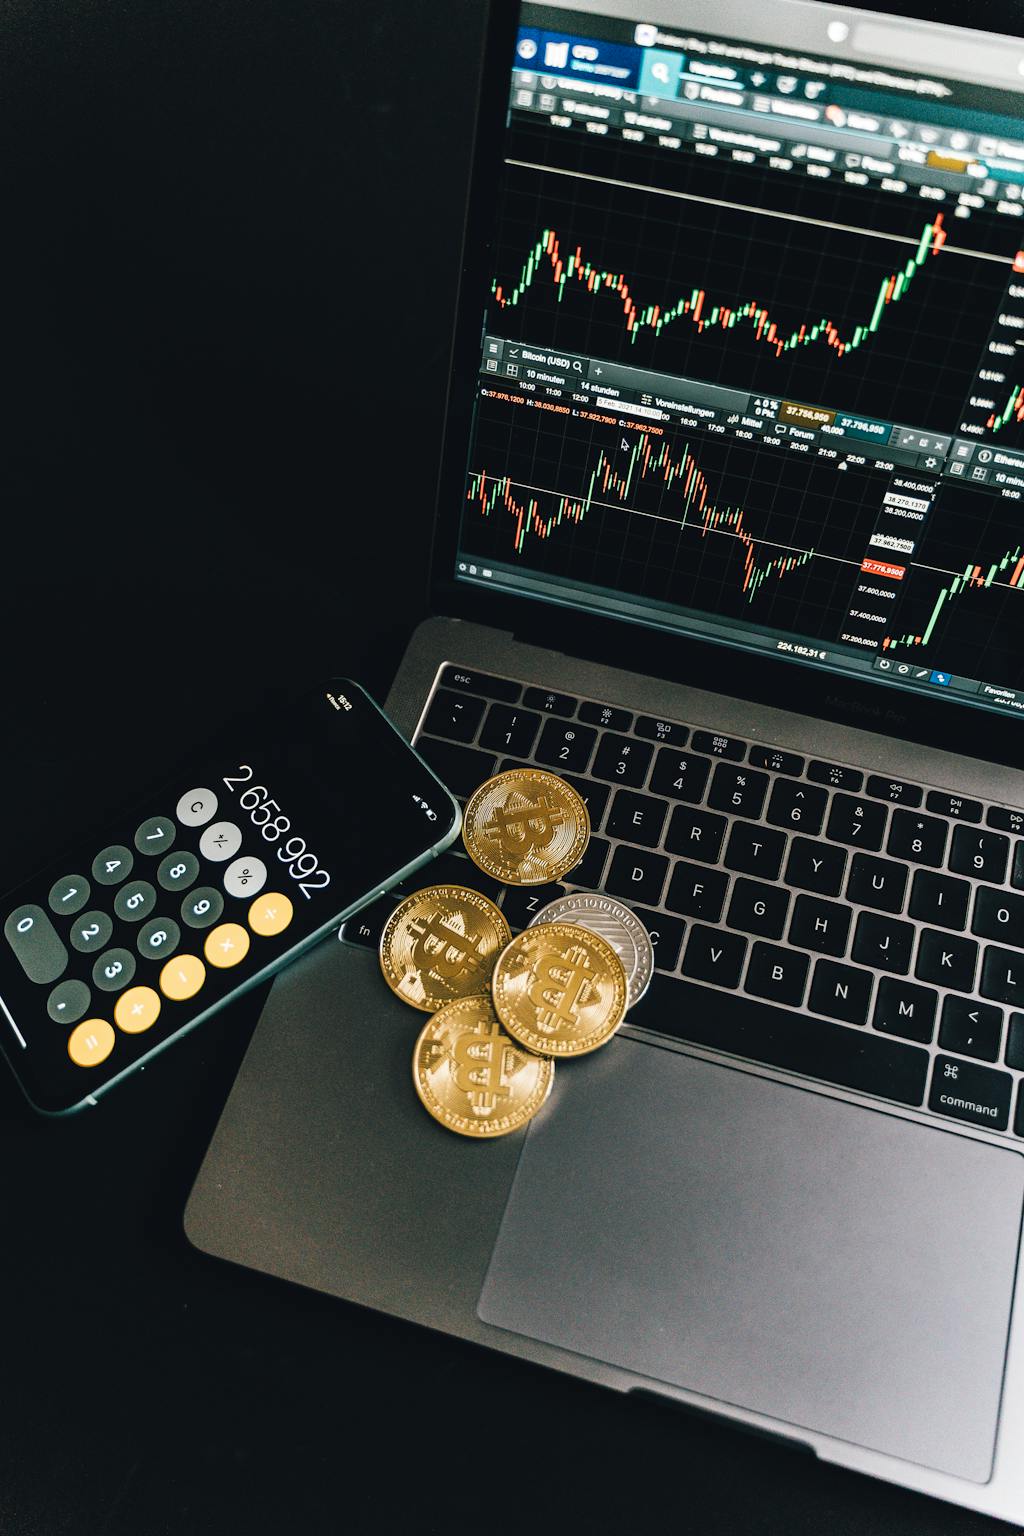
    The introduction of XRP futures on CME Group represents a watershed moment for institutional crypto adoption. The launch features two distinct contract sizes:

    • Standard XRP futures (50,000 XRP per contract)
    • Micro XRP futures (2,500 XRP per contract)

    On day one, the platform recorded an impressive $19 million in notional trading volume, demonstrating strong institutional appetite for XRP derivatives products. This development puts XRP in the same league as Bitcoin and Ethereum, which have both benefited significantly from their CME futures listings.

    SPONSORED

    Trade XRP futures with up to 100x leverage on perpetual contracts

    Trade Now on Defx

    Institutional Impact and Market Implications

    Brad Garlinghouse, Ripple’s CEO, highlighted the significance of this development on social media platform X, confirming that Hidden Road, a major institutional trading firm, had already executed the first block trade. This early adoption by institutional players suggests growing confidence in XRP as a mainstream financial asset.

    Security Concerns Amid Market Evolution

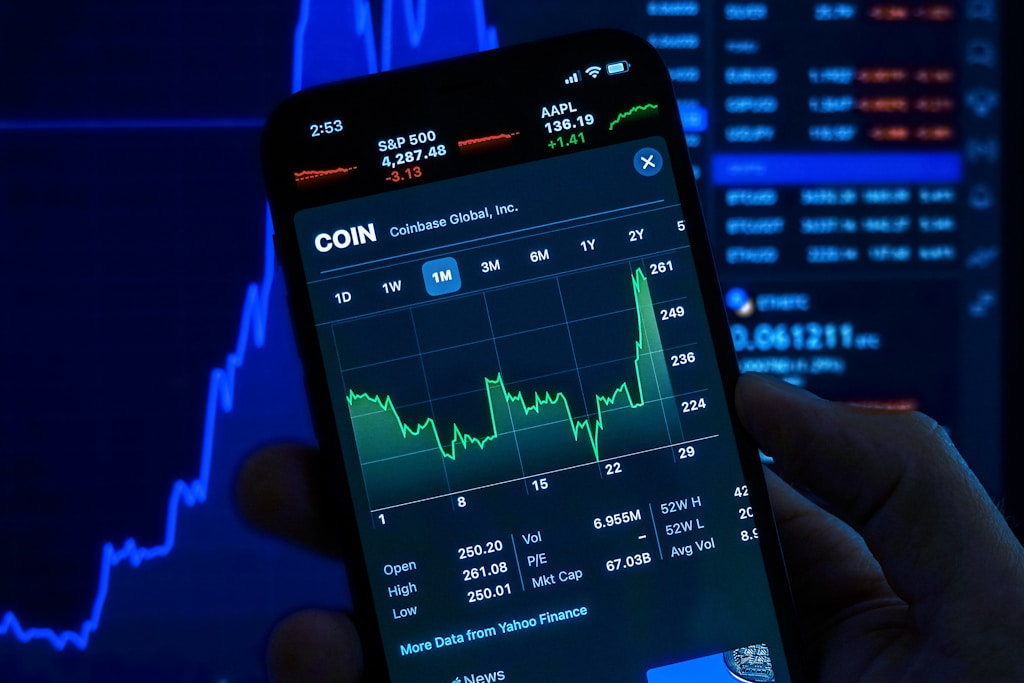
    Following the futures launch announcement, Ripple issued an important security alert to the XRP community. The warning comes amid increasing reports of crypto-related scams, including a recent Coinbase data breach affecting over 69,000 users. Key security recommendations include:

    • Never sending XRP to unknown addresses
    • Verifying all communication channels
    • Avoiding suspicious links and offers
    • Double-checking official account credentials

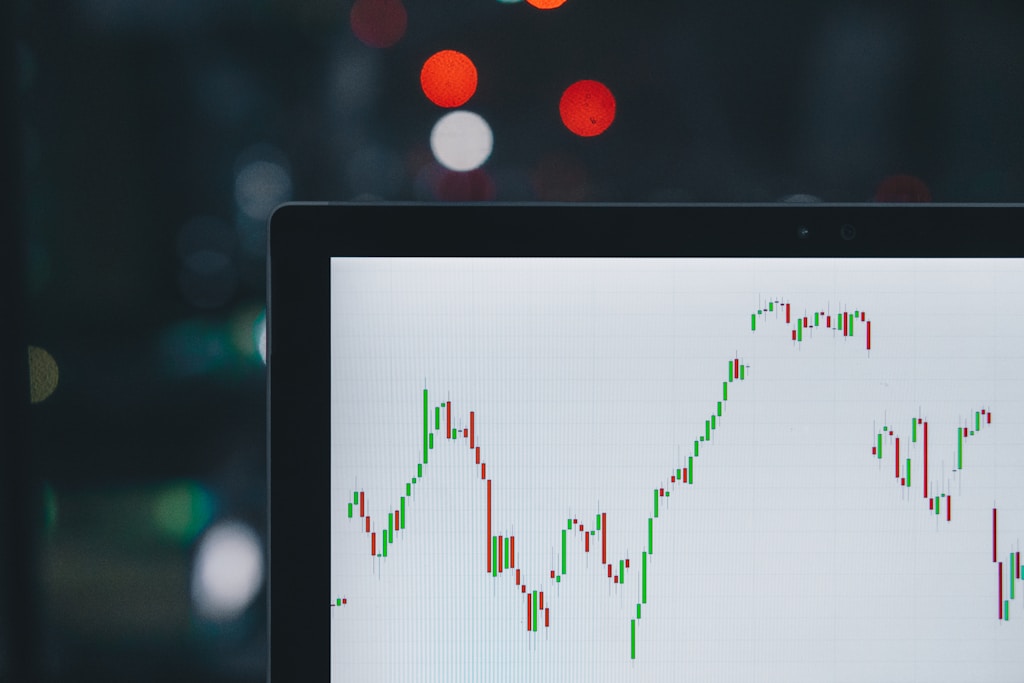
    Market Performance and Technical Analysis

    XRP is currently trading at $2.35, showing an 8.7% decline over the past week. However, the CME futures launch could potentially catalyze new price momentum, especially considering the growing institutional interest in crypto derivatives.

    Frequently Asked Questions

    What are XRP futures contracts?

    XRP futures are derivative contracts that allow investors to speculate on the future price of XRP without holding the actual cryptocurrency. They’re particularly useful for institutional investors seeking regulated exposure to crypto markets.

    How do CME’s XRP futures differ from other crypto derivatives?

    CME’s XRP futures are cash-settled and trade on a regulated exchange, offering institutional investors a compliant way to gain exposure to XRP price movements.

    What impact might this have on XRP’s price?

    While historical patterns suggest increased institutional access could lead to greater price stability and potential appreciation, investors should conduct thorough research and consider market risks before trading.

  • XRP Price Target $5: Raoul Pal Predicts New All-Time High Rally

    Renowned crypto strategist Raoul Pal has issued a bullish forecast for XRP, projecting significant upside potential that could drive the digital asset to a new all-time high of $5. This analysis comes at a crucial time as XRP faces key resistance levels around $2.47.

    Technical Analysis Points to Bullish Continuation Pattern

    In a detailed YouTube analysis, Pal highlighted a compelling bull flag formation that has developed since XRP’s parabolic move to $2. This technical pattern, typically a continuation signal, suggests the current consolidation phase could precede another significant upward movement.

    SPONSORED

    Trade XRP with up to 100x leverage on perpetual contracts

    Trade Now on Defx

    Institutional Catalysts Support Bullish Outlook

    The recent launch of CME XRP futures and Micro XRP futures represents a significant milestone for institutional adoption. These products provide regulated exposure to XRP for institutional investors and could pave the way for a potential Spot XRP ETF approval.

    Short-term Price Targets and Support Levels

    Multiple analysts have weighed in with technical perspectives:

    • Ali Martinez: Identifies critical support at $2.30
    • CasiTrades: Warns of potential correction below $2.60
    • Dark Defender: Projects $3.333 target after completion of Wave 2

    Key Support and Resistance Levels

    Support Levels Resistance Levels
    $2.3502 $2.58
    $2.2222 $3.3333

    FAQ Section

    What is the current XRP price?

    XRP is currently trading at $2.38, showing a 2% increase in the last 24 hours according to CoinMarketCap data.

    What factors could drive XRP to $5?

    Key catalysts include institutional adoption through CME futures, potential ETF approval, and technical breakout from the current consolidation pattern.

    What are the immediate price risks?

    The main downside risk is a break below $2.30 support, which could trigger a retracement to $2.00 levels.

    Investors should monitor these key levels and catalysts while maintaining appropriate risk management strategies in this volatile market environment.

  • Ethereum Price Crashes 14% to $1,540: CME Gaps Show $3,933 Target

    Ethereum Price Crashes 14% to $1,540: CME Gaps Show $3,933 Target

    Ethereum’s price has entered a sharp downtrend, plummeting 14.5% in the past 24 hours as broader crypto market weakness intensifies. The second-largest cryptocurrency by market cap lost critical support at $1,800, with analysts now eyeing potential drops to the $1,000-$1,500 range. This decline comes amid a broader crypto market selloff that has erased over $160 billion in value.

    Market Analysis: Support Levels Crumble as Bears Take Control

    Crypto analyst Andrew Kang has taken a notably bearish stance on Ethereum’s current valuation, describing its $215 billion market cap as “ridiculous” given what he terms as negative growth metrics. The rapid validation of his concerns is evident in ETH’s market cap decline to $186.5 billion, suggesting deteriorating investor confidence.

    SPONSORED

    Trade Ethereum with up to 100x leverage on perpetual contracts

    Trade Now on Defx

    Technical Analysis: CME Gaps Point to Potential Recovery

    Despite the bearish price action, Ethereum’s CME futures chart reveals three significant gaps above current levels that historically tend to fill:

    • Gap 1: $2,550 – $2,625
    • Gap 2: $2,890 – $3,050
    • Gap 3: $3,917 – $3,933 (partially filled)

    Recent data showing Ethereum exchange reserves at a 2-year low could provide fundamental support for a potential recovery, though immediate upside appears limited given current market conditions.

    Short-term Outlook and Key Levels to Watch

    The immediate focus remains on the critical $1,500 support level. A break below could accelerate selling pressure toward $1,000. However, with Q2 2025 just beginning, there’s still potential for sufficient buying pressure to emerge and target those unfilled CME gaps.

    FAQ Section

    Q: What is causing Ethereum’s price crash?
    A: The decline is part of a broader crypto market selloff, with specific pressure from deteriorating investor confidence and technical support breaks.

    Q: Can Ethereum recover to $3,933?
    A: While CME gaps suggest potential upside to this level, immediate recovery appears unlikely given current market conditions.

    Q: What are the key support levels to watch?
    A: The critical support level is $1,500, with $1,000 serving as the next major support if current levels fail to hold.

  • Bitcoin CME Gap Targets $83K: Critical Support Levels Revealed

    Bitcoin (BTC) is approaching a significant technical milestone as price action converges toward the anticipated Chicago Mercantile Exchange (CME) gap close near $83,000. This development comes amid increasing market volatility and could signal a crucial turning point for the leading cryptocurrency. Recent analysis of Bitcoin’s key support levels aligns with current market movements.

    CME Gap Analysis and Price Targets

    According to crypto analyst Astronomer, Bitcoin is likely to test the critical support zone between $83,000 and $84,000, coinciding with the CME gap closure. This technical phenomenon occurs when weekend trading creates price disparities between CME futures and spot markets.

    SPONSORED

    Trade Bitcoin with up to 100x leverage and maximize your profit potential

    Trade Now on Defx

    Support Levels and Trading Outlook

    Key technical levels to watch include:

    • Primary support: $83,000 – $84,000 range
    • Secondary support: $81,400 – $82,400 zone
    • Potential bounce target: $86,000 (weekly open)
    • Take profit levels: Multiple targets up to $88,000

    Market Indicators and Historical Patterns

    Historical data suggests bearish Friday closes often precede negative price action early the following week. The pre-New York Open (NYO) phase currently leaves room for potential intraday reversals, while the lack of significant liquidations could indicate further downside potential.

    Recovery Scenarios and Risk Factors

    While short-term bearish signals dominate, the macro trend remains stable. A successful hold at the CME gap level could trigger a recovery toward $86,000, with further upside potential to $88,000. However, traders should monitor the worst-case support zone at $81,400 – $82,400, as a break below could accelerate selling pressure.

    Frequently Asked Questions

    What is a CME gap in Bitcoin trading?

    A CME gap occurs when Bitcoin’s price moves during weekend hours when the CME futures market is closed, creating a price disparity that often gets filled during regular trading hours.

    Why are the $83,000-$84,000 levels significant?

    These levels represent both the CME gap closure target and a crucial technical support zone that could determine Bitcoin’s next major price movement.

    What could trigger a bearish scenario?

    A break below the $81,400 support level could signal increased selling pressure and potentially lead to a deeper market correction.

  • Bitcoin CME Gap at $84K Signals Potential Price Correction Ahead

    Bitcoin CME Gap at $84K Signals Potential Price Correction Ahead

    Bitcoin CME Gap at $84K Signals Potential Price Correction Ahead

    Bitcoin’s weekend surge to $87,800 has created a notable CME futures gap, potentially signaling an imminent price correction. This development comes as Bitcoin continues testing crucial support levels around $85K, with market analysts closely monitoring technical indicators.

    Understanding the Latest CME Gap

    The CME futures gap emerged when Friday’s closing price of $84,190 was followed by Monday’s opening at $85,160, creating a $970 price differential. This gap formation is particularly significant given Bitcoin’s historical tendency to ‘fill’ such gaps with subsequent price movements.

    Key Gap Details:

    • Friday Close: $84,190
    • Monday Open: $85,160
    • Gap Size: Approximately $970
    • Current BTC Price: $87,800

    Historical Context and Market Implications

    Bitcoin’s recent price action follows a pattern of gap-filling behavior that has become increasingly reliable for traders. The most recent example occurred in mid-March when Bitcoin filled a gap created during the November rally, dropping to $76,700.

    Why CME Gaps Matter

    CME gaps form due to the difference in trading hours between spot markets and CME futures:

    • Spot Bitcoin: 24/7 trading
    • CME Futures: 23 hours/day, Sunday through Friday
    • Gap Formation: Occurs during CME’s off-hours when significant price movements happen

    SPONSORED

    Trade Bitcoin with up to 100x leverage on perpetual contracts

    Trade Now on Defx

    Technical Analysis and Price Projections

    Based on historical patterns and current market dynamics, traders should watch for potential retracement to the $84,000–$85,000 range. This aligns with recent technical analysis suggesting strong support levels in this zone.

    FAQ Section

    What is a CME futures gap?

    A CME futures gap occurs when there’s a difference between the closing price of Bitcoin futures on Friday and the opening price on the following trading day, typically due to weekend price movements in the 24/7 spot market.

    How reliable are CME gaps as price indicators?

    Historical data shows that approximately 95% of CME gaps eventually get filled, making them a reliable indicator for potential price movements, though timing can vary significantly.

    What factors could prevent the gap from filling?

    Strong fundamental catalysts, significant institutional buying, or major market news could potentially override the technical pressure to fill the gap.

    Market Impact and Trading Considerations

    Traders should consider this technical indicator alongside other market factors, including:

    • Overall market sentiment
    • Trading volume patterns
    • Support and resistance levels
    • Institutional flow data

    As the market digests this technical development, traders should maintain appropriate risk management strategies and monitor key support levels around the gap zone.

  • Bitcoin Open Interest Drops $10B: Market Enters Key Consolidation Phase

    Bitcoin’s market dynamics are showing significant shifts as CME Open Interest experiences its largest-ever decline, signaling a potential consolidation phase while BTC holds above $85,000. This comprehensive analysis explores what this means for traders and investors.

    Key Market Indicators Point to Consolidation

    The cryptocurrency market’s flagship asset is witnessing a remarkable transformation in its trading patterns. As Bitcoin maintains its position above $85,000, institutional trading metrics reveal a significant cooling period may be ahead.

    According to data from Alphractal, Bitcoin’s CME Open Interest has recorded its most substantial decline ever, with approximately $10 billion worth of positions closed over the past 90 days. This unprecedented drop suggests a major shift in institutional trading behavior.

    Understanding the Open Interest Decline

    • 90-day Delta: -$10 billion (largest recorded drop)
    • 30-day Delta: Decline stabilizing
    • 7-day Delta: Turning positive

    SPONSORED

    Trade Bitcoin with up to 100x leverage and maximize your profit potential

    Trade Now on Defx

    Whale Activity Signals Strong Accumulation

    Despite the declining open interest, large-scale Bitcoin accumulation continues. Market data reveals that addresses holding 1,000+ BTC have acquired approximately:

    • 1 million BTC since November 2024
    • 200,000 BTC in March 2025 alone

    Market Implications and Trading Outlook

    The current market structure suggests several key developments:

    1. Short-term selling pressure reduction
    2. Medium-term consolidation phase
    3. Long-term accumulation by institutional players

    Frequently Asked Questions

    What does declining open interest mean for Bitcoin’s price?

    Declining open interest typically indicates a reduction in leveraged positions and can lead to decreased volatility and price consolidation.

    How long might this consolidation phase last?

    Based on historical patterns and current market indicators, the consolidation phase could extend for several weeks to months.

    What are the key price levels to watch?

    Current support lies at $85,000, with major resistance at $90,000 and $95,000 levels.

    As the market enters this crucial consolidation phase, traders should maintain vigilant position management and watch for potential breakout signals in either direction.

  • Bitcoin CME Gap Alert: $78K Support Test Looms! 📉

    Bitcoin CME Gap Alert: $78K Support Test Looms! 📉

    Critical Bitcoin Price Level in Focus as CME Gap Threatens Market

    A significant Bitcoin Chicago Mercantile Exchange (CME) gap has emerged between $78,000 and $80,700, setting up a crucial price test that could determine Bitcoin’s next major move. Recent market analysis suggests this support zone could be critical for maintaining Bitcoin’s bullish momentum.

    Understanding the CME Gap Phenomenon

    The CME gap phenomenon occurs due to Bitcoin futures trading hours being limited to weekdays, while spot markets trade 24/7. When significant price movements happen during weekend hours, these gaps typically get filled as markets seek equilibrium. The current gap, formed during Bitcoin’s November 2024 rally above $100,000, represents a key technical level that traders are watching closely.

    SPONSORED

    Trade Bitcoin with up to 100x leverage on perpetual contracts

    Trade Now on Defx

    Market Implications and Expert Analysis

    According to renowned crypto analyst Rekt Capital, Bitcoin’s current price action at $79,267 places it precariously close to the CME gap range. Historical data suggests that 90% of CME gaps eventually get filled, making the $78,000-$80,700 range particularly significant for traders.

    Technical Support Levels to Watch

    • Primary Support: $78,000 – $80,700 (CME gap range)
    • Secondary Support: $71,535
    • Critical Support: $60,590

    Oversold Conditions Signal Potential Reversal

    Adding to the technical picture, Bitcoin has entered oversold territory for the first time since August 2024. Analyst Ali Martinez notes that previous instances of oversold conditions in 2024 preceded average price rallies of 33%, suggesting potential upside if historical patterns repeat.

    Market Outlook and Trading Implications

    The convergence of the CME gap and oversold conditions creates a compelling technical setup for Bitcoin traders. While the immediate trend appears bearish, the historical tendency for gaps to fill combined with oversold conditions could provide a foundation for a significant bounce.

    Traders should monitor the following scenarios:

    • Bullish Case: Strong support at the CME gap level could trigger a relief rally
    • Bearish Case: Failure to hold $78,000 could accelerate selling pressure
    • Neutral Case: Consolidation within the gap range as markets seek equilibrium

    Source: NewsBTC