
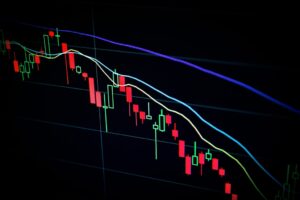
Solana Price Crashes Below $100: Analyst Warns of 80% Drop Ahead
Solana (SOL) has plunged below the critical $100 support level for the first time in over 12 months, as intense...
Solana (SOL) has plunged below the critical $100 support level for the first time in over 12 months, as intense...

The U.S. Securities and Exchange Commission (SEC) is preparing to host a landmark crypto roundtable that could fundamentally reshape digital...

Strategy (formerly Microstrategy) has reported a staggering $5.91 billion unrealized loss on its Bitcoin holdings for Q1 2025, as Bitcoin...
A prominent crypto analyst has issued a stark warning about Bitcoin's price trajectory, suggesting a potential 60% crash to $49,000...
Bitcoin's price action turned extremely volatile on Monday, with the leading cryptocurrency experiencing a dramatic $4,000 trading range amid escalating...

Bloomberg Intelligence's senior commodity strategist Mike McGlone has issued a stark warning about Bitcoin's price trajectory, suggesting the leading cryptocurrency...

Strategy's $6B Bitcoin Loss Signals Market Pressure at $77K Level In a significant market development, Strategy (MSTR) has announced an...
XRP's price action has taken a bearish turn as the cryptocurrency breaks below a critical $2.00 support level, confirming a...

Bitcoin Crashes Below $75K as Trump Tariffs Spark Fed Rate Cut Push Bitcoin plunged below the critical $75,000 level on...
XRP's price has entered bearish territory, plummeting below the critical $2.00 psychological level in a move that mirrors the broader...


