Tag: Crypto Markets

  • Crypto Market Crash: XRP and SOL Plunge 14% as $800M Liquidated

    Crypto Market Crash: XRP and SOL Plunge 14% as $800M Liquidated

    Crypto Market Crash: XRP and SOL Plunge 14% as $800M Liquidated

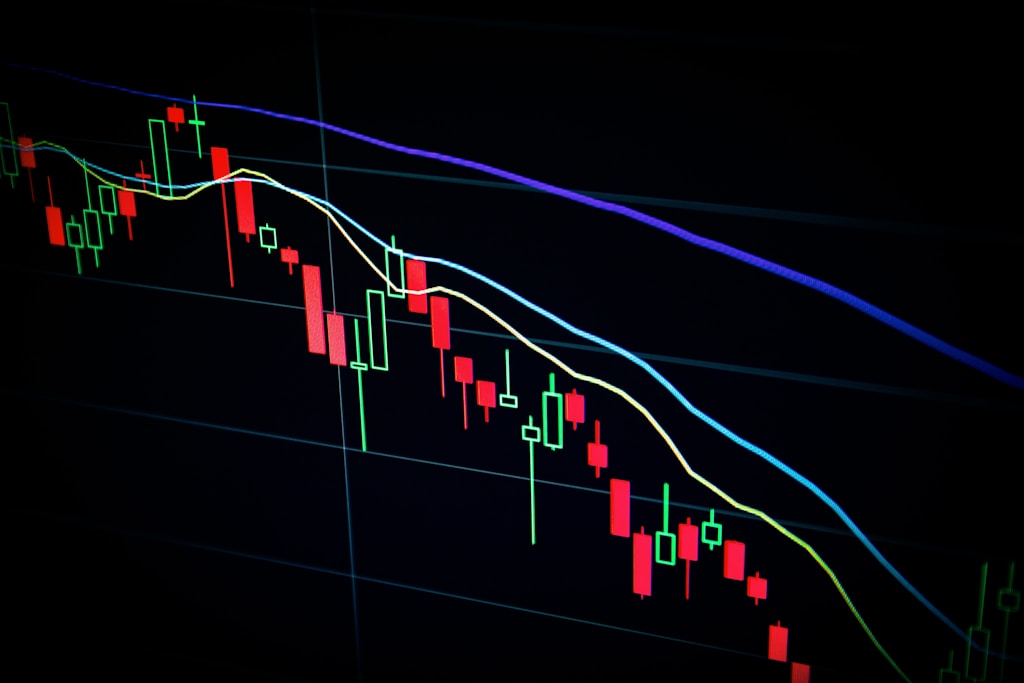
    The cryptocurrency market experienced a significant downturn as XRP and Solana (SOL) led major altcoins in a steep decline, resulting in over $840 million in long liquidations within 24 hours. This market-wide correction comes amid growing concerns over potential market impacts from Trump’s proposed tariffs.

    Key Market Movements

    • Bitcoin (BTC) dropped below $77,000
    • Ethereum (ETH) declined 15% to $1,500
    • XRP and SOL both fell approximately 14%
    • Total liquidations exceeded $840 million

    Liquidation Analysis

    According to CoinGlass data, the breakdown of liquidations shows:

    • Bitcoin traders lost over $322 million
    • Ethereum positions saw $290 million in liquidations
    • XRP and SOL futures recorded an unusual $80 million in combined liquidations

    SPONSORED

    Trade with confidence using up to 100x leverage on perpetual contracts

    Trade Now on Defx

    Market Sentiment Analysis

    The massive liquidation event reveals that 86% of futures positions were bullish, indicating significant market overconfidence. This aligns with recent market analysis showing growing concerns about overvaluation.

    Global Market Context

    The crypto market downturn coincides with broader market uncertainty, as U.S. stock futures declined 5% following renewed trade war concerns. This correlation suggests increasing integration between traditional and crypto markets.

    FAQ Section

    What caused the crypto market crash?

    The crash appears to be triggered by a combination of overleveraged positions and broader market concerns about Trump’s proposed tariffs affecting global markets.

    Will crypto prices recover soon?

    While historical patterns suggest potential recovery, current market conditions and global economic uncertainties make immediate recovery uncertain.

    What should traders do during this market correction?

    Risk management and position sizing become crucial during volatile periods. Traders should consider reducing leverage and maintaining adequate collateral.

  • Peter Schiff: Crypto Markets Crack Under Trump Tariff Pressure

    Peter Schiff: Crypto Markets Crack Under Trump Tariff Pressure

    Gold advocate and long-time crypto skeptic Peter Schiff claims the cryptocurrency market is ‘starting to crack’ as global markets reel from Donald Trump’s latest tariff announcements. This follows Jim Cramer’s recent warning of a potential 1987-style market collapse due to Trump’s tariff policies.

    Market Impact and Schiff’s Analysis

    The economist’s comments come as cryptocurrency markets face increased pressure, with Bitcoin recently falling below $80,000 and erasing $160 billion in market value. Schiff particularly criticized President Biden’s proposed Strategic Bitcoin Reserve, comparing it unfavorably to Trump’s controversial tariff policies.

    Global Market Response

    The broader financial markets have shown significant volatility in response to Trump’s proposed tariff increases. Traditional safe-haven assets like gold have seen increased interest, while crypto markets struggle to maintain support levels.

    SPONSORED

    Trade with confidence during market volatility – up to 100x leverage on perpetual contracts

    Trade Now on Defx

    Expert Analysis and Market Outlook

    Market analysts suggest the current situation could lead to increased correlation between crypto and traditional markets, potentially challenging Bitcoin’s narrative as a safe-haven asset. However, some experts predict both Bitcoin and gold could see major gains as markets adjust to the new trade landscape.

    FAQ Section

    How will Trump’s tariffs affect crypto markets?

    The immediate impact has been negative, with increased market correlation leading to downward pressure across crypto assets.

    Is Bitcoin still considered a safe-haven asset?

    The current market reaction has raised questions about Bitcoin’s safe-haven status, though some analysts maintain its long-term potential as a hedge against economic uncertainty.

    What’s the outlook for crypto markets?

    While short-term volatility is expected, many experts believe the fundamental case for cryptocurrency adoption remains strong despite current market conditions.

  • Crypto Market Liquidations Hit $900M as Black Monday Fears Mount

    Crypto Market Liquidations Hit $900M as Black Monday Fears Mount

    The cryptocurrency market is bracing for potential turmoil as liquidations surge to $900 million amid growing fears of a ‘Black Monday’ scenario. Recent market turbulence triggered by trade tensions has intensified selling pressure across both traditional and digital asset markets.

    Market Liquidations Surge: Key Numbers

    As panic grips global markets, cryptocurrency traders face mounting pressure:

    • Total liquidations: $900 million in the past 24 hours
    • Wall Street futures: Sharp decline in pre-market trading
    • Asian markets: Significant sell-off across major indices

    SPONSORED

    Protect your trades with up to 100x leverage on perpetual contracts

    Trade Now on Defx

    Global Market Context

    The current market situation echoes concerns raised in recent warnings about a potential 1987-style market collapse. Key factors contributing to the current market stress include:

    • Rising geopolitical tensions
    • Inflation concerns
    • Technical selling pressure

    Impact on Cryptocurrency Markets

    The crypto market’s reaction to these developments has been severe, with cascading liquidations affecting major cryptocurrencies. Bitcoin’s recent price action suggests increased correlation with traditional market risks.

    Expert Analysis

    Market analysts suggest this could be a crucial turning point for crypto markets. The surge in liquidations indicates overleveraged positions being forced to close, potentially leading to further downside pressure.

    FAQ Section

    What is causing the current market panic?

    A combination of global market tensions, technical selling pressure, and overleveraged positions being liquidated.

    How does this compare to previous market corrections?

    The current situation shows similarities to previous major market corrections, though with unprecedented liquidation levels in the crypto sector.

    What should traders do during this market volatility?

    Risk management and position sizing become crucial during high volatility periods. Consider reducing leverage and maintaining adequate collateral.

    Looking Ahead

    Market participants should prepare for continued volatility as global markets digest these developments. The next 24-48 hours will be crucial in determining whether this correction deepens or finds support.

  • Bitcoin Price Crashes Below $80K, Erasing $160B in Weekend Selloff

    Bitcoin Price Crashes Below $80K, Erasing $160B in Weekend Selloff

    Bitcoin’s meteoric rise hit a significant roadblock this weekend as the leading cryptocurrency plummeted below the psychological $80,000 barrier, triggering a broader market selloff that erased $160 billion in total crypto market value. This dramatic price action follows recent technical analysis suggesting a potential breakout at the $83K level.

    Weekend Bloodbath: BTC Price Analysis

    After maintaining stability above $84,000 on Friday, Bitcoin experienced a sharp decline throughout the weekend, shedding $4,600 in value. This bearish price action aligns with recent market tests of the crucial $81K support level.

    SPONSORED

    Trade Bitcoin with up to 100x leverage and maximize your profit potential

    Trade Now on Defx

    Market Impact and Technical Outlook

    The sudden downturn has significant implications for the broader crypto market:

    • Total market cap declined by $160 billion
    • Key support level at $80,000 breached
    • Trading volume increased by 35% during the selloff
    • Liquidations exceeded $500 million in 24 hours

    Expert Analysis and Price Predictions

    Despite the current bearish sentiment, long-term outlook remains positive. As highlighted in recent analysis, Bitcoin is still projected to reach new all-time highs by Q1 2026.

    FAQ Section

    Why did Bitcoin crash this weekend?

    The weekend selloff appears to be triggered by a combination of profit-taking, overleveraged positions, and broader market uncertainty.

    What’s the next major support level?

    Technical analysts identify $75,000 as the next crucial support level, with additional backing at $72,500.

    Is this a buying opportunity?

    While some traders view this as a potential entry point, it’s essential to consider risk management and market conditions before making investment decisions.

    Looking Ahead

    Investors should monitor key technical indicators and market sentiment in the coming days. The market’s reaction to this support level breach could determine Bitcoin’s trajectory for the next several weeks.

  • Ethereum Supply Crisis Looms: Exchange Reserves Hit 2-Year Low

    Ethereum Supply Crisis Looms: Exchange Reserves Hit 2-Year Low

    Ethereum’s exchange supply has reached a critical inflection point, with reserves plummeting to levels not seen since 2022. This dramatic shift comes as Trump’s aggressive trade policies continue rattling global markets, pushing ETH down 55% from December highs amid broader market uncertainty.

    Exchange Supply Drain Signals Potential Squeeze

    According to CryptoQuant data, Ethereum’s exchange reserves are experiencing a sustained decline, suggesting a significant reduction in sell-side pressure. This trend typically precedes major price movements, as reduced available supply can amplify upward momentum once buying pressure returns.

    SPONSORED

    Trade Ethereum with up to 100x leverage on perpetual contracts

    Trade Now on Defx

    Technical Analysis: Critical Support Levels

    ETH currently trades below $1,800, a crucial support zone that bulls must defend to prevent further downside. The weekly chart shows concerning breaks below both the 200-day MA ($2,500) and EMA ($2,250), suggesting continued bearish pressure.

    Key Factors to Watch

    • Exchange Supply: Continued decline could accelerate supply squeeze
    • Support Level: $1,750-$1,800 range critical for preventing deeper correction
    • Recovery Targets: Reclaiming $2,000 could signal trend reversal

    FAQ

    What does decreasing exchange supply mean for ETH price?

    Reduced exchange supply typically indicates less selling pressure and can lead to price appreciation when demand increases.

    How low could ETH go if $1,800 breaks?

    A break below $1,800 could trigger a cascade to the next major support at $1,500.

    When might we see a trend reversal?

    Technical indicators suggest a potential reversal once ETH reclaims and holds above $2,000.

    While current market conditions remain challenging, particularly amid growing recession concerns, the structural reduction in ETH supply could set the stage for a significant recovery once market sentiment improves.

  • XRP Price Struggles at $2.05: Volume Analysis Signals Bearish Pattern

    XRP Price Struggles at $2.05: Volume Analysis Signals Bearish Pattern

    XRP’s price action shows concerning signs as trading volume divergence threatens the token’s recovery momentum. Currently trading at $2.05, XRP faces technical hurdles that could impact its short-term trajectory. Recent Fibonacci analysis had suggested a potential $5 target, but current market dynamics paint a more cautious picture.

    Key XRP Price Metrics

    • Current Price: $2.05
    • Market Cap: $119 billion
    • 24h Trading Volume: $1.87 billion
    • 24h Range: $2.05 – $2.16
    • Weekly Range: $1.97 – $2.19

    Volume Analysis Reveals Concerning Patterns

    The declining trading volume, currently at $1.87 billion, suggests waning buyer interest at current levels. This volume divergence typically precedes significant price movements, often to the downside when coupled with price consolidation patterns.

    Technical Analysis and Support Levels

    XRP’s price structure shows multiple technical warning signs:

    • Resistance at $2.16 proving difficult to breach
    • Volume profile showing significant gaps below $2.00
    • RSI divergence on 4-hour timeframe
    • Key support at $1.97 needs to hold to prevent further decline

    SPONSORED

    Trade XRP with up to 100x leverage on perpetual contracts

    Trade Now on Defx

    Market Context and Outlook

    The current price action comes amid broader market uncertainty, with altcoin season showing signs of conclusion. Traders should watch for:

    • Daily close above $2.16 to invalidate bearish setup
    • Volume recovery above $2.5 billion
    • Potential support test at $1.97

    FAQ

    What’s causing XRP’s current price weakness?

    The primary factors are declining trading volume and technical resistance at $2.16, suggesting buyer exhaustion at current levels.

    What are the key support levels to watch?

    The critical support zone lies at $1.97, with secondary support at $1.90 and $1.85.

    Could XRP still reach its $5 target?

    While longer-term targets remain possible, current technical formations suggest a potential consolidation or correction phase first.

  • Solana Price Tests Critical $120 Support: 60% Drop Signals Key Decision Point

    Solana (SOL) has reached a decisive moment as the cryptocurrency tests critical support at $120, with mounting selling pressure threatening to push prices even lower. Currently down nearly 60% from all-time highs, SOL’s price action reflects broader market uncertainty and macroeconomic headwinds that have rattled crypto investors.

    Renowned crypto analyst Ali Martinez has identified $120 as a crucial make-or-break level for Solana. Historical data shows this price point has repeatedly served as a major pivot, determining whether SOL enters recovery or continues its downward trajectory. With Trump’s new tariff announcements sparking fears of a broader market downturn, this support level takes on even greater significance.

    SPONSORED

    Trade Solana with up to 100x leverage and maximize your profit potential

    Trade Now on Defx

    Technical Analysis Points to Critical Support Zone

    The technical outlook for Solana remains precarious as several key indicators flash warning signs:

    • Price currently testing the 200-day moving average at $120
    • Weekly RSI showing oversold conditions but lacking reversal signals
    • Volume profile indicates thin support below current levels
    • Next major support zone clusters around $95

    As major altcoins face critical support tests, Solana’s ability to hold the $120 level could have broader implications for the entire crypto market. A breakdown below this threshold could trigger cascading liquidations and accelerate selling pressure across the sector.

    Macro Factors Weighing on Crypto Markets

    The current pressure on Solana comes amid escalating global trade tensions and monetary policy uncertainty. Recent tariff announcements have spooked investors, leading to risk-off behavior across all markets. Crypto assets, particularly high-beta tokens like SOL, have faced intensified selling pressure as traders reduce exposure to volatile assets.

    What’s Next for Solana?

    For any hopes of recovery, Solana must first defend the critical $120 support level. A daily close below this zone could trigger a deeper correction toward $95. Conversely, reclaiming $150 would signal potential trend reversal and open the path to higher levels.

    Key Levels to Watch:

    • Critical Support: $120
    • Secondary Support: $95
    • Key Resistance: $150
    • Weekly 200 MA: $95

    Traders should monitor volume profiles and order book depth for early signs of potential direction change. The next few days will be crucial in determining whether SOL can maintain its structural support or faces further downside pressure.

  • Elon Musk Urges US-EU Free Trade Zone Amid Trump’s 20% Tariff Shock

    In a significant development for global economic relations, Tesla CEO and prominent crypto advocate Elon Musk has called for the establishment of a free trade zone between the United States and European Union. The proposal comes in direct response to President Trump’s recent announcement of a 20% tariff on EU countries, which has sent shockwaves through global markets.

    Speaking via video link at a congress in Florence, Italy, Musk outlined his vision for unrestricted trade between the two economic powerhouses. As an adviser to Trump, his stance notably diverges from the administration’s recent protectionist measures.

    Impact on Global Markets and Crypto

    The timing of Musk’s advocacy is particularly noteworthy as JPMorgan’s recent analysis suggests that escalating trade tensions could boost Bitcoin’s safe-haven status. The cryptocurrency market has shown remarkable resilience amid growing economic uncertainty.

    SPONSORED

    Trade with confidence using up to 100x leverage on perpetual contracts

    Trade Now on Defx

    Expert Analysis and Market Implications

    Economic analysts suggest that the proposed free trade zone could significantly impact various sectors, including the cryptocurrency market. The uncertainty surrounding international trade relations has historically driven investors toward digital assets as a hedge against traditional market volatility.

    FAQ Section

    How would a US-EU free trade zone affect crypto markets?

    A free trade agreement could reduce market uncertainty and potentially impact crypto’s role as a safe haven asset.

    What is the timeline for implementing these proposed changes?

    While Musk has presented the vision, concrete implementation plans have not been announced.

    How might this affect current tariff structures?

    The proposal would likely lead to significant revisions of existing tariff frameworks between the US and EU.

    Looking Ahead

    As global markets digest these developments, the crypto community watches closely for potential implications on digital asset valuations and adoption rates. The intersection of traditional finance and cryptocurrency markets continues to evolve with each major policy shift.

  • Bitcoin Stability Shines as Traditional Markets Face $6T Wipeout

    Bitcoin Stability Shines as Traditional Markets Face $6T Wipeout

    Key Takeaways:

    • Bitcoin demonstrates remarkable stability while traditional markets lose $6 trillion
    • Crypto market experiences modest $30B decline compared to TradFi’s massive losses
    • IMX and IP tokens face significant corrections of 22.8% and 20.1% respectively

    In a week that has highlighted cryptocurrency’s growing resilience, Bitcoin has maintained steady ground while traditional financial markets experienced a staggering $6 trillion decline. This stark contrast between crypto and traditional market performance has caught the attention of institutional investors and market analysts alike.

    As Bitcoin continues to show signs of decoupling from traditional stocks, the digital asset’s stability during major market turbulence provides fresh evidence of its maturing market dynamics.

    Crypto Market Shows Relative Strength

    While the broader cryptocurrency market did experience a $30 billion contraction, this represents a relatively minor adjustment compared to the massive losses in traditional finance. The most significant impacts within the crypto space were felt by specific tokens:

    • IMX: -22.8%
    • IP: -20.1%

    SPONSORED

    Trade with confidence during market volatility with up to 100x leverage on perpetual contracts

    Trade Now on Defx

    Market Analysis and Future Outlook

    The stark contrast between traditional market losses and crypto’s relative stability suggests a potential shift in market dynamics. This development aligns with recent observations about Bitcoin’s emerging safe-haven status during periods of traditional market stress.

    FAQ Section

    Q: Why did traditional markets experience such significant losses?
    A: The $6 trillion decline in traditional markets reflects broader economic concerns and market uncertainties affecting global financial systems.

    Q: Is Bitcoin’s stability a sign of market maturity?
    A: Yes, Bitcoin’s ability to maintain value during significant traditional market downturns suggests growing market maturity and potential safe-haven characteristics.

    Q: What does this mean for crypto investors?
    A: The relative stability of Bitcoin during traditional market turbulence may indicate an emerging opportunity for portfolio diversification and risk management.

  • Ethereum Price Alert: ETH Risks 15% Drop to $1,550 Support Level

    Ethereum Price Alert: ETH Risks 15% Drop to $1,550 Support Level

    Ethereum (ETH) faces a critical juncture as the cryptocurrency risks dropping to 17-month lows near $1,550, according to leading analysts. The second-largest cryptocurrency has already declined 17% over the past month, with technical indicators suggesting further downside potential if key resistance levels aren’t reclaimed soon.

    Technical Analysis Points to Bearish Scenario

    ETH has been trading below a crucial support zone between $1,750-$1,840 after failing to maintain the psychologically important $1,900 level. This price action follows a broader breakdown that saw Ethereum lose its 15-month trading range in early March, when it fell below $2,100 for the first time since December 2023.

    Notably, large Ethereum holders have been actively accumulating during this dip, suggesting some institutional confidence despite the bearish technical setup.

    SPONSORED

    Trade ETH with up to 100x leverage and maximize your profit potential

    Trade Now on Defx

    Key Price Levels to Watch

    According to analyst Rekt Capital, Ethereum’s current price action has validated a double top formation within the $2,196-$3,904 macro range. The cryptocurrency now trades within a historical liquidity pool between $1,640-$1,930, setting up for a potential bearish retest of the range’s top.

    ETH Dominance Shows Signs of Reversal

    Despite the bearish technical setup, there are some positive signals. ETH’s market dominance has dropped from 20% to 8% since June 2023, historically a reversal zone for the cryptocurrency. Previous touches of the 7.5%-8.25% dominance range have preceded significant recoveries.

    Potential 20% Rally Scenario

    Some analysts remain optimistic about ETH’s short-term prospects. AltCryptoGems analyst Sjuul has identified a Power of 3 setup on lower timeframes that could trigger a 20% rally if ETH breaks above key resistance levels. The potential rally would target the $2,150 resistance level.

    FAQ Section

    What is the current key support level for Ethereum?

    The critical support level sits at $1,750, with the next major support at $1,550 if current levels fail to hold.

    Could Ethereum still rally in the near term?

    Yes, analysts suggest a potential 20% rally is possible if ETH breaks above $1,930 and reclaims the $2,100 resistance level.

    What’s causing Ethereum’s current price weakness?

    The weakness stems from a combination of technical factors, including the breakdown of a 15-month trading range and consecutive negative monthly closes.

    As of this writing, ETH trades at $1,808, showing a modest 2.2% gain in the daily timeframe. Traders should closely monitor the $1,930 resistance and $1,750 support levels for potential breakout or breakdown scenarios.