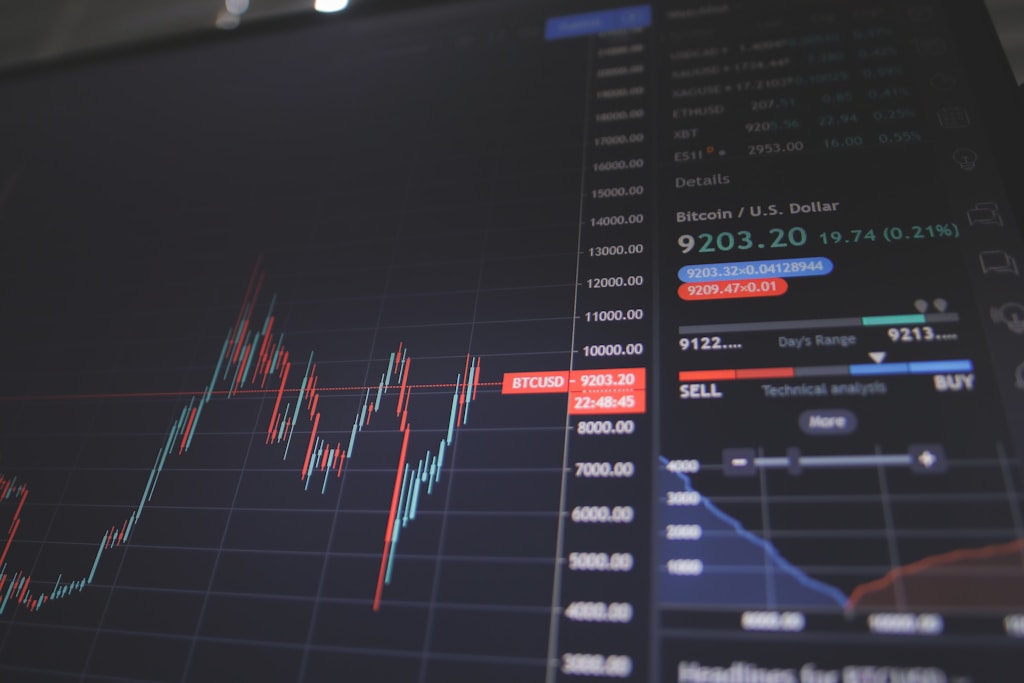
Tag: Crypto Markets

  • Bitcoin Bull Cycle Peak? Volume Ratio Analysis Signals Critical Phase

    Bitcoin Bull Cycle Peak? Volume Ratio Analysis Signals Critical Phase

    Bitcoin’s recent price action has sparked intense debate about whether the current bull cycle is approaching its peak, with the leading cryptocurrency showing uncertain momentum after hitting its all-time high of $109,000 in January 2024. Recent supply ratio analysis had suggested a potential $90K breakout, but new volume metrics paint a more complex picture.

    Volume Ratio Analysis Reveals Cycle Patterns

    CryptoQuant analyst Crypto Dan has identified a critical market indicator through Bitcoin’s trading volume patterns. The analysis shows that BTC’s six to twelve-month volume ratio serves as a reliable gauge for market cycle phases, with current data suggesting we may be approaching a significant inflection point.

    Two distinct volume decline phases typically mark Bitcoin’s market cycles:

    • Initial decline: Signals early bull cycle conclusion
    • Secondary decline: Historically indicates cycle peak and potential reversal

    SPONSORED

    Trade Bitcoin with precision using advanced order types and up to 100x leverage

    Trade Now on Defx

    Technical Indicators Paint Mixed Picture

    The Monthly RSI analysis from RektCapital adds another layer to the narrative. Unlike previous cycles where RSI 60 acted as resistance, it now serves as a support floor – a significant shift in market dynamics that could suggest continued strength despite broader concerns.

    Recent dead cross pattern analysis had projected a 57-day correction window, but current volume metrics and RSI readings present conflicting signals about immediate market direction.

    Expert Perspectives and Market Implications

    Market analyst Javon Marks presents a contrarian view, identifying bullish chart patterns that suggest potential upside ahead. This perspective aligns with institutional behavior, as Bitcoin has shown remarkable resilience at the $80K level despite broader market pressures.

    FAQ Section

    What indicates a Bitcoin bull cycle peak?

    Key indicators include declining trading volumes, RSI readings above 70, and reduced institutional inflows. The current cycle shows some, but not all, of these characteristics.

    As market participants digest these conflicting signals, the coming weeks will be crucial in determining whether Bitcoin’s current bull cycle has indeed reached its peak or if there’s still room for further upside.


  • Bitcoin Immune to Trump Tariffs: Saylor Highlights Digital Asset Advantage

    In a significant development for cryptocurrency markets, Michael Saylor, Executive Chairman of Strategy at MicroStrategy, has emphasized Bitcoin’s unique position amid escalating global trade tensions. As Trump’s new tariff policies shake traditional markets, Bitcoin’s digital nature could provide a compelling advantage.

    Bitcoin’s Unique Position in Trade War Environment

    Saylor’s statement that ‘there are no tariffs on Bitcoin’ comes at a crucial time when global markets are digesting Trump’s sweeping new import tax plan. While physical goods face substantial tariffs ranging from 10% to 49%, Bitcoin’s borderless, digital nature positions it uniquely in the global financial landscape.

    SPONSORED

    Trade Bitcoin with up to 100x leverage and maximize your profit potential

    Trade Now on Defx

    Global Impact of Trump’s Tariff Strategy

    The new tariff structure particularly impacts Asian economies:

    • Vietnam: 46% tariff rate
    • Cambodia: 49% tariff rate
    • China: 34% tariff rate
    • Taiwan: 32% tariff rate

    Bitcoin Price Stability Amid Market Uncertainty

    Despite broader market concerns, Bitcoin has demonstrated remarkable resilience, trading at $83,105 with minimal volatility. As traditional markets face pressure from China tariffs, Bitcoin’s stability suggests its potential as a hedge against trade war impacts.

    Future Implications for Cryptocurrency Markets

    While Bitcoin remains technically unaffected by tariffs, indirect effects could emerge through:

    • Reduced disposable income for crypto investment
    • Increased attraction to digital assets as safe havens
    • Potential regulatory responses to digital asset flows

    FAQ Section

    Q: Can governments impose tariffs on Bitcoin transactions?
    A: No, Bitcoin’s decentralized, digital nature makes it immune to traditional border-based tariffs.

    Q: How might trade wars affect Bitcoin price?
    A: While Bitcoin isn’t directly affected by tariffs, market uncertainty could drive increased adoption as a safe haven asset.

    Q: Will other cryptocurrencies benefit from this situation?
    A: All digital assets share Bitcoin’s immunity to traditional tariffs, potentially benefiting the entire crypto sector.

  • Fed Rate Cut Demands Intensify as Trump Targets Powell Amid Market Turmoil

    In a dramatic development that’s sending shockwaves through both traditional and crypto markets, former President Donald Trump has escalated his criticism of Federal Reserve Chair Jerome Powell, demanding immediate interest rate cuts amid significant market volatility. Recent analysis shows the US recession risk has hit 53% following Trump’s tariff announcements, adding weight to his calls for monetary policy adjustment.

    Market Impact and Fed Policy Pressure

    The situation has created a complex dynamic in financial markets, with Trump’s aggressive stance on interest rates coinciding with substantial market declines. Wall Street’s leading indices have experienced notable drops, prompting renewed focus on the Federal Reserve’s monetary policy decisions.

    SPONSORED

    Navigate market volatility with up to 100x leverage on perpetual contracts

    Trade Now on Defx

    Crypto Market Response

    The cryptocurrency market has shown interesting reactions to these developments. Bitcoin has demonstrated remarkable resilience, maintaining stability despite the broader market turbulence. This suggests a potential decoupling from traditional market pressures and highlights crypto’s emerging role as a hedge against political and economic uncertainty.

    Expert Analysis and Market Outlook

    Financial analysts are divided on the potential implications of Trump’s demands. While some support the call for rate cuts to stimulate economic growth, others warn of potential inflationary risks. The Federal Reserve maintains its data-dependent approach, though market pressures could influence future policy decisions.

    FAQ Section

    How would Fed rate cuts affect crypto markets?

    Lower interest rates typically increase investment in risk assets, potentially benefiting cryptocurrency markets through increased capital flow.

    What is the likelihood of the Fed cutting rates?

    While market pressures are mounting, the Fed’s decisions remain dependent on economic data and inflation metrics.

    How might this affect Bitcoin’s price trajectory?

    Historical data suggests that periods of monetary easing often correlate with Bitcoin price appreciation, though multiple factors influence crypto market movements.

  • Toncoin Price Crashes 12% After $4.34 Resistance Rejection – Recovery Ahead?

    Toncoin (TON) has experienced a significant market correction, plunging 12% after failing to breach the critical $4.34 resistance level. This price movement comes amid increasing market volatility and follows a period of strong upward momentum for the TON ecosystem. Recent developments in TON’s cross-chain capabilities make this correction particularly noteworthy for investors.

    Technical Analysis: Understanding the 12% Correction

    The recent price action shows several critical technical factors at play:

    • Resistance rejection at $4.34 triggered aggressive selling
    • MACD indicator showing bearish crossover
    • Key support level established at $2.36
    • Volume profile indicating distribution phase

    SPONSORED

    Trade TON with up to 100x leverage on perpetual contracts

    Trade Now on Defx

    Market Sentiment and Price Outlook

    The current correction appears to be a natural market reset following an extended bullish phase. Key factors to watch include:

    • Institutional interest levels
    • Network activity metrics
    • Exchange inflow/outflow ratios
    • Social sentiment indicators

    Potential Recovery Scenarios

    Two primary scenarios are emerging for TON’s price action:

    1. Bullish Case: Support at $2.36 holds, leading to consolidation and potential rebound toward $4.34
    2. Bearish Case: Support breach could trigger further selling pressure toward lower support levels

    FAQ Section

    What caused Toncoin’s 12% price drop?

    The correction was triggered by a combination of resistance rejection at $4.34 and broader market technical factors, including MACD bearish crossover.

    Is this correction normal for Toncoin?

    Yes, corrections of this magnitude are common in crypto markets, especially after strong upward movements and failed breakout attempts.

    What are the key levels to watch?

    The critical support level at $2.36 and resistance at $4.34 are the main price points traders should monitor.

    Time to Read: 4 minutes

  • Shiba Inu’s Shibarium Hits 1B Transactions While SHIB Price Struggles at $0.000012

    Shiba Inu’s Shibarium Hits 1B Transactions While SHIB Price Struggles at $0.000012

    Shiba Inu’s layer-2 scaling solution Shibarium has achieved a remarkable milestone of 1 billion total transactions, marking a significant technical achievement for the popular meme coin’s ecosystem. However, this breakthrough hasn’t translated into price gains, with SHIB continuing to face bearish pressure around the $0.000012 level.

    Shibarium’s Billion-Transaction Milestone: A Closer Look at the Numbers

    According to official data from Shibariumscan, the network has processed over 1,012,261,457 transactions across 10,284,922 blocks since its launch in August 2023. The platform has also generated nearly 195 million unique addresses, demonstrating significant adoption of the layer-2 solution.

    Daily transaction volumes have been particularly impressive, with recent 24-hour periods showing:

    • Current 24-hour period: 2.75 million transactions
    • Previous 24-hour period: 4.11 million transactions

    Price Divergence: Why SHIB Remains Bearish Despite Network Growth

    Despite Shibarium’s technical achievements, SHIB’s price action tells a different story. The broader crypto market downturn, exacerbated by Trump’s recent tariff announcements, has contributed to SHIB’s bearish trend. Key price metrics include:

    • Current price: $0.00001210
    • 7-day performance: -9.4%
    • 24-hour change: -1.2%

    SPONSORED

    Trade meme coins like SHIB with up to 100x leverage on perpetual contracts

    Trade Now on Defx

    Market Analysis: Key Factors Affecting SHIB’s Price

    Several factors are contributing to SHIB’s price struggles:

    1. Decoupling of network metrics from price action
    2. General crypto market bearish sentiment
    3. Reduced speculative interest in meme coins
    4. Technical resistance at the $0.000012 level

    Looking Ahead: What’s Next for Shiba Inu?

    While Shibarium’s growth demonstrates the network’s technical capabilities, investors should watch these key factors for potential price recovery:

    • Support level at $0.000012
    • Overall crypto market sentiment
    • New Shibarium ecosystem developments
    • Institutional interest in meme coins

    FAQ Section

    What is Shibarium?

    Shibarium is Shiba Inu’s layer-2 scaling solution designed to improve transaction speed and reduce costs on the network.

    Why isn’t SHIB’s price rising despite network growth?

    The disconnect between price and network metrics suggests market sentiment currently prioritizes broader crypto market conditions over network achievements.

    What’s the next major support level for SHIB?

    If SHIB breaks below $0.000012, the next significant support level would be at $0.000010.

  • Bitcoin Alert: US Recession Risk Hits 53% After Trump Tariffs

    Bitcoin Alert: US Recession Risk Hits 53% After Trump Tariffs

    Bitcoin markets are on high alert as US recession probabilities surge past 50% following President Trump’s dramatic “Liberation Day” tariff announcement. Leading prediction market Kalshi now shows a 53% chance of recession, while Polymarket indicates 54% odds – marking a significant shift in economic sentiment that could impact crypto markets.

    This development comes as Bitcoin continues to experience volatility around the $83K level amid tariff-induced market uncertainty.

    Recession Indicators Flash Warning Signs

    Multiple respected financial institutions have revised their recession forecasts upward:

    • Kalshi Markets: 53% (↑8.1%)
    • Polymarket: 54%
    • Larry Summers: 50%
    • JPMorgan: 40%
    • Goldman Sachs: 35% (↑15% from previous estimate)

    JPMorgan analysts warn that Trump’s new tariffs could result in a staggering $660 billion annual tax increase on American consumers, potentially adding 2% to domestic inflation. This combination of higher costs and economic uncertainty has sent shockwaves through prediction markets.

    SPONSORED

    Navigate market volatility with up to 100x leverage on perpetual contracts

    Trade Now on Defx

    Bitcoin’s Response to Economic Uncertainty

    Crypto market participants are divided on Bitcoin’s potential response to recession risks. While some view BTC as a hedge against economic uncertainty, others warn of potential correlation with traditional risk assets during severe downturns.

    Renowned crypto trader Bob Loukas suggests a more cautious approach, noting that while Bitcoin could act as digital gold during economic stress, traditional “buy the dip” strategies may need reassessment in the current environment.

    Fed Response and Market Implications

    The Federal Reserve faces a complex balancing act between managing inflation and supporting economic growth. UBS Global Wealth Management now expects 75-100 basis points of rate cuts through 2025, potentially creating a supportive environment for Bitcoin if inflation concerns remain contained.

    Key Factors to Watch

    • Federal Reserve policy decisions
    • Inflation data impact from tariffs
    • International trade partner responses
    • Bitcoin’s correlation with traditional markets
    • Institutional investor positioning

    At press time, Bitcoin trades at $83,197, as markets await Federal Reserve Chair Jerome Powell’s crucial speech scheduled for 11:25 am ET.

    FAQ Section

    How do recession risks typically impact Bitcoin?

    Historical data shows mixed Bitcoin performance during economic downturns, with the asset sometimes acting as a safe haven while other times correlating with risk assets.

    What are the key levels to watch for Bitcoin?

    Current technical analysis suggests strong support at $80,000, with resistance around $85,000.

    How might Fed rate cuts affect Bitcoin in a recession?

    Rate cuts typically support Bitcoin prices, but the impact may be muted if accompanied by severe economic stress.

  • Dogecoin Price Plunges Below $0.17 – Critical Support at $0.155 Tested

    Dogecoin Price Plunges Below $0.17 – Critical Support at $0.155 Tested

    Dogecoin (DOGE) continues its bearish trend as the popular meme cryptocurrency faces increased selling pressure, dropping below multiple support levels. The latest price action shows DOGE struggling to maintain stability above $0.155, raising concerns among investors about potential further downside.

    As recent market analysis indicated, Dogecoin’s price trajectory has been notably bearish, with the latest decline marking a significant technical breakdown.

    Key Technical Breakdown Points

    • Price failed to hold above $0.180 resistance level
    • Critical bullish trend line broken at $0.170
    • Trading below 100-hourly simple moving average
    • Current consolidation between $0.155 and $0.165

    SPONSORED

    Trade DOGE with up to 100x leverage on perpetual contracts

    Trade Now on Defx

    Technical Analysis Deep Dive

    The current technical setup shows multiple bearish indicators:

    • MACD indicator losing momentum in bearish territory
    • RSI hovering above 50, showing potential for recovery
    • Key support levels established at $0.1600 and $0.1550
    • Major resistance zones at $0.1680 and $0.1740

    Price Targets and Support Levels

    Traders should watch these critical price levels:

    Support Levels Resistance Levels
    $0.1550 $0.1680
    $0.1500 $0.1740
    $0.1320 $0.1800

    Expert Analysis and Future Outlook

    Market analysts suggest that DOGE’s immediate future depends on its ability to defend the $0.155 support level. A breakdown below this level could trigger a cascade of selling, potentially pushing prices toward $0.132 or even $0.120.

    FAQ

    What’s causing Dogecoin’s current price decline?

    The decline is attributed to broader market weakness and technical breakdown below key support levels.

    Can Dogecoin recover from current levels?

    Recovery is possible if bulls can defend the $0.155 support and push prices above $0.170.

    What are the key levels to watch?

    Critical support at $0.155 and resistance at $0.168 are the most important levels for short-term price action.

    Time to read: 4 minutes

  • XRP Price Alert: Critical $1.98 Support Test Could Trigger 70% Rally

    XRP Price Alert: Critical $1.98 Support Test Could Trigger 70% Rally

    XRP is testing a crucial support level at $1.98 as market volatility intensifies across the cryptocurrency sector. With a current market cap of $115 billion and daily trading volume of $10.50 billion, XRP has experienced a 7.7% decline over the past 24 hours amid broader market uncertainty.

    Bitcoin Volatility Triggers Altcoin Market Pressure

    The recent Bitcoin price action, which saw BTC surge to $81,700 before experiencing a sharp correction, has created ripple effects throughout the altcoin market. As noted in recent market analysis, Trump’s global tariff announcements have contributed significantly to the current market instability.

    SPONSORED

    Trade XRP with up to 100x leverage and maximize your profit potential

    Trade Now on Defx

    Technical Analysis Points to Potential Breakout

    Crypto analyst Egrag Crypto has identified a critical testing period for XRP, projecting a possible decline to the $1.90-$1.79 range before a significant upward movement. This analysis suggests a potential 70% rally could materialize if these support levels hold, aligning with previous technical indicators showing signs of a market reversal.

    Macroeconomic Factors Influence Market Sentiment

    The cryptocurrency market faces additional pressure from recent political developments, particularly the implementation of new tariffs by former President Trump. These economic policy shifts have created uncertainty across global markets, affecting crypto assets including XRP.

    FAQ Section

    What is the current XRP support level?

    XRP is currently testing support at $1.98, with secondary support levels at $1.90 and $1.79.

    What is the potential upside target for XRP?

    According to analyst projections, XRP could target the $2.80-$3.00 range following a successful test of support levels.

    How do macro factors affect XRP price?

    Global economic policies, particularly recent tariff announcements, have created market uncertainty affecting XRP and other cryptocurrencies.

    Featured image: Shutterstock

  • XRP Price Battles $2.10 Resistance: Key Technical Levels Signal Recovery

    XRP Price Battles $2.10 Resistance: Key Technical Levels Signal Recovery

    XRP’s price action has entered a critical phase as bulls attempt to defend the $2.00 support level amid broader market uncertainty. Recent technical analysis had suggested potential reversal signals, making this current price action particularly significant for traders.

    XRP Price Analysis: Key Technical Levels

    The digital asset is showing mixed signals after declining below several crucial support levels:

    • Current trading range: $1.960 – $2.10
    • Key resistance levels: $2.070, $2.10, and $2.120
    • Critical support zones: $2.00, $1.960, and $1.920
    • 100-hour Simple Moving Average: Below $2.10

    Technical Pattern Formation

    A declining channel pattern has emerged on the hourly chart, with resistance at $2.0680. This formation, combined with the recent price action, suggests that XRP is at a decisive point that could determine its short-term trajectory.

    SPONSORED

    Trade XRP with up to 100x leverage on perpetual contracts

    Trade Now on Defx

    Recovery Scenarios and Risk Levels

    For bulls to regain control, several key levels must be overcome:

    • Initial resistance: $2.10 (50% Fibonacci retracement level)
    • Secondary target: $2.180
    • Ultimate bullish target: $2.40 – $2.50 range

    Downside Risks and Support Zones

    If the current recovery attempt fails, traders should watch these support levels:

    • Primary support: $2.00 (psychological level)
    • Critical support: $1.960 (recent low)
    • Last line of defense: $1.90 zone

    Technical Indicators Overview

    Current technical indicators provide mixed signals:

    • MACD: Losing momentum in bearish territory
    • RSI: Above 50, suggesting potential short-term strength
    • Moving Averages: Price trading below 100-hour SMA

    FAQ Section

    What is the key resistance level for XRP right now?

    The primary resistance level is at $2.10, coinciding with the 50% Fibonacci retracement level.

    Where is the strongest support for XRP?

    The strongest support zone lies at $1.960, which served as the recent low.

    What technical indicators should traders watch?

    Focus on the MACD, RSI, and the 100-hour Simple Moving Average for short-term trading signals.

    Traders should maintain strict risk management practices given the current market volatility. While the potential for recovery exists, the presence of strong resistance levels suggests cautious positioning may be prudent.

  • Bitcoin Price Struggles at $83.5K: Key Resistance Blocks Recovery

    Bitcoin (BTC) continues to face significant headwinds as its price recovery remains elusive, with the leading cryptocurrency encountering strong resistance at the $83,500 level. As recent market turbulence from Trump’s tariff announcements continues to reverberate through the crypto markets, traders are closely monitoring key technical levels for signs of directional momentum.

    Bitcoin’s Technical Outlook: Resistance Zones and Support Levels

    After establishing a local bottom at $81,200, Bitcoin initiated a recovery attempt that pushed prices above several minor resistance levels. However, the upward momentum has stalled at a critical juncture, with multiple technical factors converging to create strong overhead resistance:

    • The 100-hour Simple Moving Average acting as dynamic resistance
    • A bearish trendline formation at $83,500
    • The 23.6% Fibonacci retracement level from the recent decline ($89,042 to $81,177)

    SPONSORED

    Trade Bitcoin with up to 100x leverage and maximize your profit potential

    Trade Now on Defx

    Critical Price Levels to Watch

    For traders and investors monitoring Bitcoin’s price action, several key levels demand attention:

    Resistance Levels:

    • Immediate resistance: $83,200
    • Critical barrier: $83,500
    • Secondary resistance: $84,500
    • Major target: $85,500

    Support Levels:

    • Primary support: $82,200
    • Secondary support: $81,200
    • Critical floor: $80,500
    • Major support: $78,800

    Technical Indicators Signal Caution

    The current technical setup suggests continued bearish pressure:

    • MACD momentum is weakening in bearish territory
    • RSI remains below the crucial 50 level
    • Price action forming a bearish trend line on the hourly chart

    Potential Scenarios and Trading Implications

    Two primary scenarios are emerging for Bitcoin’s near-term price action:

    Bullish Case:

    A decisive break above $83,500 could trigger a rally toward $84,500, with potential extension to $85,500. The 61.8% Fibonacci retracement level near $86,000 would become the next major target.

    Bearish Case:

    Failure to overcome the $83,500 resistance could lead to renewed selling pressure, potentially testing support at $82,200 and $81,200. A break below these levels could expose the psychologically important $80,000 mark.

    Frequently Asked Questions

    What is causing Bitcoin’s current price resistance?

    Multiple technical factors, including the 100-hour moving average and a bearish trendline at $83,500, are creating strong overhead resistance.

    What are the key support levels to watch?

    The primary support levels are $82,200 and $81,200, with critical support at $80,500 and $78,800.

    What technical indicators should traders monitor?

    Key indicators include the MACD, RSI (currently below 50), and the hourly chart’s trend line formation.