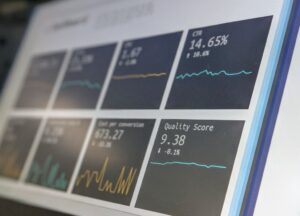
XRP Price Warning: Ripple CTO Questions XRPL Growth Impact
In a surprising revelation at the XRP Las Vegas gathering, Ripple's Chief Technology Officer David "JoelKatz" Schwartz cast doubt on...
In a surprising revelation at the XRP Las Vegas gathering, Ripple's Chief Technology Officer David "JoelKatz" Schwartz cast doubt on...
Key Takeaways:Strategy (formerly MicroStrategy) announces $1B stock offeringFunds earmarked for significant Bitcoin acquisitionMove signals growing institutional confidence in BitcoinIn a...
The XRP price is showing concerning bearish signals after what initially appeared to be a promising recovery, with four consecutive...
Bitcoin (BTC) is showing signs of potential bearish momentum that could test critical support levels, with some analysts projecting a...
XRP's price action has taken a bearish turn, dropping below the crucial $2.20 level as the cryptocurrency market shows signs...
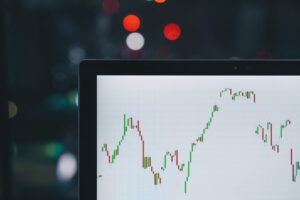
Bitcoin's latest bull cycle is displaying markedly different characteristics from previous rallies, as the cryptocurrency consolidates near $104,851 following its...
Bitcoin (BTC) is showing a potentially significant buy signal through its Hash Ribbons indicator, even as the leading cryptocurrency consolidates...
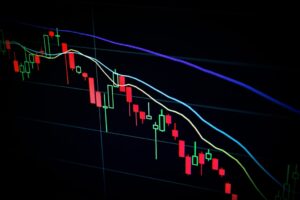
Key Takeaways:Bitcoin drops 4% to $100,426 in significant market correction$837 million in crypto positions liquidated during the downturnBTC maintains historic...
Ethereum (ETH) is showing strong technical signals that point to an imminent breakout, with analysts projecting a potential surge to...

Solana (SOL) faces mounting bearish pressure as the cryptocurrency tests critical support at $152, with technical analysis suggesting a potential...


