Tag: Crypto Markets

  • Story Protocol (IP) Token Crashes 20% in Wild Price Swing

    Story Protocol (IP) Token Crashes 20% in Wild Price Swing

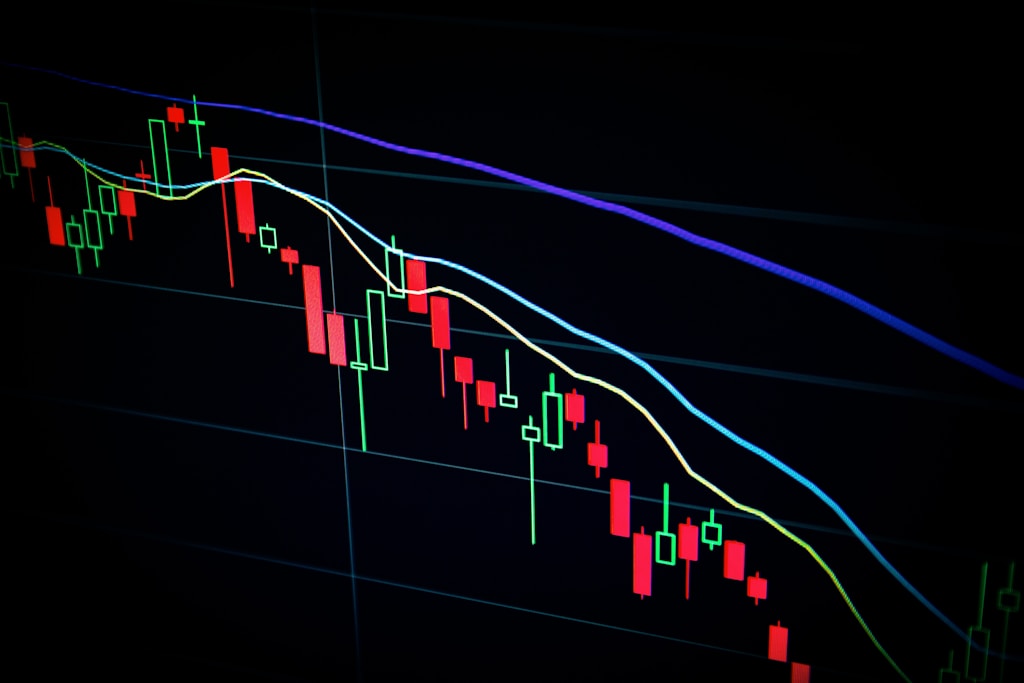
    Story Protocol’s IP token experienced extreme volatility on Monday, plummeting 20% before staging a dramatic recovery in what appears to be an isolated market event. This analysis examines the causes behind the sudden price movement and its implications for the broader crypto market.

    IP Token’s Rollercoaster Trading Session

    The IP token, which powers Story Protocol’s intellectual property blockchain platform, saw its price collapse from $4.00 to $3.27 within just four hours – a 20% drop that sent shockwaves through the crypto community. However, in an equally dramatic reversal, the token fully recovered its losses within hours, demonstrating the highly volatile nature of emerging crypto assets.

    Trading Volume Analysis

    Key trading metrics during the event:

    • Pre-plunge trading volume: $40 million
    • Post-recovery trading volume: $138 million
    • Major exchanges involved: Binance and OKX Spot
    • Futures market losses: Only $1.4 million

    Market Context and Bitcoin Stability

    While IP token underwent its dramatic price swing, Bitcoin demonstrated remarkable stability around the $84,000 level, highlighting the isolated nature of the IP token event. This stability in the broader crypto market suggests the volatility was specific to Story Protocol rather than a systemic issue.

    SPONSORED

    Trade with confidence using advanced risk management tools

    Trade Now on Defx

    Potential Causes of the Price Swing

    Several factors may have contributed to the sudden price movement:

    • Rumors of discounted OTC deals for IP tokens
    • Possible coordinated selling activity
    • Speculation about insider trading
    • Market concerns following recent Mantra (OM) token crash

    Story Protocol: Platform Overview

    Story Protocol operates as a Layer 1 blockchain specifically designed for intellectual property management. The platform enables:

    • On-chain IP registration
    • Digital licensing frameworks
    • Monetization tools for creators
    • Transparent IP ownership tracking

    Market Impact and Future Outlook

    The rapid recovery suggests strong underlying support for the IP token, though traders should remain cautious given the demonstrated volatility. The low futures market losses indicate most trading activity was spot-based, potentially suggesting genuine market interest rather than speculative trading.

    FAQ Section

    What caused the Story Protocol token crash?

    While the exact cause remains unconfirmed, rumors suggest large OTC deals and potential coordinated selling contributed to the price volatility.

    How does Story Protocol compare to other blockchain platforms?

    Story Protocol differentiates itself as a specialized Layer 1 blockchain focused specifically on intellectual property management and monetization.

    Is the IP token volatility related to broader market conditions?

    No, the event appears isolated, as the broader crypto market, including Bitcoin, remained stable during the price swing.

  • Bitcoin Giant Strategy Adds $285M BTC, Portfolio Nears 600K Bitcoin

    Strategy, the Bitcoin-focused company led by Michael Saylor, has expanded its already massive Bitcoin holdings with a new $285.8 million purchase, bringing its total portfolio close to the 600,000 BTC milestone. This latest acquisition comes during a period of significant price volatility and market uncertainty related to Trump’s tariff policies.

    Strategy’s Bitcoin Portfolio Reaches New Heights

    The recent purchase of 3,459 BTC at an average price of $82,618 between April 7-13 has increased Strategy’s total holdings to 531,644 BTC, representing approximately 2.5% of Bitcoin’s maximum supply. The company reported an impressive 11.4% year-to-date Bitcoin yield as of April 13, 2025, with their BTC holdings now valued at $35.92 billion at an average acquisition price of $67,556.

    SPONSORED

    Trade Bitcoin with up to 100x leverage and maximize your profit potential

    Trade Now on Defx

    Financial Strategy and Market Impact

    To finance this acquisition, Strategy leveraged its at-the-market stock program, continuing its aggressive Bitcoin accumulation strategy. The company’s approach has proven successful, with shares surging approximately 2,300% since Saylor began investing in Bitcoin in 2020. However, despite recent market volatility, Strategy remains committed to its long-term Bitcoin strategy.

    Looking Ahead: $42 Billion Expansion Plan

    Strategy has announced ambitious plans to raise $42 billion in capital through 2027, demonstrating its continued commitment to Bitcoin acquisition. This comes despite an unrealized loss of $5.9 billion in Q1 2025 due to new accounting requirements for digital assets.

    Market Context and Future Outlook

    Bitcoin has recently reclaimed the $85,000 level, showing a 7% weekly increase. While currently trading 21% below its January all-time high of $109,000, the market has shown resilience following the temporary pause in Trump’s tariff policies.

    Frequently Asked Questions

    How much Bitcoin does Strategy currently own?

    Strategy currently holds 531,644 BTC, valued at approximately $35.92 billion.

    What is Strategy’s average Bitcoin purchase price?

    The company’s average acquisition price per Bitcoin is $67,556.

    What are Strategy’s future Bitcoin investment plans?

    Strategy plans to raise $42 billion in capital through 2027 to continue its Bitcoin acquisition strategy.

  • ETH Short ETFs Surge 51% in 2025 as Ethereum Price Plummets

    In a remarkable turn of events for cryptocurrency markets, leveraged ETFs betting against Ethereum (ETH) have emerged as the top-performing exchange-traded funds in the United States, delivering staggering returns as ETH prices continue their downward spiral. This bearish price action aligns with recent technical analysis showing ETH approaching critical support levels.

    Record-Breaking Returns from Ethereum Bear ETFs

    The cryptocurrency market has witnessed an unprecedented phenomenon in 2025, with inverse Ethereum ETFs dominating the investment landscape. These specialized investment vehicles, which profit from ETH’s price decline, have capitalized on the cryptocurrency’s nearly 51% price drop since January.

    SPONSORED

    Trade ETH with up to 100x leverage on perpetual contracts

    Trade Now on Defx

    Market Analysis: Why ETH is Underperforming

    Several factors have contributed to Ethereum’s bearish performance in 2025:

    • Increased competition from alternative Layer-1 protocols
    • Technical challenges in scaling solutions
    • Broader market uncertainty affecting risk assets
    • Institutional investors favoring Bitcoin over ETH

    Investment Implications and Future Outlook

    While short ETFs have provided substantial returns, investors should consider:

    • The inherent risks of leveraged investment products
    • Historical crypto market volatility patterns
    • Potential regulatory changes affecting ETH
    • Long-term fundamental value propositions

    Frequently Asked Questions

    What are ETH Short ETFs?

    ETH Short ETFs are investment vehicles that use leverage to profit from decreases in Ethereum’s price. They typically achieve this through derivative contracts and daily rebalancing.

    Why has ETH declined so significantly in 2025?

    The decline can be attributed to multiple factors including market sentiment, competitive pressures, and broader macroeconomic conditions affecting crypto assets.

    Are Short ETFs suitable for retail investors?

    Short ETFs carry significant risks due to their leveraged nature and are generally more suitable for sophisticated investors with high risk tolerance and short-term trading strategies.

  • Solana Price Tests Critical $130 Level as Bulls Eye Major Breakout

    Solana (SOL) is approaching a decisive moment as the cryptocurrency tests a critical resistance level at $130, following weeks of intense selling pressure that drove prices down by 47% since early March. Technical indicators and fundamental catalysts are aligning to suggest a potential trend reversal, though significant hurdles remain ahead.

    The recent price action comes amid broader market stabilization, with SOL showing impressive resilience by bouncing over 25% from its recent low of $95. This recovery coincides with renewed market optimism following Trump’s tariff pause announcement, which has provided a boost across the crypto sector.

    Technical Analysis Points to Potential Reversal

    According to prominent analyst Ted Pillows, Solana’s 60% decline from its peak suggests capitulation may have already occurred. The asset is now testing a crucial trendline resistance that could determine its medium-term trajectory. A decisive close above $130 could signal the start of a sustained recovery rally.

    SPONSORED

    Trade Solana with up to 100x leverage on perpetual contracts

    Trade Now on Defx

    Fundamental Catalysts Stack Up

    Multiple bullish catalysts are emerging for Solana:
    – Firedancer upgrade implementation approaching
    – Potential Solana ETF approval discussions
    – 140% increase in stablecoin supply
    – Surging DEX trading volumes
    – Digital Asset Stockpile inclusion prospects

    Critical Support and Resistance Levels

    Key price levels to watch:
    – Immediate resistance: $125
    – Major resistance: $130
    – Critical support: $112
    – Secondary support: $100
    – Next target on breakout: $145

    FAQ

    What caused Solana’s recent price drop?
    The 47% decline since March was driven by broader market uncertainty and profit-taking after SOL’s strong performance in early 2025.

    What are the key levels to watch?
    The critical resistance is at $130, while $112 serves as crucial support. A break above $130 could trigger a rally toward $145.

    What catalysts could drive SOL higher?
    The Firedancer upgrade, potential ETF approval, increasing on-chain activity, and rising stablecoin supply are key bullish catalysts.

  • Dogecoin Price Signals Major Breakout as Global Liquidity Bottoms

    Dogecoin Price Signals Major Breakout as Global Liquidity Bottoms

    A groundbreaking technical analysis reveals Dogecoin (DOGE) may be on the verge of a significant price movement, as the Global Liquidity Index reaches historic bottom levels. This development comes amid increasing institutional interest in the popular memecoin, as evidenced by the recent Dogecoin ETF filing by 21Shares.

    Technical Analysis Points to Critical Support Level

    Renowned crypto analyst Kevin (@Kev_Capital_TA) has identified a compelling correlation between DOGE price action and global liquidity metrics. The analysis shows Dogecoin trading at a crucial junction where multiple technical indicators converge:

    • Current price: $0.15723
    • Key Fibonacci retracement level: 0.382 at $0.14225
    • Multi-year descending trendline retest
    • Global Liquidity Index bottom formation

    Global Liquidity Index: A Leading Indicator

    The Global Liquidity Index has demonstrated remarkable predictive power for Dogecoin’s price movements. Historical data reveals that each time the index touched the lower boundary of its downward channel, DOGE experienced significant price reversals. This pattern has been particularly reliable during the following periods:

    • Early 2021: Preceded the rally to $0.74
    • Mid-2022: Marked the end of the major correction
    • Late 2023: Initiated the current consolidation phase

    SPONSORED

    Trade DOGE with up to 100x leverage on perpetual contracts

    Trade Now on Defx

    Market Structure Analysis

    The current market structure suggests a potential trend reversal, supported by:

    • Confluence of technical support levels
    • Historical price action patterns
    • Bottoming liquidity indicators
    • Institutional interest via ETF developments

    Risk Factors and Considerations

    While the technical setup appears promising, traders should consider several risk factors:

    • Overall crypto market volatility
    • Regulatory uncertainties
    • Global macro conditions
    • Historical resistance levels

    Frequently Asked Questions

    What is the Global Liquidity Index?

    The Global Liquidity Index measures worldwide available capital for investment across markets. It serves as a leading indicator for risk asset performance, including cryptocurrencies.

    Why is the current price level significant for Dogecoin?

    The current level represents a confluence of technical factors, including the 0.382 Fibonacci retracement and a multi-year trendline retest, making it a crucial support zone.

    What could trigger the next Dogecoin rally?

    A combination of improving global liquidity conditions, institutional adoption through ETFs, and technical breakout confirmation could catalyze the next significant price movement.

  • Bitcoin Price Surges 10% as Trump Tariff Pause Mirrors Obama-Era Rally

    Bitcoin Price Surges 10% as Trump Tariff Pause Mirrors Obama-Era Rally

    Bitcoin (BTC) has demonstrated renewed momentum, climbing above $80,000 following President Trump’s market-moving tariff announcement. The leading cryptocurrency’s response to policy shifts highlights its growing correlation with traditional markets and macroeconomic events.

    In a development that has caught the attention of market analysts, Bitcoin surged over 10% after Trump announced a 90-day suspension of new tariffs, triggering a broader market rally that saw traditional indices post significant gains.

    Historical Market Parallels Draw Attention

    CryptoQuant analyst Maartunn has identified striking similarities between the current market response and a pivotal moment during the Obama administration in 2009. The parallel suggests potential for sustained growth, as Bitcoin’s fundamentals align with broader economic catalysts.

    SPONSORED

    Trade Bitcoin with up to 100x leverage on perpetual contracts

    Trade Now on Defx

    Network Fundamentals Signal Strong Foundation

    Despite Bitcoin’s recent price volatility, network metrics paint a bullish picture. The cryptocurrency’s hashrate and mining difficulty have reached all-time highs, suggesting robust network security and growing institutional confidence. Technical indicators suggest strong support at the $80,000 level.

    Market Outlook and Price Projections

    CryptoQuant CEO Ki Young Ju’s analysis suggests Bitcoin’s potential market cap could reach $5 trillion, representing significant upside from its current $1.6 trillion valuation. This projection aligns with growing institutional adoption and improving market fundamentals.

    Frequently Asked Questions

    How does Trump’s tariff policy affect Bitcoin?

    The tariff suspension has triggered positive sentiment across markets, with Bitcoin benefiting from improved risk appetite and institutional inflows.

    What do record hashrates mean for Bitcoin?

    Rising hashrates indicate stronger network security and increased mining investment, typically considered bullish indicators for long-term price action.

    Could Bitcoin reach the projected $5 trillion market cap?

    While ambitious, the projection is supported by growing institutional adoption, improving fundamentals, and historical growth patterns.

  • Bitcoin Shows Macro Asset Maturity as Market Turmoil Tests $80K Level

    Bitcoin Shows Macro Asset Maturity as Market Turmoil Tests $80K Level

    Bitcoin’s evolution into a mature macro asset is becoming increasingly evident as the cryptocurrency demonstrates remarkable resilience amid recent market turbulence. According to prominent market analyst James Toledano, Bitcoin’s measured response to a significant sell-off triggered by U.S. reciprocal tariffs highlights its growing sophistication as a macro-economic hedge.

    As recent market turmoil caused by Trump’s tariffs sent cryptocurrencies to 2025 lows, Bitcoin’s relatively stable performance has caught the attention of institutional investors and market analysts alike.

    Bitcoin’s Maturing Market Dynamics

    After weeks of correlation with traditional equity markets, Bitcoin has begun showing signs of decoupling, particularly during periods of heightened market stress. This behavior suggests that Bitcoin is increasingly being viewed as a distinct asset class with unique value propositions.

    Key indicators of Bitcoin’s maturation include:

    • Reduced correlation with traditional equity markets during stress events
    • More measured price responses to macro events
    • Increased institutional participation in price discovery
    • Growing adoption as a treasury reserve asset

    Market Impact and Future Implications

    The cryptocurrency’s response to recent market volatility has been particularly noteworthy, especially as global tariffs and capital flight concerns intensify. This development could have significant implications for Bitcoin’s role in institutional portfolios.

    SPONSORED

    Trade Bitcoin with up to 100x leverage on perpetual contracts

    Trade Now on Defx

    Expert Analysis and Market Outlook

    Toledano’s analysis suggests that Bitcoin’s maturation process could accelerate in the coming months, particularly as institutional adoption continues to grow and regulatory frameworks evolve. The asset’s performance during recent market stress events provides compelling evidence of its emerging role as a sophisticated macro hedge.

    Frequently Asked Questions

    How is Bitcoin showing signs of market maturity?

    Bitcoin is demonstrating maturity through reduced correlation with traditional markets, more measured price responses to macro events, and increased institutional adoption.

    What impact do recent market events have on Bitcoin’s status?

    Recent market turbulence has highlighted Bitcoin’s growing independence as a macro asset, with its price action showing more sophisticated responses to global economic events.

    How might this affect Bitcoin’s future adoption?

    This maturation process could accelerate institutional adoption and strengthen Bitcoin’s position as a legitimate macro hedge in professional investment portfolios.

  • XRP Price Targets $2.20 as Bulls Eye Breakout Above $2.00 Level

    XRP Price Targets $2.20 as Bulls Eye Breakout Above $2.00 Level

    XRP’s price action is showing strong bullish momentum as the cryptocurrency aims to break above the crucial $2.00 resistance level, with technical indicators suggesting potential for further upside to $2.20. This comes amid broader market strength, as Bitcoin recently surged to $83,000, lifting the entire crypto market.

    XRP Technical Analysis Shows Bullish Setup

    The sixth-largest cryptocurrency by market cap has established a solid foundation above key support levels, with bulls maintaining control of price action above $1.920. Key technical developments include:

    • Breakout above bearish trendline resistance at $1.9750
    • Price trading comfortably above 100-hour SMA
    • RSI indicating strong momentum above 50
    • MACD showing increasing bullish momentum

    Critical Price Levels to Watch

    For traders and investors tracking XRP’s next move, these are the key price levels to monitor:

    Support Levels Resistance Levels
    $1.950 $2.000
    $1.920 $2.075
    $1.900 $2.120
    $1.850 $2.200

    SPONSORED

    Trade XRP with up to 100x leverage on perpetual contracts

    Trade Now on Defx

    Potential Scenarios for XRP Price Action

    Two primary scenarios are emerging for XRP’s short-term price action:

    Bullish Scenario

    A decisive break above $2.00 could trigger a rally toward $2.075, with potential extension to $2.120 and $2.200. The recent surge in XRP futures trading volume to $21.6B supports the possibility of increased upside momentum.

    Bearish Scenario

    Failure to break $2.00 could lead to a retest of support at $1.950 and potentially $1.920. A break below these levels might trigger a deeper correction toward $1.850.

    Frequently Asked Questions

    What is driving XRP’s current price movement?

    The current bullish momentum is supported by technical breakouts, increased trading volume, and overall crypto market strength.

    What are the key resistance levels for XRP?

    The immediate resistance lies at $2.00, followed by $2.075 and $2.120.

    Could XRP reach $2.20 in the near term?

    Technical indicators suggest $2.20 is possible if XRP maintains momentum above $2.00.

    Time to read: 4 minutes

  • Ethereum Price Faces Critical $1,580 Test: Bulls Fight to Maintain Momentum

    Ethereum (ETH) is approaching a decisive moment as the second-largest cryptocurrency battles to maintain its bullish momentum above crucial support levels. After reaching a local high of $1,687, ETH has entered a corrective phase that could determine its short-term trajectory.

    In a notable development that coincides with the current price action, recent data shows long-term ETH holders have been capitulating, potentially creating a historic buy signal for investors watching current price levels.

    Key Price Levels and Technical Analysis

    The current price action shows several critical technical developments:

    • Support established at $1,500, coinciding with the 61.8% Fibonacci retracement level
    • Resistance cluster forming around $1,580, including the 100-hour SMA
    • Bearish trend line emerging at $1,550, creating a significant technical barrier

    Bullish Scenario: Path to $1,800

    For bulls to regain control, several key levels must be conquered:

    Resistance Level Significance
    $1,580 Immediate resistance + 100-hour SMA
    $1,620 First major resistance zone
    $1,680 Recent local high
    $1,750 Next major target

    Bearish Scenario: Support Levels to Watch

    If selling pressure intensifies, these support levels become crucial:

    • $1,520: Initial support zone
    • $1,500: Major psychological support
    • $1,455: Secondary support level
    • $1,420: Critical support zone

    SPONSORED

    Trade Ethereum with up to 100x leverage and maximize your profit potential

    Trade Now on Defx

    Technical Indicators Signal Mixed Sentiment

    Current technical indicators present a mixed outlook:

    • MACD: Losing momentum in the bullish zone, suggesting potential weakness
    • RSI: Trading below 50, indicating bearish short-term sentiment
    • Moving Averages: Price below 100-hour SMA, suggesting immediate bearish pressure

    Frequently Asked Questions

    What is causing Ethereum’s current price correction?

    The correction appears to be technical in nature, following a strong rally above $1,600. Market participants are taking profits while new buyers assess entry points.

    Could Ethereum break above $1,800 in the near term?

    While possible, ETH needs to first clear the immediate resistance at $1,580 and maintain momentum above $1,680 to target the $1,800 level.

    What’s the most important support level to watch?

    The $1,500 level is crucial as it represents both a psychological support and coincides with the 61.8% Fibonacci retracement level.

    Traders should maintain strict risk management practices given the current market volatility. The next 24-48 hours could prove decisive for Ethereum’s short-term price direction.

  • Bitcoin Price Alert: MicroStrategy Faces Potential BTC Liquidation Risk

    In a significant development that could impact the broader cryptocurrency market, MicroStrategy (MSTR) – the largest corporate Bitcoin holder – may face pressure to liquidate some of its massive Bitcoin holdings according to a recent SEC filing. This news comes as Bitcoin continues to show volatility around the $80,000 level, adding another layer of complexity to the situation.

    MicroStrategy’s Bitcoin Position: A Deep Dive into the Numbers

    According to the latest SEC Form 8-K filing, MicroStrategy currently holds an impressive 528,185 BTC, acquired at an average purchase price of $67,458 per Bitcoin. This amounts to a total investment of approximately $35.63 billion, representing one of the largest institutional positions in cryptocurrency history.

    Financial Pressures Mount: Key Risk Factors

    • $8.22 billion in outstanding debt
    • $35.1 million annual interest burden
    • $146.2 million in annual dividend obligations
    • Negative operational cash flow from core business

    SPONSORED

    Trade Bitcoin with up to 100x leverage and maximize your profit potential

    Trade Now on Defx

    Market Impact Analysis

    The potential forced selling scenario could have significant implications for Bitcoin’s price action. With BTC trading at $81,900, just 13% above MicroStrategy’s average purchase price, any substantial price decline could trigger a chain reaction. Recent Bitcoin ETF outflows have already created some market pressure, making this situation particularly delicate.

    Michael Saylor’s Response and Market Sentiment

    Despite the concerns, MicroStrategy’s co-founder Michael Saylor remains steadfast in his Bitcoin conviction. His recent “HODL” tweet garnered over 1.4 million views, demonstrating the crypto community’s intense interest in this developing situation.

    FAQ Section

    What would trigger a forced Bitcoin sale by MicroStrategy?

    A significant drop in Bitcoin’s price below the company’s average purchase price, combined with inability to meet debt obligations, could force liquidation.

    How much Bitcoin does MicroStrategy currently hold?

    The company holds 528,185 BTC, valued at approximately $43.2 billion at current market prices.

    Has MicroStrategy sold Bitcoin before?

    Yes, the company previously sold 704 BTC in December 2022 for $11.8 million.

    Market Outlook and Implications

    As Bitcoin tests crucial support levels, the market remains focused on MicroStrategy’s position as a potential catalyst for price movement. The situation highlights the delicate balance between institutional adoption and market stability in the cryptocurrency ecosystem.