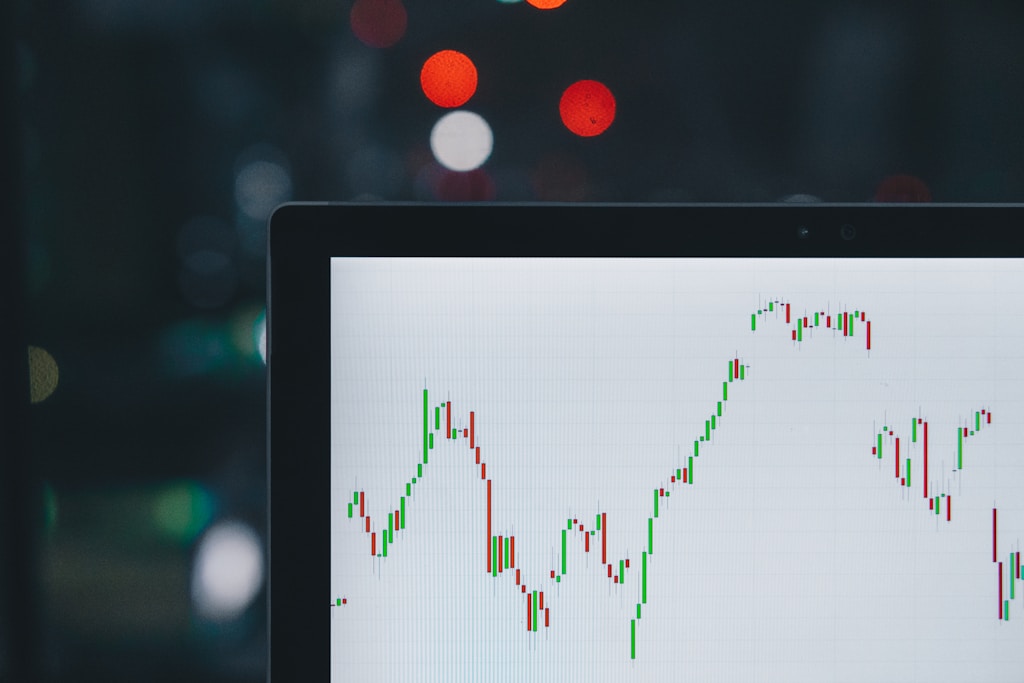
Solana (SOL) is navigating treacherous waters as bulls fight to defend the crucial $125 support level amid mounting bearish pressure. After weeks of aggressive selling, a recent bounce has sparked cautious optimism, though technical indicators suggest this recovery may be short-lived.
Prominent crypto analyst Ali Martinez has identified a concerning technical pattern that could spell trouble for SOL holders. According to Martinez’s analysis, Solana is retesting the breakout zone of a right-angled ascending broadening formation – a pattern historically associated with sharp price declines. This technical setup, combined with broader market uncertainty driven by Trump’s trade policies, paints a potentially bearish picture for SOL’s near-term prospects.
Critical Support Levels Under Pressure
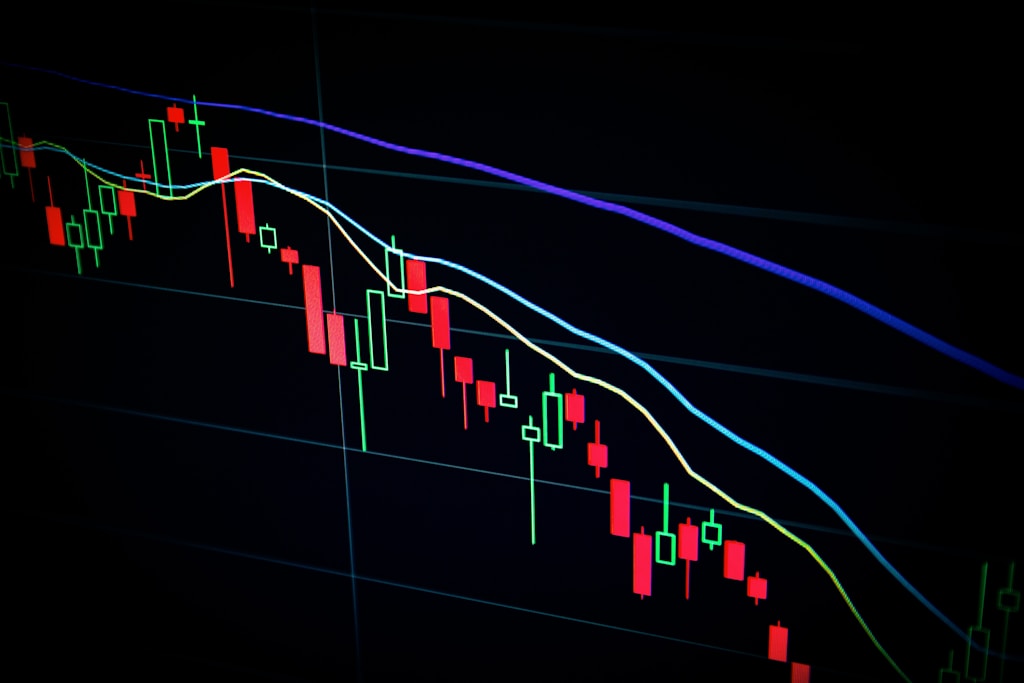
The $125 zone represents a make-or-break level for Solana bulls. A failure to hold this support could trigger a cascade of selling, potentially pushing prices toward Martinez’s bearish target of $65. This would mark a significant drawdown from recent highs and test levels not seen since late 2023.
Key Resistance Levels to Watch
For any meaningful recovery, SOL needs to reclaim several critical resistance levels:
- Immediate resistance: $136 (recent rejection point)
- Secondary resistance: $145-150 zone
- Major psychological level: $150
Market Factors Influencing SOL’s Price Action
Several macro factors are contributing to Solana’s current market position:
- Growing trade war concerns affecting risk assets
- Global market volatility impacting crypto sentiment
- Technical pressure from the bearish pattern formation
FAQ: Key Questions About Solana’s Price Action
Q: What could trigger a recovery in SOL price?
A: A decisive break above $136 with strong volume could signal a trend reversal.
Q: What’s the worst-case scenario for SOL?
A: If current support fails, prices could decline to $65, representing a significant correction.
Q: How does the macro environment affect SOL?
A: Trade tensions and risk-off sentiment could continue pressuring SOL and other altcoins.
Conclusion: Proceed with Caution
While Solana maintains its position above $125, the technical setup suggests traders should remain cautious. The combination of macro headwinds and bearish technical patterns could lead to increased volatility in the coming days. Traders should watch the identified support and resistance levels closely for signs of the next major move.