Tag: Crypto Trading

  • Bitcoin Price Crashes 8% as Trump Tariffs Spark Global Market Fear

    Bitcoin Price Crashes 8% as Trump Tariffs Spark Global Market Fear

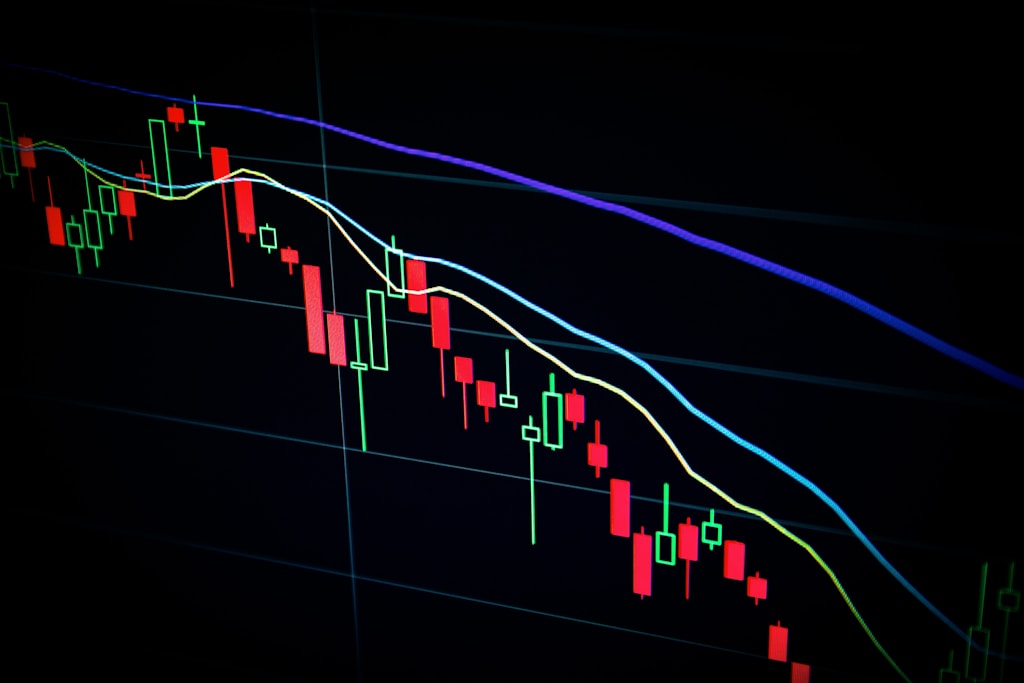
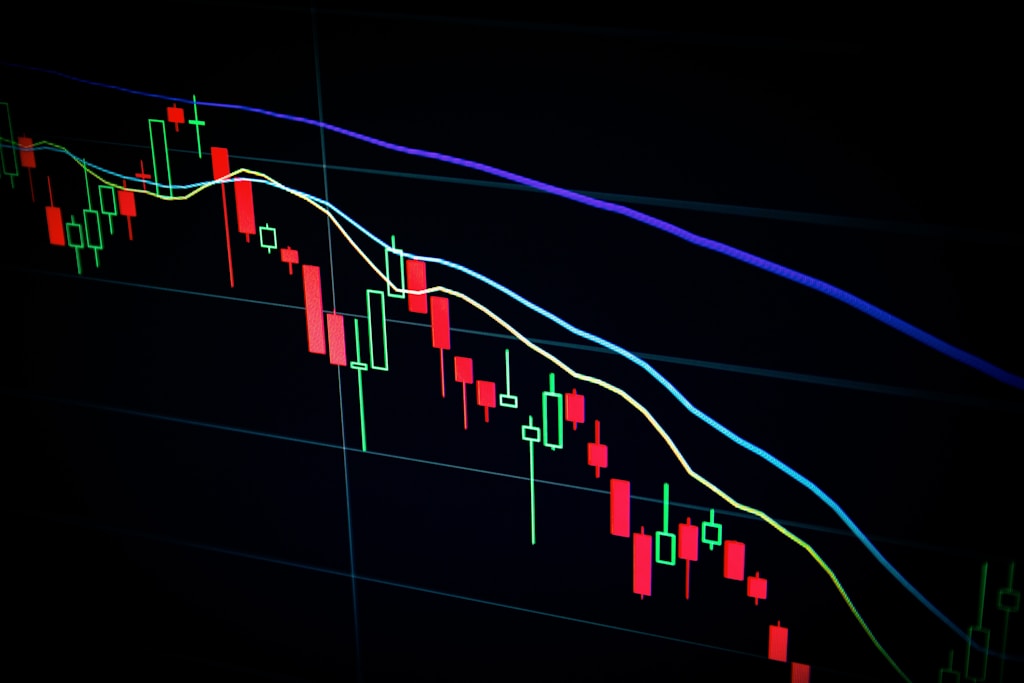
    Bitcoin (BTC) experienced a dramatic 8% price plunge on Wednesday, falling from $88,000 to $81,000 following former President Donald Trump’s announcement of sweeping new tariffs targeting more than 100 countries. This market reaction highlights crypto’s increasing correlation with global macro events and traditional financial markets.

    As market volatility continues to escalate, traders and investors are closely monitoring key support levels and potential further downside risks.

    Key Takeaways:

    • Bitcoin dropped from $88K to $81K within hours of Trump’s tariff announcement
    • Trading volume surged 156% during the selloff
    • Key support level at $80K being tested
    • Market fear index reaches highest level since January 2025

    Market Impact Analysis

    The sudden price movement has triggered a cascade of liquidations across major exchanges, with over $500 million in long positions being cleared within the first hour of the announcement. Technical indicators suggest the $80,000 level represents crucial support, with the 50-day moving average converging at this price point.

    SPONSORED

    Navigate market volatility with up to 100x leverage on perpetual contracts

    Trade Now on Defx

    Expert Analysis

    Market analysts suggest this correction could present a buying opportunity for long-term investors. According to recent data, institutional investors are actively accumulating during this dip, indicating strong fundamental support despite short-term volatility.

    Looking Ahead

    Traders should watch for these key levels and events:

    • Primary support: $80,000
    • Secondary support: $78,500
    • Key resistance: $85,000
    • Volume profile and order book depth suggest strong buying interest below $80K

    FAQ Section

    How long could this market downturn last?

    Historical data suggests similar macro-driven corrections typically resolve within 2-3 weeks.

    What are the implications for other cryptocurrencies?

    Altcoins have experienced even sharper declines, with most major tokens down 10-15%.

    How might this affect Bitcoin’s long-term trajectory?

    Most analysts maintain bullish long-term price targets, viewing this as a temporary correction in a broader uptrend.

    Time to Read: 4 minutes

  • Bitcoin Price Crashes 7% as Trump’s Tariff Shock Rattles Markets

    Bitcoin Price Crashes 7% as Trump’s Tariff Shock Rattles Markets

    Bitcoin’s price experienced a dramatic 7.2% plunge on Wednesday, dropping from $88,526 to $82,150 in just four hours after former President Trump announced sweeping reciprocal tariffs. This market shock, which follows the pattern of recent tariff-related volatility, represents one of the most significant intraday drops for BTC in 2025.

    Understanding the Tariff Impact on Crypto Markets

    The announcement, made during Trump’s “Make America Wealthy Again Event,” outlined plans to implement reciprocal tariffs on 185 countries simultaneously. This unprecedented move sent shockwaves through global markets, with the S&P 500 futures market losing $2 trillion in market capitalization within minutes.

    SPONSORED

    Trade Bitcoin with up to 100x leverage and maximize your profit potential

    Trade Now on Defx

    Market Analysis and Expert Insights

    JPMorgan analysts project the tariffs could raise approximately $400 billion in revenue, equivalent to 1.3% of GDP. This could potentially trigger a recession, especially when combined with the anticipated 1-1.5% increase in PCE prices.

    As recent technical analysis suggests, Bitcoin’s price action may face additional pressure as the tariff situation develops, potentially testing key support levels.

    Economic Implications and Recovery Prospects

    Despite the initial shock, Bitcoin showed signs of resilience, recovering to $83,207 at press time. However, experts warn that continued market uncertainty could lead to increased volatility in the coming weeks.

    FAQ Section

    • How long will the tariff impact last? Analysts expect market volatility to continue for several weeks as global markets adjust to the new tariff regime.
    • Will Bitcoin recover from this drop? While short-term pressure remains, institutional buying activity suggests strong support at current levels.
    • How does this affect crypto trading strategy? Risk management becomes crucial during periods of heightened volatility, with experts recommending reduced leverage and wider stop-losses.
  • Ethereum Price Set for Major Rally Against XRP, Analysts Project $4,800 Target

    Ethereum Price Set for Major Rally Against XRP, Analysts Project $4,800 Target

    Ethereum (ETH) appears poised for a significant price surge against XRP, with multiple analysts projecting strong upside potential for the second-largest cryptocurrency. Recent analysis warning of an ETH drop to $1,400 may need revision as new technical indicators emerge showing bullish momentum.

    Key Technical Analysis Points to ETH Dominance

    CredibullCrypto, a respected market analyst, has identified several compelling reasons why Ethereum is likely to outperform XRP in the coming months:

    • The XRP/ETH trading pair shows clear bearish divergence after a 250% rally
    • Strong support established in ETH’s high-timeframe demand zone
    • Technical indicators suggest XRP may retrace to $1.60-$1.80 range
    • ETH positioned for potential breakout above key resistance levels

    SPONSORED

    Trade Ethereum with up to 100x leverage on perpetual contracts

    Trade Now on Defx

    Price Targets and Support Levels

    Multiple analysts have weighed in with specific price predictions for Ethereum:

    • Immediate resistance zone: $3,600-$4,000
    • Potential breakout target: $4,400-$4,800
    • Critical support levels: $1,800 and $1,200
    • XRP/ETH pair expected to find support at 0.00087-0.00088

    Market Implications and Trading Opportunities

    The current market structure presents several key opportunities for traders:

    1. Potential accumulation zone between $1,800-$2,000
    2. Clear resistance levels for setting take-profit targets
    3. Multiple entry points during expected XRP correction
    4. Long-term upside potential remains intact

    Frequently Asked Questions

    Why is Ethereum expected to outperform XRP?

    Technical indicators show XRP is due for a correction after its recent rally, while Ethereum maintains strong support levels and shows signs of accumulation.

    What are the key price levels to watch?

    Traders should monitor the $1,800 support level and $3,600-$4,000 resistance zone for potential breakout opportunities.

    When could the predicted rally begin?

    Analysts suggest the movement could initiate once XRP completes its correction to the $1.60-$1.80 range, potentially within the next few weeks.

  • Bitcoin Rally Imminent: Fidelity Analyst Predicts Major Price Surge

    Key Takeaways:

    • Fidelity’s research analyst identifies Bitcoin in acceleration phase
    • Dramatic price rally expected as market enters euphoric period
    • Analysis aligns with institutional adoption trends

    Fidelity Digital Assets, one of Wall Street’s most prominent crypto players, has released a bullish analysis suggesting Bitcoin is poised for a significant price surge. Following their recent integration of Bitcoin into retirement plans, the firm’s latest market assessment indicates even more upside potential for the leading cryptocurrency.

    Research Analyst Zack Wainwright from Fidelity Digital Assets has identified that Bitcoin remains in what he terms an ‘acceleration phase’ – a period characterized by heightened volatility and euphoric market sentiment. This phase typically precedes dramatic price appreciation, according to historical patterns.

    Understanding the Acceleration Phase

    The acceleration phase represents a crucial market cycle where institutional and retail interest converge, often leading to exponential price growth. Key characteristics include:

    • Increased institutional adoption
    • Higher trading volumes
    • Enhanced market liquidity
    • Growing mainstream acceptance

    SPONSORED

    Maximize your Bitcoin trading potential with professional-grade tools

    Trade Now on Defx

    Market Implications and Price Discovery

    The potential for Bitcoin to enter price discovery mode suggests we could see unprecedented valuations. This analysis comes at a time when corporate Bitcoin purchases have reached record levels, despite recent market volatility.

    FAQ Section

    Q: What is the acceleration phase in Bitcoin markets?
    A: It’s a period of increased volatility and euphoric sentiment that typically precedes major price rallies.

    Q: How does this align with previous Bitcoin cycles?
    A: Historical data shows acceleration phases often lead to new all-time highs and extended bull runs.

    Q: What role do institutions play in this phase?
    A: Institutional involvement typically increases during acceleration phases, providing additional market liquidity and price support.

  • XRP Price Targets $3.50: Technical Analysis Reveals Bullish Reversal Pattern

    XRP shows strong signs of a bullish reversal, with technical analysis pointing to a potential surge toward $3.50 and beyond. This comprehensive analysis examines the key indicators and price targets that could define XRP’s next major move.

    Key Technical Indicators Signal XRP Bullish Reversal

    According to respected crypto analyst ‘Setupsfx’ on TradingView, XRP has entered a decisive bullish reversal phase after recent consolidation. The analysis comes as Ripple continues to expand its ecosystem, strengthening the fundamental outlook for XRP.

    Current price action at $2.09 suggests significant upside potential, with multiple technical factors aligning:

    • Formation of a three-point trendline rejection
    • Strong accumulation phase indicators
    • Positive momentum in liquidity and IMB zones
    • Bullish low wick formations indicating buyer control

    Short-term and Long-term Price Targets

    The analysis outlines two distinct price targets for XRP traders:

    • Short-term target: $3.50 (68% potential upside)
    • Long-term target: $4.00+ (92% potential upside)

    SPONSORED

    Trade XRP with up to 100x leverage on perpetual contracts

    Trade Now on Defx

    Strategic Entry Points and Risk Management

    For traders looking to capitalize on this potential move, the analysis provides clear entry and exit points:

    • Optimal entry point: $1.80
    • Stop loss level: $1.20
    • First take profit target: $3.50
    • Extended target: $4.00+

    FAQ: XRP Price Reversal Analysis

    Q: What technical indicators support the bullish reversal?
    A: Key indicators include the three-point trendline rejection, accumulation phase patterns, and strong buying pressure in liquidity zones.

    Q: What is the timeframe for the projected price targets?
    A: The $3.50 target is expected in the short term (1-3 months), while the $4.00+ target is a longer-term projection (3-6 months).

    Q: What are the main risks to this bullish scenario?
    A: Key risks include broader market volatility, regulatory developments, and potential resistance at previous high levels around $3.84.

    Conclusion: XRP’s Path to New Highs

    While the analysis maintains a neutral stance acknowledging market uncertainties, the technical setup strongly suggests XRP is positioned for significant upside potential. Traders should monitor key support and resistance levels while maintaining proper risk management strategies.

  • Bitcoin Price Drops Below $85K as Trump’s Tariff Plans Shake Markets

    Bitcoin’s price experienced downward pressure today as former President Donald Trump’s plans for global ‘reciprocal’ tariffs continue to rattle financial markets. This follows recent market uncertainty surrounding what Trump has dubbed ‘Liberation Day.’

    Market Impact of Trump’s Tariff Announcement

    The cryptocurrency market showed immediate reaction to Trump’s aggressive stance on international trade policy, with Bitcoin serving as a barometer for broader market sentiment. The leading cryptocurrency’s price movement reflects growing concerns about potential economic implications of widespread tariff implementation.

    SPONSORED

    Trade Bitcoin with up to 100x leverage and maximize your profit potential

    Trade Now on Defx

    Global Economic Implications

    The proposed tariffs could have far-reaching consequences for international trade relations and global markets. Market volatility has increased as investors assess the potential impact on various sectors and asset classes.

    Expert Analysis

    Market analysts suggest that while Bitcoin has traditionally served as a hedge against economic uncertainty, the immediate reaction to trade policy changes demonstrates the asset’s increasing correlation with traditional markets during periods of significant policy shifts.

    FAQ Section

    How will Trump’s tariffs affect Bitcoin price?

    The immediate impact appears negative, but long-term implications remain uncertain as markets digest the policy implications.

    What is ‘Liberation Day’?

    It’s Trump’s self-imposed deadline for implementing his proposed global reciprocal tariff policy.

    Could Bitcoin benefit from economic uncertainty?

    Historically, Bitcoin has shown potential as a safe-haven asset during economic uncertainty, though current market conditions show increased correlation with traditional markets.

  • Dogecoin Price Surge: AI Predicts 229% Rally to $0.57 by April 28

    A sophisticated machine learning algorithm from CoinCodex has predicted a massive 229.55% surge in Dogecoin (DOGE) price, targeting $0.57 by April 28, 2025. This bullish forecast comes at a crucial time for the leading meme cryptocurrency, which has recently shown signs of bottoming out after a challenging first quarter.

    As recent technical analysis has confirmed a bullish reversal signal with RSI hitting oversold territory, this AI-powered prediction adds another layer of optimism to DOGE’s potential recovery.

    Key Highlights of the AI Price Prediction

    • Target Price: $0.57
    • Potential Gain: 229.55%
    • Timeline: By April 28, 2025
    • Current Price: $0.17

    SPONSORED

    Trade DOGE with up to 100x leverage on perpetual contracts

    Trade Now on Defx

    Technical Analysis Supports Bullish Outlook

    Multiple technical indicators align with the AI prediction:

    • TD Sequential: Buy signal on weekly chart
    • Price Channel: Trading at lower boundary, suggesting potential reversal
    • Higher Lows Pattern: Consistent formation indicating accumulation phase

    Expert Price Predictions

    Several prominent analysts have shared similar bullish outlooks:

    • Javon Marks: Projects 270% rally to $0.65
    • Master Kenobi: Predicts $1 by June 2025
    • Trader Tardigrade: Forecasts new ATH at $3.7
    • Ali Martinez: Technical analysis suggests $4 target

    Market Context and Historical Performance

    Despite recording its worst Q1 performance in seven years with a 47% loss, DOGE appears positioned for a strong recovery. The current market structure mirrors the 2017 bull run pattern, suggesting a potential second phase of the current bull market.

    FAQ Section

    What is driving the potential Dogecoin price surge?

    Technical indicators, historical patterns, and machine learning predictions suggest a combination of oversold conditions and market cycle timing.

    When could Dogecoin reach $1?

    According to analyst Master Kenobi, DOGE could reach $1 by June 2025, following similar patterns to the 2017 bull run.

    Is now a good time to invest in Dogecoin?

    Multiple technical indicators suggest DOGE is at a potential bottom, but investors should conduct their own research and consider their risk tolerance.

    Current market data shows DOGE trading at $0.17, with a 1% increase in the last 24 hours. While short-term sentiment remains cautious, the confluence of technical indicators and AI predictions suggests significant upside potential for the leading meme cryptocurrency.

  • JUST (JST) Launches on Kraken with $90K REEF Airdrop Program

    JUST (JST) Launches on Kraken with $90K REEF Airdrop Program

    JUST (JST) Launches on Kraken with $90K REEF Airdrop Program

    In a significant development for the TRON ecosystem, Kraken, one of the world’s premier cryptocurrency exchanges, has officially listed JUST (JST), the native governance token of the JUST DeFi protocol. The listing comes with an attractive $90,000 REEF program airdrop, marking a major milestone for both platforms.

    Key Highlights of the JUST (JST) Kraken Listing

    • Official listing of JST on Kraken’s regulated platform
    • $90,000 REEF program airdrop for eligible participants
    • Integration with TRON’s growing DeFi ecosystem
    • Enhanced liquidity options for JST holders

    SPONSORED

    Trade JST with up to 100x leverage on perpetual contracts

    Trade Now on Defx

    Understanding the JUST Protocol and JST Token

    JUST is a prominent decentralized finance (DeFi) ecosystem built on the TRON network. The protocol enables users to participate in various DeFi activities, including lending, borrowing, and governance. JST token holders can:

    • Participate in governance decisions
    • Stake tokens for rewards
    • Access premium features within the ecosystem
    • Contribute to protocol development

    REEF Program Airdrop Details

    The $90,000 REEF program airdrop represents a significant opportunity for early adopters and existing JST holders. Participants can qualify for the airdrop by meeting specific criteria:

    Requirement Reward Tier
    JST Trading Volume Proportional allocation
    Account Verification Required
    Holding Period To be announced

    Impact on TRON’s DeFi Ecosystem

    The Kraken listing represents a significant milestone for TRON’s DeFi ecosystem, potentially increasing JST’s liquidity and accessibility to a broader market of institutional and retail investors.

    Frequently Asked Questions

    What is JUST (JST)?

    JST is the governance token of the JUST protocol, a DeFi platform built on TRON that enables lending, borrowing, and staking services.

    How can I participate in the REEF airdrop?

    Details about participation requirements and eligibility will be announced through Kraken’s official channels.

    When will trading begin?

    Trading for JST on Kraken is now live, with both spot and margin trading options available.

    Market Implications and Future Outlook

    The listing on Kraken, combined with the REEF program airdrop, could potentially catalyze increased adoption and price appreciation for JST. This development aligns with the broader trend of centralized exchanges expanding their DeFi token offerings.

    Conclusion

    The listing of JUST (JST) on Kraken marks a significant milestone for the TRON DeFi ecosystem. With the added incentive of the $90,000 REEF program airdrop, this development could attract new users and capital to the platform while enhancing JST’s market presence.

  • Bitcoin Holds $85K as Trump’s ‘Liberation Day’ Sparks Market Tension

    Bitcoin Holds $85K as Trump’s ‘Liberation Day’ Sparks Market Tension

    Bitcoin continues to demonstrate remarkable resilience, maintaining its position above $85,000 despite growing market uncertainty surrounding President Trump’s highly anticipated ‘Liberation Day’ tariff announcement. As previously reported, the cryptocurrency market has been closely watching these developments for potential impact on digital assets.

    Market Impact and Bitcoin’s Resilience

    While traditional markets nervously await Trump’s tariff announcement scheduled for 4 p.m. ET, Bitcoin has demonstrated impressive stability, trading at $85,063.12 with minimal 24-hour volatility (+1.19%). This resilience is particularly noteworthy given the broader economic concerns, including the Atlanta Fed’s GDPNow model projecting a dramatic Q1 contraction of -3.7%.

    Comparative Performance Analysis

    Bitcoin’s current position, while 25% below its January all-time high of $109,000, places it squarely in the middle of the “Magnificent 7” tech stocks’ performance range. Here’s how the leading cryptocurrency compares:

    • Apple: -17%
    • Microsoft: -22%
    • Amazon: -24%
    • Bitcoin: -25%
    • Meta: -25%
    • Google: -26%
    • NVIDIA: -32%
    • Tesla: -50%

    Historical Context and Market Evolution

    The cryptocurrency’s current market behavior represents a significant evolution from previous cycles. In 2022, BTC experienced a 75% decline from its peak to $15,500, more than double the Nasdaq-100 ETF’s 34% drop. This year’s more modest 30% correction versus QQQ’s 16% suggests increasing market maturity.

    SPONSORED

    Trade Bitcoin with up to 100x leverage on perpetual contracts

    Trade Now on Defx

    Key Market Indicators

    Several technical indicators suggest continued market resilience:

    • BTC Dominance: 62.68% (0.21% increase)
    • Total Fees: 4.35 BTC ($366,246)
    • CME Futures Open Interest: 135,350 BTC
    • Hashrate: 819 EH/s (7-day moving average)

    Looking Ahead: Critical Factors

    Market participants should monitor several key events that could impact Bitcoin’s price action:

    • Trump’s tariff announcement (4 p.m. ET)
    • Fed speeches from Governor Kugler and Vice Chair Jefferson
    • Upcoming House Financial Services Committee hearings on crypto regulation

    FAQ Section

    How will Trump’s tariffs affect Bitcoin?

    While direct impact remains uncertain, historical data suggests Bitcoin could benefit from economic uncertainty as a hedge against traditional market volatility.

    What support levels should traders watch?

    Key support levels include $82,000 and $80,000, with resistance at $87,500 and $90,000.

    Is Bitcoin’s correlation with tech stocks strengthening?

    Current data shows a moderating correlation, with Bitcoin demonstrating increased independence in recent market movements.

  • BNB Price Battles $600 Support: Critical Levels for Bulls and Bears

    BNB, Binance’s native token, is facing a crucial battle at the $600 support level as bears and bulls engage in a tug-of-war that could determine its short-term trajectory. Recent price action shows BNB attempting to recover from $588 while encountering significant resistance, mirroring broader market uncertainty as Bitcoin similarly tests key resistance levels.

    Key BNB Price Levels to Watch

    The cryptocurrency has established several critical price levels that traders should monitor:

    • Current Support: $600
    • Secondary Support: $598
    • Critical Resistance: $610
    • Breakout Target: $618

    Technical Analysis Deep Dive

    BNB’s price action reveals a concerning pattern as it trades below both $610 and the 100-hourly simple moving average. A short-term declining channel has formed with resistance at $610, suggesting potential bearish pressure.

    SPONSORED

    Trade BNB with up to 100x leverage on perpetual contracts

    Trade Now on Defx

    Bullish Scenario

    For bulls to regain control, BNB needs to:

    • Break above $610 resistance
    • Clear the $612 hurdle
    • Establish support above $620

    Bearish Risk Factors

    Several technical indicators suggest caution:

    • MACD showing bearish momentum
    • RSI below 50, indicating bearish control
    • Price below key moving averages

    FAQ

    What’s the next major support for BNB if $600 breaks?

    The next significant support level sits at $594, followed by $585.

    What’s the potential upside target if bulls prevail?

    A successful break above $620 could trigger a rally toward $635.

    How does BNB’s current pattern compare to other major cryptocurrencies?

    BNB’s declining channel formation mirrors similar patterns seen in other major cryptocurrencies, suggesting market-wide uncertainty.

    Time to Read: 4 minutes