Tag: Crypto Trading

  • KEKIUS Token Soars 120% After Elon Musk’s X Profile Change

    KEKIUS Token Soars 120% After Elon Musk’s X Profile Change

    In a dramatic display of Elon Musk’s continued influence over crypto markets, the KEKIUS token surged 120% after the tech mogul changed his X (formerly Twitter) profile name to “Kekius Maximus.” The meme token, which runs on both Solana and Ethereum networks, saw its value skyrocket from $0.025 to $0.0502 within 24 hours of Musk’s profile update.

    Market Impact and Historical Context

    This isn’t the first time Musk’s social media activity has triggered significant price movements in the crypto market. Last December, a similar profile change to “Kekius Maximus” resulted in a 500% price surge before the inevitable correction. The pattern highlights the volatile nature of meme-based cryptocurrencies and their susceptibility to celebrity influence.

    SPONSORED

    Trade meme coins with up to 100x leverage on perpetual contracts

    Trade Now on Defx

    Technical Analysis and Price Movement

    According to data from Binance and CoinMarketCap, KEKIUS experienced these key movements:

    • Initial price: $0.025
    • Peak price: $0.0502
    • 24-hour gain: 119%
    • Historical high: $0.25 (at launch)

    Understanding KEKIUS Token

    The token’s name combines multiple cultural elements:

    • “Kek” – Derived from gaming culture and Egyptian mythology
    • “Maximus” – Reference to popular culture and Roman history
    • Dual-chain deployment on Ethereum and Solana networks

    Risk Analysis and Market Warning

    Investment experts and market analysts warn about the high-risk nature of celebrity-influenced tokens. These assets typically show extreme volatility and lack fundamental value propositions, making them particularly dangerous for retail investors.

    FAQ Section

    What is KEKIUS token?

    KEKIUS is a meme-inspired cryptocurrency that runs on both Ethereum and Solana blockchains, gaining popularity through Elon Musk’s social media influence.

    Why did KEKIUS price surge?

    The price increased by 120% after Elon Musk changed his X profile name to “Kekius Maximus,” triggering widespread trading activity.

    Is KEKIUS a safe investment?

    Like most meme tokens, KEKIUS carries significant risk due to its high volatility and dependence on social media influence rather than fundamental value.

    Featured image: Gemini Imagen

  • Bitcoin Dominance Decline Signals Market Shift: Analysts Urge Caution

    Bitcoin Dominance Decline Signals Market Shift: Analysts Urge Caution

    Bitcoin’s market dominance is showing signs of weakness, but cryptocurrency analysts warn that celebrating an imminent altcoin season might be premature. According to Grayscale’s Head of Macro Strategy Zach Pandl, Bitcoin’s dominance is more likely to plateau rather than experience a sharp decline.

    This development comes as Bitcoin continues to show strong correlation with traditional markets, suggesting that broader market forces are at play rather than a simple rotation into altcoins.

    Understanding Bitcoin’s Market Dominance

    Bitcoin’s market dominance, which measures BTC’s market capitalization as a percentage of the total cryptocurrency market cap, has been a crucial indicator for crypto market cycles. Historical data shows that declining Bitcoin dominance often precedes significant altcoin rallies.

    Expert Analysis and Market Implications

    Grayscale’s Pandl suggests that the current market dynamics differ from previous cycles. “We’re seeing a more mature market where Bitcoin’s dominance patterns may not follow historical precedents,” he explains.

    SPONSORED

    Maximize your trading potential with up to 100x leverage on perpetual contracts

    Trade Now on Defx

    FAQ: Bitcoin Dominance and Market Trends

    What does declining Bitcoin dominance mean for altcoins?

    While historically a decline in Bitcoin dominance has signaled altcoin rallies, current market conditions suggest a more nuanced outlook.

    Is this the start of altcoin season?

    Analysts remain cautious about declaring an altcoin season, citing the likelihood of Bitcoin dominance plateauing rather than sharply declining.

    What factors influence Bitcoin’s market dominance?

    Key factors include institutional adoption, market maturity, regulatory developments, and overall crypto market sentiment.

  • Ethereum Price Faces Critical $2,350 Support Test After Lower Lows

    Ethereum Price Faces Critical $2,350 Support Test After Lower Lows

    Ethereum’s price trajectory has taken a concerning turn as the leading altcoin faces mounting selling pressure after briefly touching $2,700. Recent analysis had suggested a potential breakout following multi-year consolidation, but the current price action indicates bears may have other plans.

    Technical Analysis Shows Troubling Lower Low Pattern

    Renowned crypto analyst Gianni Pichichero has identified a series of bearish technical formations that could spell trouble for ETH holders. The week started promisingly with ETH reaching $2,700 – its highest level in over a month – but quickly gave way to sustained selling pressure.

    Key price levels to watch:

    • Current support: $2,350
    • Recent high: $2,700
    • Next major support: $2,200
    • Critical resistance: $2,550

    Daily Price Action Breakdown

    The week’s price action reveals a clear shift in market sentiment:

    • Monday: Bullish breakout to $2,700
    • Tuesday: Higher high confirmed, strong close
    • Wednesday: First red close, consolidation phase
    • Thursday: Full bearish reversal, lower lows established

    SPONSORED

    Trade Ethereum with up to 100x leverage on perpetual contracts

    Trade Now on Defx

    Market Implications and Trading Strategy

    The formation of consecutive lower lows suggests increased selling pressure and potential further downside. Traders should watch for:

    • Triple top formations near recent highs
    • Double top reversal patterns
    • Volume confirmation on breakouts
    • RSI divergence signals

    FAQ

    What caused Ethereum’s recent price decline?

    The decline appears technical in nature, triggered by profit-taking after reaching $2,700 and subsequent bearish formation of lower lows.

    Could Ethereum bounce back from current levels?

    While possible, the current technical structure suggests more downside potential before a significant recovery.

    What’s the worst-case scenario for ETH price?

    Technical analysis suggests potential support at $2,350, with a break below potentially targeting $2,200.

    As the situation develops, traders are advised to maintain strict risk management and watch for confirmation of trend reversals before taking significant positions.

  • Dogecoin Whales Accumulate $300M as On-Chain Metrics Signal Breakout

    Dogecoin Whales Accumulate $300M as On-Chain Metrics Signal Breakout

    Fresh on-chain data reveals major Dogecoin (DOGE) investors have quietly accumulated over $300 million worth of tokens in the past month, potentially setting the stage for a significant price breakout. This surge in whale activity comes as multiple technical indicators align to suggest DOGE could be preparing for its next major move.

    Whale Accumulation Hits 4-Week High

    According to data from Santiment, addresses holding between 100 million and 1 billion DOGE have increased their collective balance from 24.6 billion to nearly 26 billion DOGE between April 13 and May 13. This 1.4 billion DOGE accumulation, worth approximately $300 million, represents one of the most significant periods of whale accumulation in 2025.

    This accumulation pattern shows striking similarities to previous whale activity that preceded major price movements, suggesting institutional and large-scale investors may be positioning themselves for an anticipated upward move.

    Network Activity Surges to Record Levels

    Supporting the bullish narrative, network metrics have shown remarkable growth:

    • Daily active addresses peaked at 680,000 (May 12-13)
    • Transaction volume reached $1.21 billion
    • Large transactions ($1M+) have increased significantly

    SPONSORED

    Trade DOGE with up to 100x leverage and maximize your potential returns

    Trade Now on Defx

    Critical Price Levels to Watch

    DOGE currently trades at $0.22, facing crucial resistance between $0.24-$0.26. A breakthrough above this range could trigger a rally toward $0.30, while failure might see prices retreat to mid-$0.17 support levels.

    Expert Analysis and Price Targets

    Market analyst Ali Martinez suggests that a decisive close above $0.26 could spark a new bull run, potentially leading to significantly higher prices. The combination of whale accumulation and increasing network activity provides fundamental support for this bullish outlook.

    Frequently Asked Questions

    What is driving the current Dogecoin accumulation?

    Large investors appear to be positioning themselves ahead of potential market movements, with on-chain data showing significant whale accumulation over the past month.

    What are the key resistance levels for DOGE?

    The primary resistance zone lies between $0.24-$0.26, with $0.30 serving as the next major target if this range is broken.

    How significant is the current whale activity?

    The recent accumulation of 1.4 billion DOGE ($300M) by large holders represents one of the most substantial periods of whale activity in 2025.

    As the market awaits a potential breakout, investors should monitor whale activity and network metrics for confirmation of the current bullish setup. The next few weeks could prove crucial for DOGE’s price trajectory.

  • Bitcoin Double Top Pattern Signals $100K Crash, Analyst Warns

    Bitcoin Double Top Pattern Signals $100K Crash, Analyst Warns

    Bitcoin’s meteoric rise above $100,000 could be setting up for a dramatic reversal, according to a concerning technical analysis that’s gaining attention in the crypto community. Recent data showing increased sell pressure from short-term holders adds weight to this bearish outlook.

    Double Top Pattern Emerges as Major Warning Sign

    Jacob King, CEO of WhaleWire, has identified a potentially devastating double-top pattern in Bitcoin’s price chart that mirrors previous market cycle peaks. This technical formation has historically preceded major market crashes, with striking similarities to the patterns observed in 2017 and 2021.

    The analysis gains credibility when viewed alongside recent SuperTrend indicators flashing critical sell signals at the $109K level, suggesting multiple technical factors are aligning for a potential downturn.

    SPONSORED

    Trade Bitcoin with up to 100x leverage and stay ahead of market movements

    Trade Now on Defx

    Historical Pattern Analysis

    The double-top pattern has emerged as follows:

    • 2017: Led to an 84% price crash
    • 2019: Triggered a moderate correction
    • 2021: Preceded the two-year bear market
    • 2025: Currently forming similar structure

    Tether Concerns Amplify Crash Risks

    Beyond technical indicators, King raises alarming questions about market manipulation through Tether (USDT) issuance. The analyst suggests artificial buying pressure could be masking underlying weakness in genuine demand.

    Expert Analysis and Market Implications

    While some analysts maintain bullish outlooks, with Tim Draper recently reaffirming his $250K Bitcoin price target, King’s analysis suggests investors should exercise extreme caution.

    FAQ Section

    What is a double-top pattern?

    A double-top pattern is a technical analysis formation where an asset reaches a high price twice, failing to break through. It often signals a trend reversal.

    How reliable are double-top patterns in crypto?

    In Bitcoin’s history, double-top patterns have preceded significant corrections with approximately 80% accuracy in major market cycles.

    What are the key price levels to watch?

    Current support levels sit at $100,000, with the pattern suggesting potential drops to previous cycle lows if broken.

  • Coinbase Powers Webull Pay’s Crypto Trading Infrastructure in Major Deal

    Coinbase Powers Webull Pay’s Crypto Trading Infrastructure in Major Deal

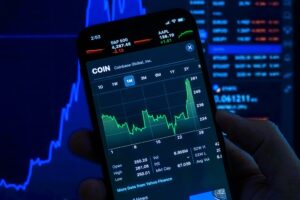
    In a significant development for institutional crypto adoption, Coinbase has announced a strategic partnership with Webull Pay to provide comprehensive cryptocurrency trading and custody services through its Crypto-as-a-Service (CaaS) platform. The collaboration, set to launch in June 2025, marks a notable expansion of Coinbase’s B2B infrastructure offerings.

    Key Partnership Details

    Under the agreement, Webull Pay will leverage Coinbase’s institutional-grade infrastructure, including:

    • Advanced trading systems and execution services
    • Secure custody solutions
    • Staking infrastructure
    • Compliance and regulatory frameworks

    This partnership comes at a crucial time, following Coinbase’s recent inclusion in the S&P 500, highlighting the growing mainstream acceptance of crypto infrastructure providers.

    Impact on Institutional Crypto Adoption

    The integration of Coinbase’s CaaS platform into Webull Pay’s services represents a significant step forward in institutional crypto adoption. This move aligns with the broader trend of traditional financial institutions seeking robust crypto infrastructure solutions.

    SPONSORED

    Trade with confidence using institutional-grade infrastructure

    Trade Now on Defx

    Security and Compliance Focus

    Following recent industry security challenges, including the significant security incident at Coinbase, the partnership emphasizes enhanced security measures and regulatory compliance protocols.

    FAQ Section

    When will the Webull Pay crypto services launch?

    The services are scheduled to launch in June 2025.

    What cryptocurrencies will be supported?

    The specific list of supported cryptocurrencies will be announced closer to the launch date.

    How does this affect existing Webull Pay users?

    Existing users will gain access to enhanced crypto trading and custody features through the Coinbase integration.

  • PEPE Price Surges 90%: MIND of Pepe AI Token Gains Traction

    PEPE Price Surges 90%: MIND of Pepe AI Token Gains Traction

    The meme coin market is witnessing another surge as PEPE ($PEPE) posts remarkable gains, climbing over 90% in the past month. This price action coincides with growing interest in AI-powered crypto projects, particularly the emerging MIND of Pepe platform.

    PEPE’s Recent Price Performance

    Since its launch in April 2023, PEPE has demonstrated significant volatility and growth potential. The token recently broke above critical technical indicators, with its price rising from $0.000008087 to $0.000013612 – a 68% increase in just one week. This movement aligns with broader meme coin market strength, as seen in Dogecoin’s recent consolidation pattern.

    Technical Analysis and Market Indicators

    Key technical factors supporting PEPE’s upward momentum include:

    • Break above 20 and 50 EMAs
    • 24-hour trading volume reaching $1.47B
    • Strong support zone confirmation
    • Potential for 100% upside to previous all-time highs

    SPONSORED

    Trade meme coins with up to 100x leverage on perpetual contracts

    Trade Now on Defx

    MIND of Pepe: The AI-Powered Evolution

    While PEPE’s price action captures attention, MIND of Pepe ($MIND) represents an innovative fusion of meme culture and artificial intelligence. Currently in presale at $0.0037515, the project has raised over $9.3M and offers unique features:

    • AI-powered market analysis and token recommendations
    • Integration with crypto influencer insights
    • Real-time social sentiment analysis
    • 244% APY staking rewards during presale

    Investment Outlook and Considerations

    While PEPE shows strong momentum, MIND of Pepe presents a unique value proposition combining meme appeal with practical utility. The project’s AI capabilities and staking rewards offer potential advantages over traditional meme tokens.

    Risk Factors

    Investors should consider:

    • High volatility in meme coin markets
    • Regulatory uncertainties
    • Project execution risks
    • Market sentiment shifts

    FAQ Section

    What is driving PEPE’s current price surge?

    Technical breakouts, increased trading volume, and renewed interest in meme coins are primary factors behind PEPE’s recent price appreciation.

    How does MIND of Pepe differ from traditional meme coins?

    MIND of Pepe combines meme culture appeal with practical AI utility, offering market analysis tools and staking rewards.

    What are the potential returns for MIND token holders?

    Projections suggest potential growth to $0.030 by 2030, though such forecasts should be viewed with appropriate caution.

  • Bitcoin SOPR Spike Signals Profit-Taking as Price Tests $102K Support

    Bitcoin’s recent rally has hit a temporary roadblock as the cryptocurrency retraces from its $104,000 peak. The leading digital asset is currently trading at $102,004, showing a modest 1.2% decline over the past 24 hours while maintaining an impressive 20% monthly gain. This price action comes as key on-chain metrics reveal interesting dynamics between different holder groups.

    As noted in our recent analysis showing long-term holders’ reluctance to sell at $101K, the market continues to display mixed signals regarding investor behavior.

    Long-Term Holder SOPR Analysis Reveals Profit-Taking Patterns

    CryptoQuant analyst Carmelo Alemán’s latest research highlights a significant 71.33% increase in the Bitcoin SOPR (Spent Output Profit Ratio) for long-term holders since March 12. This metric indicates that coins moved by seasoned investors are being sold at an average profit of 227.41%, suggesting strategic profit-taking is underway.

    SPONSORED

    Trade Bitcoin with up to 100x leverage and maximize your profit potential

    Trade Now on Defx

    Contrasting Market Perspectives

    However, another CryptoQuant analyst, ShayanMarkets, presents a different view, suggesting that while some profit-taking is occurring, long-term holders aren’t significantly contributing to selling pressure. This aligns with recent institutional developments, including major ETF investments from Abu Dhabi funds.

    FAQ: Understanding Bitcoin SOPR

    What is Bitcoin SOPR?

    SOPR (Spent Output Profit Ratio) measures the profit ratio of coins moved on-chain, helping identify whether holders are selling at a profit or loss.

    Why is the current SOPR significant?

    The 71.33% increase indicates substantial profit-taking by long-term holders, potentially signaling a local top or consolidation phase.

    What does this mean for Bitcoin’s price?

    While profit-taking could create short-term selling pressure, strong institutional demand and holding patterns suggest the broader uptrend remains intact.

    Market Outlook and Technical Levels

    Bitcoin currently sits at a critical juncture, with $100,000 serving as major psychological support. The recent pullback aligns with typical profit-taking behavior seen in previous bull markets, though institutional involvement may provide stronger support levels than in past cycles.

  • BNB Price Targets $700 as Bulls Break Key Resistance Level

    BNB Price Targets $700 as Bulls Break Key Resistance Level

    BNB, the native token of the Binance ecosystem, is showing strong bullish momentum as it consolidates above critical support levels. Technical analysis suggests the token could be preparing for its next major move toward the $700 mark, amid improving market sentiment and increasing trading volumes.

    BNB Technical Analysis: Key Price Levels to Watch

    BNB has established a solid foundation above the $640 support zone, demonstrating resilience in the face of recent market volatility. The asset is currently trading above $655 and the 100-hourly simple moving average, suggesting strong underlying momentum. As noted in our recent analysis of the broader crypto market surge, institutional inflows are supporting the overall market recovery.

    Critical Support and Resistance Levels

    • Current Support: $642 (primary)
    • Secondary Support: $650
    • Key Resistance: $660
    • Major Target: $700

    SPONSORED

    Trade BNB with up to 100x leverage and maximize your profit potential

    Trade Now on Defx

    Technical Indicators Signal Bullish Momentum

    The technical outlook for BNB remains predominantly bullish, supported by several key indicators:

    • MACD showing increasing momentum in the bullish zone
    • RSI maintaining position above 50, indicating healthy buying pressure
    • Break above bearish trend line at $652
    • 50% Fibonacci retracement level cleared

    Price Targets and Potential Scenarios

    Based on current technical formations, BNB could target several key price levels:

    Bullish Scenario

    • Immediate target: $670
    • Secondary target: $678
    • Major resistance: $685
    • Ultimate target: $700

    Bearish Scenario

    • Initial support: $652
    • Critical support: $642
    • Danger zone: Below $630

    FAQ Section

    What is driving BNB’s current price movement?

    BNB’s price action is supported by technical breakouts above key resistance levels and increasing trading volume across Binance’s ecosystem.

    What are the key levels traders should watch?

    Traders should monitor the $660 resistance and $642 support levels as these represent critical price points for BNB’s next directional move.

    Could BNB reach $700 in the near term?

    Technical indicators suggest $700 is a realistic target if BNB maintains support above $642 and successfully breaks through the $670 resistance zone.

    Conclusion

    BNB’s technical setup suggests a strong possibility of continued upward momentum, with $700 representing a key psychological target. However, traders should maintain strict risk management practices and monitor key support levels, particularly around $642.

  • XRP Price Correlation with Crude Oil Signals Potential Breakout to $3

    XRP Price Correlation with Crude Oil Signals Potential Breakout to $3

    A groundbreaking analysis has revealed an unexpected correlation between XRP and crude oil prices, potentially signaling a major price breakout for the cryptocurrency. Independent market technician Dom (@traderview2) has identified a critical pattern in the XRP/USOIL trading pair that could forecast significant upside potential.

    XRP/USOIL Technical Analysis Reveals Critical Pattern

    The analysis shows XRP/USOIL encountering strong resistance between 0.0418 and 0.0430, a level that has capped price action since December. This technical formation aligns with recent XRP price action showing critical support at $2.37, suggesting a potential consolidation before the next major move.

    SPONSORED

    Trade XRP with up to 100x leverage and maximize your profit potential

    Trade Now on Defx

    Institutional Absorption Signals Bullish Momentum

    Despite $210 million in net selling pressure over the past week, XRP has maintained its upward trajectory, suggesting strong institutional accumulation. This resilience echoes recent predictions of an XRP price explosion targeting $3.30+, supported by increasing whale activity.

    Key Technical Levels to Watch

    • Immediate Resistance: 0.0418-0.0430 (XRP/USOIL)
    • Critical Support: 0.0394
    • Secondary Support: 0.0378
    • Floor Level: 0.0357

    FAQ: XRP/USOIL Correlation

    Q: Why is the XRP/USOIL ratio significant?
    A: This ratio provides a unique perspective on XRP’s value relative to a major commodity, potentially revealing patterns not visible in USD pairs.

    Q: What could trigger a breakout?
    A: A two-hour close above 0.0430 could signal the start of a new upward impulse, potentially driving XRP toward new all-time highs.

    Q: How does this affect XRP’s dollar value?
    A: Historical analysis suggests that a breakout in the XRP/USOIL ratio often precedes significant USD price appreciation.

    At press time, XRP trades at $2.46, maintaining its position above crucial support levels while building momentum for a potential breakout.