Tag: Crypto Trading

  • Bitcoin Price Tests $78.6K Support as Trump Tariffs Fuel Market Fear

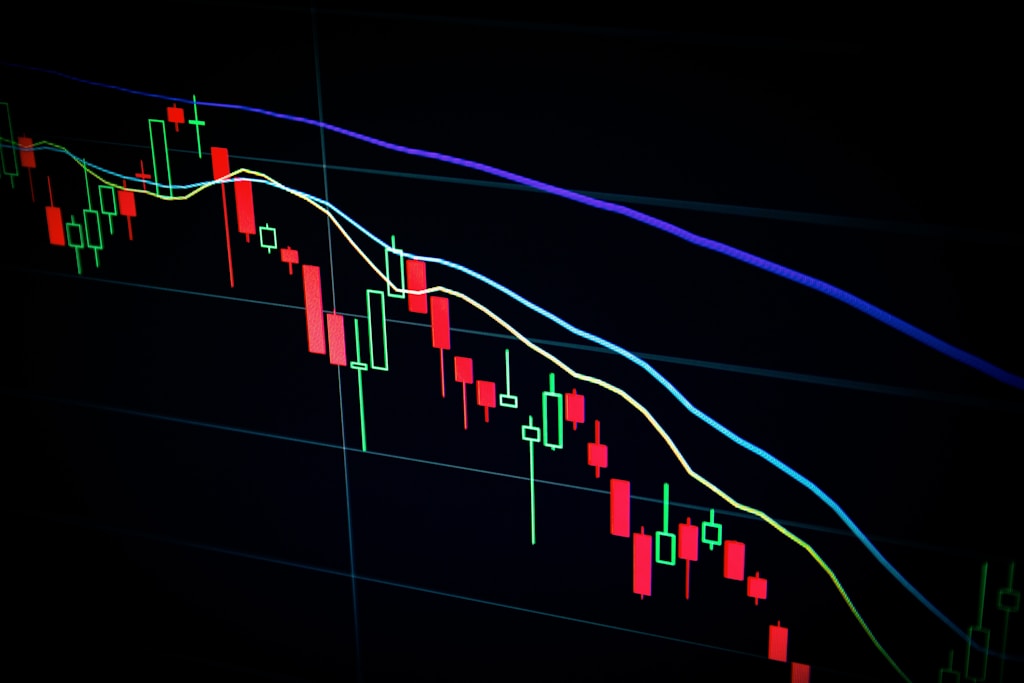
    Bitcoin (BTC) faces a critical juncture as it struggles to maintain support levels amid growing macroeconomic uncertainty. The leading cryptocurrency is currently testing key technical levels after being rejected at descending resistance, with analysts eyeing $78,600 as a potential bearish target.

    In a significant development that has rattled markets, Trump’s recent tariff announcements have triggered widespread selling pressure across crypto markets, adding another layer of complexity to Bitcoin’s technical outlook.

    Market Analysis: Key Support and Resistance Levels

    Bitcoin is currently trading at $83,500, down 25% from January’s all-time high. The asset faces several critical technical levels:

    • Immediate resistance: $85,000 (4H 200MA)
    • Key breakthrough level: $86,000 (4H EMA)
    • Critical support: $81,000
    • Bearish target: $78,600

    Trading volume has shown concerning signs of decline, typically a precursor to major price movements. While retail investors show signs of panic selling, whale addresses have been accumulating, creating an interesting dynamic in the market.

    SPONSORED

    Trade Bitcoin with up to 100x leverage and maximize your profit potential

    Trade Now on Defx

    Macro Factors Influencing Bitcoin’s Price Action

    The current market uncertainty is largely attributed to:

    • Trump’s new tariff policies affecting global markets
    • Declining trading volumes across major exchanges
    • Technical rejection at descending resistance
    • Growing institutional uncertainty

    Expert Analysis and Price Targets

    According to crypto analyst Carl Runefelt, the failure to break above descending resistance, combined with declining volume, suggests further downside potential. The $78,600 level remains a crucial target if current support fails to hold.

    FAQ Section

    Q: What is the next major support level for Bitcoin?
    A: The immediate critical support lies at $81,000, with $78,600 being the next major support level if current levels fail.

    Q: How are Trump’s tariffs affecting Bitcoin?
    A: The tariffs have increased market uncertainty and risk-off sentiment, leading to increased selling pressure across crypto assets.

    Q: What would signal a potential recovery?
    A: A decisive break above $86,000 with increasing volume would signal potential recovery momentum.
  • XRP Price Holds $2.05: Key Technical Signals Point to Reversal

    XRP Price Holds $2.05: Key Technical Signals Point to Reversal

    Key Takeaways:

    • XRP currently trading at $2.05 with $119B market cap
    • 24-hour trading volume reaches $6.51B with range of $1.97-$2.19
    • Price sitting 40.2% below all-time high with potential reversal signals emerging

    XRP’s price action has captured market attention as the digital asset maintains support at $2.05, a critical level that could determine its short-term trajectory. This price point coincides with recent developments in the broader Ripple ecosystem, including the successful growth of RLUSD integration which recently hit $250M in market cap.

    Market Position and Technical Analysis

    The cryptocurrency is currently showing resilience at the $2.05 support level, with a substantial market capitalization of $119 billion. This valuation marks the lowest point since March 10, 2025, and December 30, 2024, suggesting a potential bottom formation.

    Trading activity remains robust with a 24-hour volume of $6.51 billion, indicating strong market participation. The intraday trading range of $1.97 to $2.19 demonstrates significant volatility, with bulls defending the lower support levels.

    Technical Indicators and Momentum

    Price action on the 1-hour chart reveals several key technical developments:

    • RSI showing potential bullish divergence
    • MACD histogram beginning to flatten
    • Volume profile supporting current support level

    SPONSORED

    Trade XRP with up to 100x leverage and maximize your profit potential

    Trade Now on Defx

    Market Sentiment and Outlook

    The current price represents a 40.2% decline from XRP’s all-time high, potentially offering an attractive entry point for investors looking to accumulate. The convergence of technical indicators suggests a possible trend reversal, though traders should maintain strict risk management given market volatility.

    FAQ

    Q: What are the key support levels for XRP?
    A: The immediate support lies at $1.97, with stronger support at $1.85.

    Q: Could XRP recover to its all-time high?
    A: While possible, it would require a 67% rally from current levels and significant market momentum.

    Q: What factors could trigger a reversal?
    A: Increased institutional adoption, positive regulatory news, and broader crypto market recovery could catalyze upward movement.

  • SUI Price Forms Bullish Pattern as $2.52 Breakout Level Nears

    SUI Price Forms Bullish Pattern as $2.52 Breakout Level Nears

    SUI has entered a critical consolidation phase, currently down 56% from January’s all-time high as broader crypto market uncertainty continues to weigh on altcoin prices. The recent downturn comes amid heightened macroeconomic tensions, with Trump’s new tariff announcements sending shockwaves through global markets.

    Technical Analysis Shows Potential Reversal Pattern

    Despite the bearish market sentiment, prominent crypto analyst Ali Martinez has identified a potentially bullish technical setup on SUI’s short-term chart. The formation of an inverse head and shoulders pattern – a classic reversal indicator – suggests that SUI could be preparing for an upward move if key resistance levels are breached.

    The pattern’s neckline sits at $2.52, representing the critical breakout level that bulls need to overcome. A decisive close above this resistance could trigger renewed buying interest and open the path toward higher price targets.

    SPONSORED

    Trade SUI with up to 100x leverage on perpetual contracts

    Trade Now on Defx

    Key Price Levels to Watch

    SUI is currently trading at $2.30, with several important technical levels in focus:

    • Immediate resistance: $2.52 (inverse H&S neckline)
    • Major resistance: $2.85 (200-day EMA)
    • Key support: $2.20
    • Critical support: $2.00

    Market Outlook and Trading Implications

    While the inverse head and shoulders pattern provides a glimmer of hope for bulls, the broader market context remains challenging. The recent surge in Bitcoin dominance to 64% has put additional pressure on altcoins like SUI.

    FAQ Section

    Q: What is the significance of the $2.52 level?
    A: This price point represents the neckline of the inverse head and shoulders pattern and its breach could trigger a technical breakout.

    Q: What are the key risk factors for SUI?
    A: Major risks include continued market volatility, rising Bitcoin dominance, and broader macroeconomic uncertainties.

    Q: What’s the potential upside if the pattern confirms?
    A: A successful breakout above $2.52 could target the 200-day EMA at $2.85, with further resistance at $3.00.

    Conclusion

    While SUI shows promising technical formation, traders should remain cautious given the current market environment. The success of any potential recovery largely depends on broader market conditions and the ability of bulls to overcome key resistance levels.

  • Bitcoin Price Crashes 8% as Trump Tariffs Spark Global Market Fear

    Bitcoin Price Crashes 8% as Trump Tariffs Spark Global Market Fear

    Bitcoin (BTC) experienced a dramatic 8% price plunge on Wednesday, falling from $88,000 to $81,000 following former President Donald Trump’s announcement of sweeping new tariffs targeting more than 100 countries. This market reaction highlights crypto’s increasing correlation with global macro events and traditional financial markets.

    As market volatility continues to escalate, traders and investors are closely monitoring key support levels and potential further downside risks.

    Key Takeaways:

    • Bitcoin dropped from $88K to $81K within hours of Trump’s tariff announcement
    • Trading volume surged 156% during the selloff
    • Key support level at $80K being tested
    • Market fear index reaches highest level since January 2025

    Market Impact Analysis

    The sudden price movement has triggered a cascade of liquidations across major exchanges, with over $500 million in long positions being cleared within the first hour of the announcement. Technical indicators suggest the $80,000 level represents crucial support, with the 50-day moving average converging at this price point.

    SPONSORED

    Navigate market volatility with up to 100x leverage on perpetual contracts

    Trade Now on Defx

    Expert Analysis

    Market analysts suggest this correction could present a buying opportunity for long-term investors. According to recent data, institutional investors are actively accumulating during this dip, indicating strong fundamental support despite short-term volatility.

    Looking Ahead

    Traders should watch for these key levels and events:

    • Primary support: $80,000
    • Secondary support: $78,500
    • Key resistance: $85,000
    • Volume profile and order book depth suggest strong buying interest below $80K

    FAQ Section

    How long could this market downturn last?

    Historical data suggests similar macro-driven corrections typically resolve within 2-3 weeks.

    What are the implications for other cryptocurrencies?

    Altcoins have experienced even sharper declines, with most major tokens down 10-15%.

    How might this affect Bitcoin’s long-term trajectory?

    Most analysts maintain bullish long-term price targets, viewing this as a temporary correction in a broader uptrend.

    Time to Read: 4 minutes

  • Bitcoin Price Crashes 7% as Trump’s Tariff Shock Rattles Markets

    Bitcoin Price Crashes 7% as Trump’s Tariff Shock Rattles Markets

    Bitcoin’s price experienced a dramatic 7.2% plunge on Wednesday, dropping from $88,526 to $82,150 in just four hours after former President Trump announced sweeping reciprocal tariffs. This market shock, which follows the pattern of recent tariff-related volatility, represents one of the most significant intraday drops for BTC in 2025.

    Understanding the Tariff Impact on Crypto Markets

    The announcement, made during Trump’s “Make America Wealthy Again Event,” outlined plans to implement reciprocal tariffs on 185 countries simultaneously. This unprecedented move sent shockwaves through global markets, with the S&P 500 futures market losing $2 trillion in market capitalization within minutes.

    SPONSORED

    Trade Bitcoin with up to 100x leverage and maximize your profit potential

    Trade Now on Defx

    Market Analysis and Expert Insights

    JPMorgan analysts project the tariffs could raise approximately $400 billion in revenue, equivalent to 1.3% of GDP. This could potentially trigger a recession, especially when combined with the anticipated 1-1.5% increase in PCE prices.

    As recent technical analysis suggests, Bitcoin’s price action may face additional pressure as the tariff situation develops, potentially testing key support levels.

    Economic Implications and Recovery Prospects

    Despite the initial shock, Bitcoin showed signs of resilience, recovering to $83,207 at press time. However, experts warn that continued market uncertainty could lead to increased volatility in the coming weeks.

    FAQ Section

    • How long will the tariff impact last? Analysts expect market volatility to continue for several weeks as global markets adjust to the new tariff regime.
    • Will Bitcoin recover from this drop? While short-term pressure remains, institutional buying activity suggests strong support at current levels.
    • How does this affect crypto trading strategy? Risk management becomes crucial during periods of heightened volatility, with experts recommending reduced leverage and wider stop-losses.
  • Ethereum Price Set for Major Rally Against XRP, Analysts Project $4,800 Target

    Ethereum Price Set for Major Rally Against XRP, Analysts Project $4,800 Target

    Ethereum (ETH) appears poised for a significant price surge against XRP, with multiple analysts projecting strong upside potential for the second-largest cryptocurrency. Recent analysis warning of an ETH drop to $1,400 may need revision as new technical indicators emerge showing bullish momentum.

    Key Technical Analysis Points to ETH Dominance

    CredibullCrypto, a respected market analyst, has identified several compelling reasons why Ethereum is likely to outperform XRP in the coming months:

    • The XRP/ETH trading pair shows clear bearish divergence after a 250% rally
    • Strong support established in ETH’s high-timeframe demand zone
    • Technical indicators suggest XRP may retrace to $1.60-$1.80 range
    • ETH positioned for potential breakout above key resistance levels

    SPONSORED

    Trade Ethereum with up to 100x leverage on perpetual contracts

    Trade Now on Defx

    Price Targets and Support Levels

    Multiple analysts have weighed in with specific price predictions for Ethereum:

    • Immediate resistance zone: $3,600-$4,000
    • Potential breakout target: $4,400-$4,800
    • Critical support levels: $1,800 and $1,200
    • XRP/ETH pair expected to find support at 0.00087-0.00088

    Market Implications and Trading Opportunities

    The current market structure presents several key opportunities for traders:

    1. Potential accumulation zone between $1,800-$2,000
    2. Clear resistance levels for setting take-profit targets
    3. Multiple entry points during expected XRP correction
    4. Long-term upside potential remains intact

    Frequently Asked Questions

    Why is Ethereum expected to outperform XRP?

    Technical indicators show XRP is due for a correction after its recent rally, while Ethereum maintains strong support levels and shows signs of accumulation.

    What are the key price levels to watch?

    Traders should monitor the $1,800 support level and $3,600-$4,000 resistance zone for potential breakout opportunities.

    When could the predicted rally begin?

    Analysts suggest the movement could initiate once XRP completes its correction to the $1.60-$1.80 range, potentially within the next few weeks.

  • Bitcoin Rally Imminent: Fidelity Analyst Predicts Major Price Surge

    Key Takeaways:

    • Fidelity’s research analyst identifies Bitcoin in acceleration phase
    • Dramatic price rally expected as market enters euphoric period
    • Analysis aligns with institutional adoption trends

    Fidelity Digital Assets, one of Wall Street’s most prominent crypto players, has released a bullish analysis suggesting Bitcoin is poised for a significant price surge. Following their recent integration of Bitcoin into retirement plans, the firm’s latest market assessment indicates even more upside potential for the leading cryptocurrency.

    Research Analyst Zack Wainwright from Fidelity Digital Assets has identified that Bitcoin remains in what he terms an ‘acceleration phase’ – a period characterized by heightened volatility and euphoric market sentiment. This phase typically precedes dramatic price appreciation, according to historical patterns.

    Understanding the Acceleration Phase

    The acceleration phase represents a crucial market cycle where institutional and retail interest converge, often leading to exponential price growth. Key characteristics include:

    • Increased institutional adoption
    • Higher trading volumes
    • Enhanced market liquidity
    • Growing mainstream acceptance

    SPONSORED

    Maximize your Bitcoin trading potential with professional-grade tools

    Trade Now on Defx

    Market Implications and Price Discovery

    The potential for Bitcoin to enter price discovery mode suggests we could see unprecedented valuations. This analysis comes at a time when corporate Bitcoin purchases have reached record levels, despite recent market volatility.

    FAQ Section

    Q: What is the acceleration phase in Bitcoin markets?
    A: It’s a period of increased volatility and euphoric sentiment that typically precedes major price rallies.

    Q: How does this align with previous Bitcoin cycles?
    A: Historical data shows acceleration phases often lead to new all-time highs and extended bull runs.

    Q: What role do institutions play in this phase?
    A: Institutional involvement typically increases during acceleration phases, providing additional market liquidity and price support.

  • XRP Price Targets $3.50: Technical Analysis Reveals Bullish Reversal Pattern

    XRP shows strong signs of a bullish reversal, with technical analysis pointing to a potential surge toward $3.50 and beyond. This comprehensive analysis examines the key indicators and price targets that could define XRP’s next major move.

    Key Technical Indicators Signal XRP Bullish Reversal

    According to respected crypto analyst ‘Setupsfx’ on TradingView, XRP has entered a decisive bullish reversal phase after recent consolidation. The analysis comes as Ripple continues to expand its ecosystem, strengthening the fundamental outlook for XRP.

    Current price action at $2.09 suggests significant upside potential, with multiple technical factors aligning:

    • Formation of a three-point trendline rejection
    • Strong accumulation phase indicators
    • Positive momentum in liquidity and IMB zones
    • Bullish low wick formations indicating buyer control

    Short-term and Long-term Price Targets

    The analysis outlines two distinct price targets for XRP traders:

    • Short-term target: $3.50 (68% potential upside)
    • Long-term target: $4.00+ (92% potential upside)

    SPONSORED

    Trade XRP with up to 100x leverage on perpetual contracts

    Trade Now on Defx

    Strategic Entry Points and Risk Management

    For traders looking to capitalize on this potential move, the analysis provides clear entry and exit points:

    • Optimal entry point: $1.80
    • Stop loss level: $1.20
    • First take profit target: $3.50
    • Extended target: $4.00+

    FAQ: XRP Price Reversal Analysis

    Q: What technical indicators support the bullish reversal?
    A: Key indicators include the three-point trendline rejection, accumulation phase patterns, and strong buying pressure in liquidity zones.

    Q: What is the timeframe for the projected price targets?
    A: The $3.50 target is expected in the short term (1-3 months), while the $4.00+ target is a longer-term projection (3-6 months).

    Q: What are the main risks to this bullish scenario?
    A: Key risks include broader market volatility, regulatory developments, and potential resistance at previous high levels around $3.84.

    Conclusion: XRP’s Path to New Highs

    While the analysis maintains a neutral stance acknowledging market uncertainties, the technical setup strongly suggests XRP is positioned for significant upside potential. Traders should monitor key support and resistance levels while maintaining proper risk management strategies.

  • Bitcoin Price Drops Below $85K as Trump’s Tariff Plans Shake Markets

    Bitcoin’s price experienced downward pressure today as former President Donald Trump’s plans for global ‘reciprocal’ tariffs continue to rattle financial markets. This follows recent market uncertainty surrounding what Trump has dubbed ‘Liberation Day.’

    Market Impact of Trump’s Tariff Announcement

    The cryptocurrency market showed immediate reaction to Trump’s aggressive stance on international trade policy, with Bitcoin serving as a barometer for broader market sentiment. The leading cryptocurrency’s price movement reflects growing concerns about potential economic implications of widespread tariff implementation.

    SPONSORED

    Trade Bitcoin with up to 100x leverage and maximize your profit potential

    Trade Now on Defx

    Global Economic Implications

    The proposed tariffs could have far-reaching consequences for international trade relations and global markets. Market volatility has increased as investors assess the potential impact on various sectors and asset classes.

    Expert Analysis

    Market analysts suggest that while Bitcoin has traditionally served as a hedge against economic uncertainty, the immediate reaction to trade policy changes demonstrates the asset’s increasing correlation with traditional markets during periods of significant policy shifts.

    FAQ Section

    How will Trump’s tariffs affect Bitcoin price?

    The immediate impact appears negative, but long-term implications remain uncertain as markets digest the policy implications.

    What is ‘Liberation Day’?

    It’s Trump’s self-imposed deadline for implementing his proposed global reciprocal tariff policy.

    Could Bitcoin benefit from economic uncertainty?

    Historically, Bitcoin has shown potential as a safe-haven asset during economic uncertainty, though current market conditions show increased correlation with traditional markets.

  • Dogecoin Price Surge: AI Predicts 229% Rally to $0.57 by April 28

    A sophisticated machine learning algorithm from CoinCodex has predicted a massive 229.55% surge in Dogecoin (DOGE) price, targeting $0.57 by April 28, 2025. This bullish forecast comes at a crucial time for the leading meme cryptocurrency, which has recently shown signs of bottoming out after a challenging first quarter.

    As recent technical analysis has confirmed a bullish reversal signal with RSI hitting oversold territory, this AI-powered prediction adds another layer of optimism to DOGE’s potential recovery.

    Key Highlights of the AI Price Prediction

    • Target Price: $0.57
    • Potential Gain: 229.55%
    • Timeline: By April 28, 2025
    • Current Price: $0.17

    SPONSORED

    Trade DOGE with up to 100x leverage on perpetual contracts

    Trade Now on Defx

    Technical Analysis Supports Bullish Outlook

    Multiple technical indicators align with the AI prediction:

    • TD Sequential: Buy signal on weekly chart
    • Price Channel: Trading at lower boundary, suggesting potential reversal
    • Higher Lows Pattern: Consistent formation indicating accumulation phase

    Expert Price Predictions

    Several prominent analysts have shared similar bullish outlooks:

    • Javon Marks: Projects 270% rally to $0.65
    • Master Kenobi: Predicts $1 by June 2025
    • Trader Tardigrade: Forecasts new ATH at $3.7
    • Ali Martinez: Technical analysis suggests $4 target

    Market Context and Historical Performance

    Despite recording its worst Q1 performance in seven years with a 47% loss, DOGE appears positioned for a strong recovery. The current market structure mirrors the 2017 bull run pattern, suggesting a potential second phase of the current bull market.

    FAQ Section

    What is driving the potential Dogecoin price surge?

    Technical indicators, historical patterns, and machine learning predictions suggest a combination of oversold conditions and market cycle timing.

    When could Dogecoin reach $1?

    According to analyst Master Kenobi, DOGE could reach $1 by June 2025, following similar patterns to the 2017 bull run.

    Is now a good time to invest in Dogecoin?

    Multiple technical indicators suggest DOGE is at a potential bottom, but investors should conduct their own research and consider their risk tolerance.

    Current market data shows DOGE trading at $0.17, with a 1% increase in the last 24 hours. While short-term sentiment remains cautious, the confluence of technical indicators and AI predictions suggests significant upside potential for the leading meme cryptocurrency.