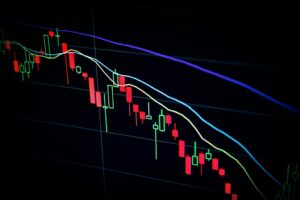
Tag: Crypto Trading

  • Polymarket Prediction Market Shows 3% Odds for Jesus’ Return in 2025

    In a unique intersection of blockchain technology and religious prophecy, Polymarket, known for its 90% prediction accuracy rate, is hosting an unusual betting market that’s drawing significant attention from crypto traders and speculators alike.

    Key Highlights of the Divine Prediction Market

    • Trading volume has reached $44,760
    • Current odds stand at 3% for Jesus’ return in 2025
    • Market demonstrates growing diversity in blockchain prediction platforms

    Understanding Polymarket’s Religious Speculation Market

    The blockchain-based prediction platform has created a unique market that merges theological speculation with crypto trading. This unprecedented wager represents a fascinating example of how decentralized prediction markets are expanding beyond traditional financial and political forecasting.

    SPONSORED

    Trade with confidence using advanced prediction markets on Solana

    Trade Now on Defx

    Market Impact and Trading Analysis

    The significant trading volume of $44,760 indicates substantial interest in this unconventional market. While the 3% odds might seem low, they represent a noteworthy level of confidence given the nature of the prediction.

    Implications for Blockchain Prediction Markets

    This unique market demonstrates the versatility of blockchain-based prediction platforms and their ability to accommodate diverse types of speculative trading. It showcases how crypto platforms are pushing boundaries in terms of what can be traded and predicted.

    FAQ Section

    How does Polymarket’s prediction market work?

    Polymarket uses blockchain technology to create transparent, decentralized markets where users can bet on various outcomes using cryptocurrency.

    What happens to the bets if the prediction timeframe passes?

    If the predicted event doesn’t occur by the specified date, the market resolves in favor of ‘No’ positions, and those holders receive their winnings.

    Are religious prediction markets common on blockchain platforms?

    While unusual, religious-themed markets represent a growing category in decentralized prediction platforms, showcasing the expanding scope of blockchain applications.

  • Crypto Whale’s $16M Trading Profits Linked to Criminal Past: ZachXBT Investigation

    Crypto Whale’s $16M Trading Profits Linked to Criminal Past: ZachXBT Investigation

    Crypto Whale’s $16M Trading Profits Linked to Criminal Past: ZachXBT Investigation

    In a stunning revelation that shakes the crypto trading world, renowned blockchain investigator ZachXBT has uncovered that a mysterious trader who recently made $16 million through leveraged positions is actually William Parker, a convicted fraudster with a history of casino-related crimes.

    This development comes amid increased scrutiny of whale trading activity in the crypto markets, where large-scale traders continue to influence market movements.

    The $16M Trading Spree: Breaking Down the Profits

    • $6.8 million profit from a long position before Trump’s crypto reserve announcement
    • $9 million gained from shorting BTC during the subsequent price reversal
    • All positions utilized 50x leverage, demonstrating extremely high-risk trading strategy

    SPONSORED

    Experience professional-grade leverage trading with advanced risk management tools

    Trade Now on Defx

    The Investigation Trail: How ZachXBT Connected the Dots

    The investigation revealed multiple red flags:

    • Wallet connection to phishing operations, receiving $17.1K in drainer fees
    • Frequent interactions with crypto gambling platforms
    • Suspicious Solana wallet activity linked to casino exploits
    • Telegram account verification connecting trading activities
    • HyperLiquid exchange payment leading to personal identification

    Criminal History Unveiled

    William Parker’s criminal record includes:

    • 2023: 2.5-year sentence in Finland for $1 million casino theft
    • 2010: UK imprisonment for fraud, hacking, and gambling-related charges

    Market Impact and Security Implications

    This revelation raises serious concerns about market manipulation and the need for enhanced security measures in crypto trading platforms. The case highlights how sophisticated criminals can exploit leverage trading for significant profits while potentially endangering market stability.

    FAQ Section

    How did the trader make such large profits?

    The trader used 50x leverage on strategic positions, timing them with major market events like Trump’s crypto reserve announcement.

    What red flags should traders watch for?

    Look for unusual wallet interactions, connections to gambling platforms, and suspicious transaction patterns on exchanges.

    How can platforms better protect against such actors?

    Enhanced KYC procedures, better wallet monitoring, and improved cross-platform communication can help identify suspicious activities earlier.

    This case serves as a crucial reminder of the importance of due diligence and proper security measures in crypto trading, especially when dealing with high-leverage positions and large-scale market movements.

  • XRP Network Activity Hits 11-Month High: Price Eyes $3 Breakout

    XRP Network Activity Hits 11-Month High: Price Eyes $3 Breakout

    XRP’s network metrics are flashing major bullish signals as active addresses surge to levels not seen since April 2023, potentially setting the stage for significant price action. The cryptocurrency has demonstrated remarkable resilience amid broader market turbulence, maintaining crucial support levels while its network activity suggests growing adoption.

    According to recent Glassnode data, XRP has recorded nearly 627,000 active addresses – marking an 11-month high that coincides with growing institutional interest in XRP products. This surge in network participation comes at a critical time as the token trades above key support levels despite market-wide selling pressure.

    SPONSORED

    Trade XRP with up to 100x leverage on perpetual contracts

    Trade Now on Defx

    Network Fundamentals Signal Growing Adoption

    The spike in active addresses represents a significant milestone for XRP, suggesting increased user engagement and potential accumulation. Historical data shows that such network activity often precedes major price movements, as it indicates genuine user adoption rather than speculative trading.

    This surge in network activity aligns with recent technical analysis projecting significant upside potential for XRP. The token currently trades at $2.41, having bounced strongly from recent lows of $1.89 – a 33% recovery that demonstrates robust buyer interest.

    Technical Analysis: Key Support and Resistance Levels

    XRP’s price structure shows several critical levels that traders should monitor:

    • Current Support: $2.30
    • Major Resistance: $3.00
    • Secondary Support: $2.00
    • Previous Low: $1.89

    Market Outlook and Price Projections

    The combination of strong network metrics and technical support levels suggests XRP could be positioning for a significant move higher. The $3.00 level represents the next major psychological and technical resistance, with a breakthrough potentially opening the path to new highs.

    FAQ Section

    What does the surge in active addresses mean for XRP?

    Increased active addresses typically indicate growing network adoption and usage, which often correlates with positive price action.

    What are the key price levels to watch?

    The critical support level is $2.30, while $3.00 represents the next major resistance target.

    How does XRP’s performance compare to other cryptocurrencies?

    XRP has shown superior resilience compared to many altcoins, maintaining stronger support levels during recent market volatility.

  • Polymarket Achieves 90% Prediction Accuracy: Research Reveals Web3 Oracle Power

    Polymarket Achieves 90% Prediction Accuracy: Research Reveals Web3 Oracle Power

    Polymarket Achieves 90% Prediction Accuracy: Research Reveals Web3 Oracle Power

    New research reveals that Polymarket, the leading blockchain-based prediction market platform, demonstrates an impressive 90% accuracy rate in forecasting world events, establishing itself as a powerful Web3 oracle for global predictions.

    SPONSORED

    Trade with confidence using advanced analytics and real-time market data

    Trade Now on Defx

    Key Research Findings on Polymarket’s Prediction Accuracy

    According to comprehensive analysis by New York City-based data scientist Alex McCullough, Polymarket has emerged as a highly reliable predictor of future events. The research, conducted through a detailed Dune dashboard analysis, reveals several crucial insights:

    • 90% accuracy rate in general event predictions
    • Consistent performance across various market categories
    • $4.5 billion in collective volume on sports markets alone
    • Higher accuracy in longer-term market predictions

    Methodology and Data Analysis

    McCullough’s research methodology was carefully structured to ensure accurate results:

    • Removed markets with extreme probabilities (>90% or <10%)
    • Filtered out already-known outcomes pending settlement
    • Analyzed historical data across multiple market categories
    • Evaluated both short-term and long-term prediction accuracy

    Market Performance by Category

    Market Type Accuracy Rate Trading Volume
    Sports Events High $4.5B
    Political Events 90% $54M+
    Long-term Predictions Very High Varied

    Implications for Crypto Markets and Trading

    The high accuracy rate of Polymarket’s predictions has significant implications for crypto traders and investors. The platform’s ability to forecast events with 90% accuracy makes it a valuable tool for:

    • Market sentiment analysis
    • Trading strategy development
    • Risk assessment
    • Portfolio management

    Frequently Asked Questions

    How accurate is Polymarket in predicting crypto events?

    Research shows Polymarket maintains a 90% accuracy rate across various event categories, including crypto-related predictions.

    What factors influence Polymarket’s prediction accuracy?

    Key factors include market liquidity, participant behavior, time horizon, and event complexity.

    How can traders use Polymarket’s predictions?

    Traders can utilize Polymarket’s predictions as part of their research and analysis toolkit for making informed trading decisions.

    Conclusion

    Polymarket’s demonstrated 90% accuracy rate in predicting world events represents a significant milestone in the evolution of blockchain-based prediction markets. This accuracy level, combined with substantial trading volumes and diverse market categories, positions Polymarket as a valuable tool for traders, investors, and analysts in the crypto ecosystem.

  • XRP Price Target Hits $38: Technical Analysis Reveals Massive Rally Potential

    XRP Price Target Hits $38: Technical Analysis Reveals Massive Rally Potential

    The cryptocurrency market is witnessing a significant development as XRP shows strong bullish momentum, with a respected analyst projecting an ambitious price target of $38. This analysis comes at a crucial time, following recent whale accumulation of $2.5B in XRP and the SEC’s decision to drop their appeal.

    Technical Analysis Points to Major XRP Breakout

    Crypto analyst Gert van Lagen has presented compelling technical evidence supporting a potential surge to $38 for XRP. The analysis is based on two powerful bullish patterns:

    • A 7-year Double Bottom formation (2014-2020)
    • An emerging Ascending Triangle pattern

    This forecast aligns with Ripple’s strategic reserve plans, though it presents a significantly more bullish outlook.

    SPONSORED

    Trade XRP with up to 100x leverage on perpetual contracts

    Trade Now on Defx

    Key Technical Indicators Supporting the Rally

    The Double Bottom pattern, spanning from 2014 to 2020, previously triggered two significant price movements:

    • Initial breakout to $0.28 (Wave 1)
    • Secondary surge to $2.5 (Wave 2)

    The current Ascending Triangle formation suggests a continuation of this bullish trend, with potential for exponential growth.

    Market Sentiment and Regulatory Environment

    The bullish outlook is further supported by:

    • Resolution of SEC legal challenges
    • Increased institutional interest
    • Growing market liquidity

    FAQ: XRP Price Projection

    Why is $38 considered a conservative target?

    Historical data shows XRP’s previous rallies exceeded parabolic targets by 2x, suggesting potential for even higher prices.

    What are the key resistance levels to watch?

    Primary resistance stands at $3 (previous ATH), followed by psychological levels at $5, $10, and $20.

    How does the SEC case resolution impact price potential?

    The regulatory clarity removes a major barrier to institutional adoption and market growth.

    As the crypto market continues to evolve, XRP’s position as a major altcoin, combined with strong technical indicators and positive market sentiment, creates a compelling case for significant price appreciation. Investors should maintain proper risk management while monitoring these developing patterns.

  • FET Price Surges After $0.452 Support: Key Levels to Watch

    FET Price Surges After $0.452 Support: Key Levels to Watch

    Fetch.AI (FET) is demonstrating remarkable strength as the token stages a significant recovery from its crucial $0.452 support level. This technical analysis examines the key factors driving FET’s price action and potential targets ahead.

    FET Price Action Analysis: Support Holds Strong

    The $0.452 level has emerged as a pivotal support zone for FET, successfully halting the recent downward pressure and catalyzing a notable rebound. This price point’s significance is amplified by the substantial buying volume that materialized, indicating strong institutional and retail interest at these levels.

    Technical indicators paint an increasingly bullish picture for FET:

    • The 4-hour Simple Moving Average (SMA) is on the verge of a bullish crossover
    • Trading volume has seen a significant uptick, confirming buyer conviction
    • Price action is forming a clear upward channel pattern

    SPONSORED

    Trade FET with up to 100x leverage on perpetual contracts

    Trade Now on Defx

    Key Price Targets and Resistance Levels

    As FET continues its upward trajectory, several critical price levels demand attention:

    Price Level Significance
    $0.80 Primary resistance target
    $1.09 Major psychological resistance
    $0.452 Current support level

    Risk Factors and Market Considerations

    While the current momentum appears strong, traders should consider several risk factors:

    • Broader market volatility could impact FET’s recovery
    • Resistance at $0.80 may trigger profit-taking
    • Technical indicators suggest potential short-term overbought conditions

    Frequently Asked Questions

    What caused FET’s recent price rebound?

    The strong support at $0.452 combined with increased buying pressure and positive technical indicators contributed to FET’s recovery.

    What are the key resistance levels for FET?

    The primary resistance levels are $0.80 and $1.09, with the former acting as an immediate target for bulls.

    Is FET’s current rally sustainable?

    The increased trading volume and technical indicators suggest potential for sustained upward movement, though market conditions remain volatile.

    Time to read: 4 minutes

  • Solana Futures ETFs Launch: SOL Price Eyes $166 Target Amid Fed News

    Solana Futures ETFs Launch: SOL Price Eyes $166 Target Amid Fed News

    In a groundbreaking development for the Solana ecosystem, Florida-based Volatility Shares LLC is launching two pioneering exchange-traded funds (ETFs) tied to Solana futures, marking a significant milestone in crypto’s integration with traditional finance.

    The launch comes at a critical time for Solana (SOL), as technical indicators show strong support levels amid broader market developments. The new ETF products include a standard Solana futures ETF and the Volatility Shares 2X Solana ETF (ticker: SOLT), offering leveraged exposure for aggressive traders.

    Market Impact and Trading Volume Analysis

    Initial trading data reveals modest activity, with Solana futures generating approximately $12.3 million in daily nominal volume. While this figure appears conservative compared to Bitcoin and Ethereum futures launches, analysts at K33 Research note that the volume aligns proportionally with Solana’s market capitalization.

    The timing of these ETF launches coincides with significant macro developments. The Federal Reserve’s recent policy shift regarding quantitative tightening has created a potentially bullish environment for crypto assets, with the monthly bond runoff reduction from $25 billion to $5 billion scheduled for April.

    SPONSORED

    Trade Solana with up to 100x leverage on perpetual contracts

    Trade Now on Defx

    Technical Analysis and Price Targets

    SOL currently trades at $131.6, having recovered 6% in the last 24 hours. Key technical levels include:

    • Immediate resistance: $133 (0.5 Fibonacci retracement)
    • Critical EMA confluence: $133.65 (100-day EMA)
    • Next target: $166.7 (0.618 Fibonacci retracement)
    • Long-term resistance: $296 (January ATH)

    Market Outlook and Trading Implications

    The introduction of these ETF products could significantly impact Solana’s market dynamics, potentially attracting institutional capital and enhancing market depth. Traders should monitor the $133-134 range as a crucial breakout zone that could trigger momentum toward higher targets.

    FAQ Section

    Q: When do the Solana Futures ETFs begin trading?
    A: Trading begins today, with both standard and leveraged (2x) options available.

    Q: What is the ticker symbol for the leveraged Solana ETF?
    A: The Volatility Shares 2X Solana ETF trades under the ticker SOLT.

    Q: How does this compare to existing crypto ETFs?
    A: This marks the first time traditional finance investors have ETF access to all five largest cryptocurrencies by market cap.

  • Dogecoin-Inspired Meme Coin Surges 150% After Elon Musk Tweet

    Key Takeaways:

    • Ethereum-based meme coin Kekius Maximus sees dramatic price surge following Elon Musk’s social media post
    • The token’s rally demonstrates continuing influence of social media on crypto markets
    • Market movement follows broader trend of meme coin volatility in 2025

    Ethereum-based meme coin Kekius Maximus experienced a significant price surge after Tesla CEO and noted Dogecoin advocate Elon Musk shared a doctored photo featuring the project’s frog mascot on X (formerly Twitter). This movement aligns with recent increased whale activity in Dogecoin, suggesting renewed interest in the meme coin sector.

    The market reaction highlights the ongoing influence of social media personalities on cryptocurrency valuations, particularly in the meme coin segment. Musk’s post, which featured a modified image incorporating the Kekius Maximus frog character, triggered immediate buying pressure across major exchanges.

    SPONSORED

    Trade meme coins with up to 100x leverage and maximize your potential returns

    Trade Now on Defx

    Market Impact Analysis

    As industry experts warn about the sustainability of meme coins, this latest price action demonstrates the persistent impact of social media influencers on market dynamics. Trading volumes across major DEXs showed significant spikes within minutes of Musk’s post.

    Expert Perspectives

    Market analysts caution that while such rallies can generate substantial short-term gains, investors should approach meme coin investments with careful consideration of risk management strategies.

    FAQ Section

    • What is Kekius Maximus?
      An Ethereum-based meme coin featuring a frog mascot
    • Why did Elon Musk’s tweet affect the price?
      Musk’s significant social media following and history with Dogecoin often influences crypto market sentiment
    • Are meme coin investments sustainable?
      Industry experts suggest careful evaluation of risk factors before investing in meme coins
  • XRP Price Alert: $2.66 Level Critical for Wave 4 Breakout Target

    The XRP market stands at a crucial technical junction, with the $2.66 price level emerging as a decisive factor for the token’s next major move. Recent analysis following the SEC’s lawsuit withdrawal suggests this specific price point could determine whether XRP continues its upward trajectory or faces a corrective wave.

    Critical Price Levels for XRP’s Next Move

    According to prominent crypto analyst Egrag Crypto, XRP must maintain prices above $2.66 to avoid a potential corrective phase. The analysis indicates several key price levels that traders should monitor:

    • Primary resistance: $2.65-$2.70 range
    • Secondary confirmation level: $2.97
    • Major breakout point: $3.40 (current ATH)
    • Potential downside risk: $1.70 if support fails

    SPONSORED

    Trade XRP with up to 100x leverage on perpetual contracts

    Trade Now on Defx

    Wave Analysis and Price Projections

    Multiple analysts have weighed in on XRP’s potential trajectory. Dark Defender projects a rally to $5, outlining a specific wave pattern:

    • Wave 3: Initial surge to $4.40
    • Wave 4: Correction to $3.70
    • Wave 5: Final push to $5.60

    SEC Lawsuit Resolution Impact

    The recent resolution of the SEC lawsuit against Ripple has created a fundamentally bullish backdrop for XRP. This development coincides with broader market strength that has pushed XRP up 12% following the SEC resolution.

    FAQ Section

    What is the current XRP price?

    XRP is currently trading at $2.45, showing a 7% increase in the last 24 hours.

    What are the key resistance levels for XRP?

    The critical resistance levels are $2.66, $2.97, and $3.40 (ATH).

    What is the potential downside risk?

    If support levels fail, XRP could potentially drop to $1.70 before resuming its upward trajectory.

    Current market indicators suggest XRP is at a pivotal moment, with technical analysis pointing to significant potential movement in either direction. Traders should closely monitor the identified price levels while considering both technical and fundamental factors in their trading decisions.

  • Bitcoin Price Reversal Imminent as Fed’s QT End Nears, Shows 100% Odds

    Bitcoin Price Reversal Imminent as Fed’s QT End Nears, Shows 100% Odds

    Bitcoin (BTC) appears poised for a significant trend reversal as Polymarket data reveals 100% probability of the Federal Reserve ending quantitative tightening (QT) before May 2025. This monetary policy shift could catalyze a major recovery in crypto markets, particularly after Bitcoin’s recent 13% decline from all-time highs.

    Bitcoin’s Current Market Position

    The leading cryptocurrency has experienced substantial volatility in recent months, dropping from its peak of $109,588 on January 19 to current levels around $83,707. This correction has erased over $400 billion in market capitalization, leaving Bitcoin trapped at key support levels while markets await the Fed’s next move.

    Understanding the Fed’s QT Impact

    Quantitative tightening, implemented since June 2022, has been a significant headwind for risk assets like Bitcoin. The policy involves reducing the Fed’s balance sheet by selling government bonds or allowing them to mature without reinvestment, effectively removing liquidity from the financial system.

    SPONSORED

    Trade Bitcoin with up to 100x leverage and maximize your profit potential

    Trade Now on Defx

    Key Market Indicators

    • Inflation has cooled to 2.8%, approaching the Fed’s 2% target
    • Polymarket shows 100% probability of QT ending before May
    • Bitcoin trading volume patterns suggest accumulation at current levels
    • Institutional interest remains strong with ARK Invest adding $80M in BTC

    Expert Analysis and Market Outlook

    Benjamin Cowen, CEO of Into The Cryptoverse, projects a significant market rally following the end of QT. This aligns with recent analysis suggesting Bitcoin could target new all-time highs as monetary conditions ease.

    FAQ Section

    When exactly will the Fed end QT?

    While the exact date isn’t confirmed, Polymarket data suggests with 100% probability it will occur before April 30, 2025.

    How might Bitcoin price react to the end of QT?

    Historical data suggests risk assets typically rally when monetary conditions ease, potentially pushing Bitcoin toward new all-time highs.

    What are the key price levels to watch?

    Current support lies at $80,000, with resistance at the previous ATH of $109,588.

    As markets anticipate this crucial monetary policy shift, investors should monitor key technical levels and on-chain metrics for confirmation of the expected trend reversal. The combination of easing monetary conditions and strong institutional interest could set the stage for Bitcoin’s next major bull run.