XRP Price Target $22: Bullish Candle Pattern Signals Massive Rally
XRP's price trajectory is showing significant bullish momentum, with renowned crypto analyst Egrag Crypto identifying a powerful candle formation that...
XRP's price trajectory is showing significant bullish momentum, with renowned crypto analyst Egrag Crypto identifying a powerful candle formation that...
Bitcoin (BTC) continues to demonstrate remarkable stability near its recent all-time high of $111,980, with neutral funding rates on Binance...

Bitcoin's recent surge to $111,000 has sparked intense analysis of its sustainability, with on-chain metrics revealing a concerning gap in...
Bitcoin (BTC) continues to demonstrate resilience near its recent all-time high of $111,980, with on-chain metrics suggesting minimal selling pressure...

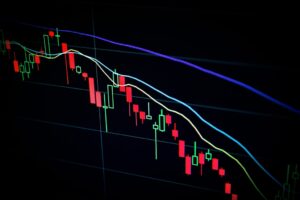
Bitcoin's price trajectory has taken a bearish turn, with BTC dropping below critical support levels and testing the $104,600 zone....

Bitcoin (BTC) is consolidating near a critical resistance level of $110,000, with on-chain data suggesting the current bull trend remains...
Dogecoin (DOGE) has entered a critical technical formation that could signal an imminent price surge, despite recent downward pressure. The...
The SUI token is showing strong technical signals for a potential breakout from its current $3.61 level, according to prominent...
Renowned biohacker Bryan Johnson has unveiled a surprising edge for Bitcoin traders - quality sleep could be the key to...
XRP continues to generate significant bullish momentum, with prominent analysts predicting a potential surge to $20 and beyond. As recent...


