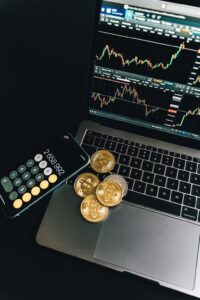
Bitcoin Price Target $1M: Kiyosaki Issues Bold 2030 Prediction
Robert Kiyosaki, renowned author of 'Rich Dad Poor Dad', has issued his most bullish Bitcoin prediction yet, calling the leading...
Robert Kiyosaki, renowned author of 'Rich Dad Poor Dad', has issued his most bullish Bitcoin prediction yet, calling the leading...
Dogecoin (DOGE) is showing signs of a potential recovery after testing critical support levels, with technical indicators suggesting a possible...
The SUI cryptocurrency is showing promising technical signals despite recent market consolidation, with a key ascending channel pattern suggesting potential...
Dogecoin (DOGE) has entered a critical consolidation phase following a steep 40% decline, with technical analysis suggesting a potential 16%...
XRP is displaying promising technical signals that could propel its price to the $4 mark, according to detailed analysis from...

XRP has emerged as a major focal point in the crypto market following the SEC's landmark decision to drop its...
The XRP market is showing signs of a major breakout, with crypto analyst Egrag Crypto predicting a potential surge to...
Toncoin (TON) has demonstrated remarkable strength in recent market action, posting a steady climb from its $2.36 support level. This...

XRP's network metrics are flashing major bullish signals as active addresses surge to levels not seen since April 2023, potentially...

The cryptocurrency market is witnessing a significant development as XRP shows strong bullish momentum, with a respected analyst projecting an...


