Tag: Cryptocurrency Analysis

  • Altcoin Golden Cross Signals Potential 2025 Alt Season Breakout

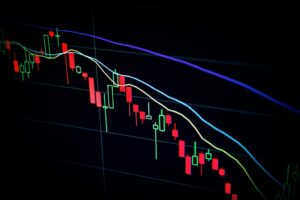
    The cryptocurrency market is witnessing a significant technical development as the altcoin market capitalization forms a golden cross pattern, potentially signaling the start of a highly anticipated altcoin season. While Bitcoin continues its dominance above $100,000, this technical indicator suggests alternative cryptocurrencies may be preparing for a substantial rally.

    Understanding the Altcoin Golden Cross Formation

    Market expert Ted Pillows has identified a crucial golden cross formation on the altcoin market cap chart, coinciding with historical data patterns that previously preceded major altcoin rallies. This technical pattern occurs when a short-term moving average crosses above a longer-term moving average, typically signaling a shift from bearish to bullish momentum.

    SPONSORED

    Trade meme coins with up to 100x leverage and maximize your alt season gains

    Trade Now on Defx

    Key Technical Indicators Supporting the Altcoin Surge

    The altcoin market has been showing remarkable resilience, maintaining positions above both the 50 and 200-day EMAs since May. This consolidation phase, combined with the golden cross, suggests accumulation before a potential breakout. On-chain analyst Joao Wedson notes that many altcoins are decoupling from Bitcoin’s price action, a phenomenon historically associated with alt season beginnings.

    Market Implications and Trading Opportunities

    With Bitcoin trading above $100,000, the altcoin market’s technical setup suggests a potential redistribution of capital from BTC to alternative cryptocurrencies. This shift could trigger significant price appreciation across the altcoin market, particularly for projects with strong fundamentals and utility.

    Frequently Asked Questions

    What is a Golden Cross in Crypto Markets?

    A golden cross occurs when a short-term moving average crosses above a long-term moving average, typically signaling the potential start of a bullish trend.

    How Long Do Altcoin Seasons Typically Last?

    Historical data shows altcoin seasons can last anywhere from 3-6 months, though market conditions in 2025 may differ from previous cycles.

    What Triggers an Altcoin Season?

    Altcoin seasons are often triggered by Bitcoin price stabilization, increased market confidence, and capital rotation from BTC to alternative cryptocurrencies.

    Investors should maintain careful risk management practices despite the bullish technical indicators, as cryptocurrency markets remain highly volatile and subject to rapid changes in sentiment.

  • Bitcoin Price Could Hit $250K in 2025, Fundstrat’s Tom Lee Predicts

    Bitcoin Price Could Hit $250K in 2025, Fundstrat’s Tom Lee Predicts

    Bitcoin (BTC) could surge to $250,000 by the end of 2025, according to Fundstrat’s head of research Tom Lee. In a recent interview that follows Bitcoin’s recent test of $110,000 levels, Lee outlined several compelling factors supporting this ambitious price target.

    Supply Squeeze: 95% of Bitcoin Already Mined

    The fundamental case for Bitcoin’s potential rally centers on an increasingly tight supply situation. Lee highlighted that approximately 19.80 million bitcoins have already been mined out of the maximum 21 million supply cap, representing 95% of all Bitcoin that will ever exist. This scarcity factor becomes even more significant when considering that only about 5% of the global population currently owns any Bitcoin.

    SPONSORED

    Trade Bitcoin with up to 100x leverage on perpetual contracts

    Trade Now on Defx

    Price Trajectory and Market Dynamics

    Despite Bitcoin’s recent dip from its all-time high of $111,970 to around $104,000, Lee maintains his bullish outlook. His forecast suggests:

    • $150,000 by December 2025
    • Potential stretch to $200,000-$250,000 with increased demand
    • 140% upside from current levels around $104,000

    Long-term Valuation Model

    Lee’s analysis extends beyond near-term predictions, suggesting Bitcoin could eventually match gold’s market capitalization of approximately $23 trillion. This would translate to:

    • Minimum $1.15 million per Bitcoin (20 million circulating supply)
    • Potential for $2-3 million per coin in bull case scenarios
    • 2,300% appreciation from current levels

    Supporting Analysis from Major Institutions

    VanEck’s research aligns with Lee’s long-term outlook, with their head of digital asset research Matthew Sigel projecting $3 million per Bitcoin by 2050. This institutional backing adds credibility to the bullish narrative, especially as major whales continue accumulating Bitcoin above $100,000 levels.

    FAQ Section

    What factors could drive Bitcoin to $250,000?

    Limited supply (95% already mined), increasing institutional adoption, and growing retail participation are key drivers.

    When could Bitcoin reach $250,000?

    Tom Lee projects this price target could be achieved by the end of 2025, with intermediate targets of $150,000 by December.

    How does this compare to other price predictions?

    VanEck’s longer-term projection of $3 million by 2050 suggests Lee’s $250,000 target might be conservative.

    Featured image: Shutterstock

  • XRP Price Alert: Key June 4-6 Window Could Signal Major Breakout

    XRP Price Alert: Key June 4-6 Window Could Signal Major Breakout

    XRP’s price action is approaching a critical juncture as the cryptocurrency attempts to break above $2.20 following recent volatility. After reaching $2.65 in May before retracing to $2.10, crypto analysts are now highlighting a specific timeframe that could determine XRP’s next major move.

    Critical Price Action Window: June 4-6

    Crypto analyst WatersAbove has identified June 4-6 as a potential bottom formation period for XRP, suggesting this window could precede significant upside movement. The analyst warns that this period may see increased market manipulation as larger players attempt to shake out weak hands before a possible rally.

    SPONSORED

    Trade XRP with up to 100x leverage on perpetual contracts

    Trade Now on Defx

    Ambitious Price Targets and Market Analysis

    The most striking aspect of WatersAbove’s analysis is the projected price target of $10 by late July or early August 2025. This ambitious prediction aligns with recent technical analysis suggesting significant upside potential for XRP, though with more conservative targets.

    Multiple Analysts Weigh In

    Supporting this bullish outlook, EGRAG CRYPTO and Dark Defender have provided additional technical analysis suggesting potential moves to the $18-23 range. However, contrasting views exist, with analyst Dr Cat suggesting any significant bull run might be delayed until November 2025.

    Current Market Position

    XRP currently trades at $2.20, showing a 1.63% increase over 24 hours. The projected $10 target would represent a 350% increase from current levels, requiring substantial institutional inflows to achieve.

    FAQ Section

    What makes June 4-6 significant for XRP?

    This period is identified as a potential bottom formation window with increased manipulation risk before a possible breakout.

    What technical indicators support the $10 price target?

    Analysts point to historical price patterns, wave count analysis, and institutional buying patterns as supporting factors.

    How does this prediction compare to previous XRP rallies?

    The projected movement would mirror XRP’s Q4 2024 rally and 2018 performance, though requiring significantly more institutional participation.

  • XRP Price Analysis: Why $8 Target Makes More Sense Than $10K

    XRP Price Analysis: Why $8 Target Makes More Sense Than $10K

    A fresh perspective on XRP’s price potential has emerged from angel investor Armando Pantoja, who argues that investors should focus on achievable returns rather than unrealistic price targets. This analysis comes as XRP approaches a critical price trigger point at $2.56.

    Realistic ROI vs. Unrealistic Price Targets

    While many XRP enthusiasts fixate on a $10,000 price target, Pantoja presents a more grounded analysis focused on return on investment (ROI). With XRP currently trading at $2.30, reaching $8 would deliver similar percentage gains as Bitcoin hitting $300,000 from current levels – but with a more achievable market cap requirement.

    SPONSORED

    Trade XRP with up to 100x leverage on perpetual contracts

    Trade Now on Defx

    Comparative Market Performance

    The data shows XRP has outperformed Bitcoin in percentage terms over the past year, with XRP gaining over 300% compared to Bitcoin’s 50% increase. This performance comes despite Bitcoin recently reaching new all-time highs near $112,000.

    XRP’s Technical Advantages

    Beyond price action, XRP’s network capabilities continue to demonstrate significant advantages:

    • Transaction speed: 1,500 TPS
    • Settlement time: 3-5 seconds
    • Transaction cost: Fraction of a cent
    • Network capacity: Handles cross-border payments efficiently

    Risk Factors and Market Outlook

    Despite positive technical indicators, investors should consider several risk factors:

    • Ongoing SEC legal proceedings
    • Market correlation with Bitcoin movements
    • Institutional adoption pace
    • Regulatory uncertainty in key markets

    FAQ Section

    What makes $8 a realistic target for XRP?

    The $8 target represents a market cap that’s achievable given XRP’s current position and utility in cross-border payments, unlike the $10,000 target which would require an unrealistic market cap.

    How does XRP’s ROI compare to Bitcoin?

    XRP has shown stronger percentage gains over the past year, with 300% growth compared to Bitcoin’s 50%, suggesting potential for continued outperformance.

    What are the main catalysts for XRP price growth?

    Key catalysts include institutional adoption, resolution of legal challenges, and expansion of cross-border payment partnerships.

  • XRP Price Delays $3 Target: November Bull Run More Likely, Says Analyst

    XRP Price Delays $3 Target: November Bull Run More Likely, Says Analyst

    Leading crypto analyst Dr Cat has delivered a sobering assessment for XRP bulls, suggesting the much-anticipated $3 price target may have to wait until November 2025. The analysis comes as XRP consolidates around $2.17, showing signs of weakening momentum on key technical indicators.

    Technical Analysis Points to Extended Consolidation

    According to Dr Cat’s detailed Ichimoku analysis, XRP’s daily chart has entered a period of suspended animation just when decisive bullish follow-through was needed. The token is currently grinding along the lower edge of the kumo (cloud) near $2.14, having failed to maintain its position above the critical Kijun-sen level at $2.35.

    The situation appears particularly concerning on the XRP/BTC pair, which has declined to the crucial 2041-satoshi support level. This specific price point could prove pivotal, as it coincides with where the cloud formation significantly thins later in the year – potentially offering a more favorable breakout opportunity.

    SPONSORED

    Trade XRP with up to 100x leverage on perpetual contracts

    Trade Now on Defx

    Key Support Levels and Price Targets

    Several critical price levels warrant close attention:

    • Current resistance: $2.35 (Kijun-sen level)
    • Immediate support: $2.14 (cloud bottom)
    • Critical support: $1.89 (April cloud twist)
    • Last resort support: $1.70 (March spike low)

    While the immediate outlook appears neutral to bearish, Dr Cat emphasizes that the three-day chart has not yet turned definitively bearish on the USD pair. This suggests the potential for stabilization and eventual recovery, particularly if support at $2.14 holds through the summer months.

    November: The Next Major Opportunity

    The analysis points to November 2025 as the next significant window of opportunity for an XRP breakout. This timing coincides with a notably thin cloud formation on the XRP/BTC chart, which could facilitate an easier breakthrough. Recent whale movements from Turkish exchanges add an interesting dimension to this timeline, potentially setting up for significant price action later in the year.

    FAQ

    Q: Why is the $3 target being delayed?
    A: Technical indicators show weakening momentum and failed attempts to maintain higher levels, suggesting more time is needed for proper trend development.

    Q: What needs to happen for XRP to turn bullish?
    A: A clean break above $2.40, accompanied by a bullish Tenkan-Kijun cross and strong Chikou span positioning.

    Q: Is there immediate downside risk?
    A: Yes, there’s potential for a decline to $1.89, with limited support until $1.70 if that level fails.

    At press time, XRP trades at $2.17, maintaining a precarious position as markets await clearer directional signals.

  • Shiba Inu Price Forms Critical Support at $0.0000125 – What’s Next?

    Shiba Inu Price Forms Critical Support at $0.0000125 – What’s Next?

    Shiba Inu (SHIB) has entered a crucial consolidation phase after experiencing a sharp 16.7% decline from $0.00001500 to $0.00001250 between May 29-30. This price action, reminiscent of similar patterns seen in other meme coins, suggests a potential base formation that could determine SHIB’s next major move.

    Technical Analysis: Understanding SHIB’s Recent Price Action

    The recent sell-off triggered significant volume spikes, indicating widespread distribution and panic selling among holders. Current price action shows SHIB trading at $0.00001266, with key metrics revealing:

    • 24-hour change: +0.47%
    • 30-day decline: -3.80%
    • 180-day performance: -54.73%

    SPONSORED

    Trade SHIB with up to 100x leverage on perpetual contracts

    Trade Now on Defx

    Critical Support and Resistance Levels

    Key price levels to monitor include:

    • Current Support: $0.00001250
    • Major Resistance: $0.00001350-$0.00001400
    • 24-hour trading range: $0.00001257-$0.00001308

    Volume Analysis and Market Sentiment

    Trading volume analysis reveals a significant spike during the initial sell-off, followed by declining volume during consolidation. This pattern typically suggests exhaustion of selling pressure, though the overall market sentiment remains bearish.

    What’s Next for SHIB?

    Traders should watch for:

    • Breakout above $0.00001350 for potential bullish reversal
    • Break below $0.00001250 could trigger further downside
    • Volume patterns for confirmation of next major move

    Frequently Asked Questions

    Q: What caused the recent SHIB price drop?
    A: The decline appears driven by broader market uncertainty and significant holder distribution.

    Q: Where is SHIB likely to find strong support?
    A: The $0.00001250 level represents crucial support, with additional buying interest possible at $0.00001200.

    Q: What signals would confirm a bullish reversal?
    A: A decisive break above $0.00001350 with increasing volume would suggest renewed bullish momentum.

  • Dogecoin Price Analysis: DOGE Eyes $1 Target Despite 7% Drop

    Dogecoin Price Analysis: DOGE Eyes $1 Target Despite 7% Drop

    Dogecoin (DOGE) continues to show resilience despite a recent 7% price decline, with technical analysis suggesting significant upside potential. Recent regulatory easing in the meme coin sector could provide additional momentum for DOGE’s next major move.

    Technical Indicators Point to Bullish Momentum

    According to crypto analyst Jmorg’s detailed analysis, DOGE is displaying promising momentum signals on key technical indicators:

    • Money Flow Index (MFI) showing acceleration from low levels
    • Bollinger Bands width narrowing to historical lows
    • Cup-and-Handle pattern suggesting $1 price target
    • Rectangle breakout pattern indicating $0.95 potential

    SPONSORED

    Trade DOGE with up to 100x leverage on perpetual contracts

    Trade Now on Defx

    Key Price Targets and Fibonacci Analysis

    The analysis highlights several critical price levels:

    • Current price: $0.1897 (down 7% in 24 hours)
    • Initial target: $0.73 (previous ATH)
    • Secondary target: $1.20 (Fibonacci extension)
    • Long-term potential: $15 (contingent on Bitcoin reaching $200,000)

    Catalysts for DOGE’s Next Rally

    Several fundamental factors could drive DOGE’s price appreciation:

    1. Potential ETF approval driving institutional adoption
    2. X platform payment integration possibilities
    3. Pro-crypto policy developments
    4. Growing mainstream acceptance of meme coins

    FAQ Section

    What is the current Dogecoin price prediction?

    Technical analysis suggests potential targets of $0.73, $1.20, and long-term possibilities of reaching $15 under specific market conditions.

    Will Dogecoin reach $1 in 2025?

    Multiple technical indicators, including the Cup-and-Handle pattern and rectangle breakout, suggest $1 is a realistic target, supported by potential catalysts like ETF approval and X platform integration.

    Is Dogecoin a good investment now?

    While showing bullish technical signals, investors should consider the high volatility of meme coins and conduct thorough research before investing.

  • XRP Price Alert: Critical $2 Support at Risk as Bearish Pattern Forms

    XRP Price Alert: Critical $2 Support at Risk as Bearish Pattern Forms

    XRP’s price trajectory has entered a critical phase as the cryptocurrency faces mounting bearish pressure that threatens to push it below the psychological $2 support level. Recent bullish predictions of XRP reaching $22 may need revision as technical indicators point to continued downside in the short term.

    Technical Analysis Shows Deteriorating XRP Support

    Since initiating its correction phase on May 12, XRP has established a concerning pattern of lower highs on the daily timeframe, retreating significantly from its recent peak of $2.65. This decline follows what had been an impressive recovery from April’s $1.80 level, but momentum has clearly shifted bearish.

    Prominent crypto analyst MasterAnanda’s latest technical assessment on TradingView has identified several red flags:

    • Breakdown from rising channel formation
    • Three consecutive daily closes below critical support
    • Rejection at the $2.30 resistance zone
    • Fibonacci retracement showing vulnerability at 0.236 ($2.035)

    SPONSORED

    Trade XRP with up to 100x leverage on perpetual contracts

    Trade Now on Defx

    Volume Analysis Reveals Concerning Trends

    While bearish volume remains relatively low, this actually presents another concerning signal. The lack of strong buying pressure during this decline suggests market participants are stepping back, creating a vacuum that could accelerate price drops. Despite expanding institutional access, immediate buying interest appears muted.

    Critical Support Levels to Watch

    Traders should monitor these key price levels:

    • Current support: $2.13
    • Critical fibonacci level: $2.035
    • Major support zone: $1.70-$1.80
    • Previous resistance turned support: $2.30

    FAQ: XRP Price Action

    Q: What’s causing XRP’s current price decline?
    A: The decline is primarily technical, driven by breakdown from a rising channel and lack of buying pressure at higher levels.

    Q: Could XRP still reach its bullish targets?
    A: While long-term bullish outlook remains intact, short-term correction could test lower support levels first.

    Q: What’s the key level to watch?
    A: The $2.00 psychological support is crucial – a break below could accelerate selling to $1.70-$1.80 range.

    Market Statistics

    Current market metrics for XRP:

    • 24-hour decline: -3.85%
    • 7-day performance: -8.9%
    • Current price: $2.13
    • Distance from ATH: -19.6%
  • XRP Price Target $22: Bullish Candle Pattern Signals Massive Rally

    XRP Price Target $22: Bullish Candle Pattern Signals Massive Rally

    XRP’s price trajectory is showing significant bullish momentum, with renowned crypto analyst Egrag Crypto identifying a powerful candle formation that could propel the digital asset to an impressive $22 price target. This technical analysis comes amid growing institutional interest in the cryptocurrency market, as recent regulatory developments through the CLARITY Act continue to reshape the crypto landscape.

    Technical Analysis Points to Major XRP Breakout

    According to Egrag Crypto’s detailed analysis, the yearly chart displays a critical formation on candle 13, which could serve as the catalyst for XRP’s next major price movement. The analysis suggests two primary target zones:

    • Initial target: $13
    • Extended target: $22
    • Potential for higher peaks through price extension

    Critical Price Levels and Support Zones

    Current market indicators highlight several crucial price levels:

    • Current support: $2.25
    • Critical threshold: $3.40
    • Bull run confirmation level: Above $3.40
    • Bear scenario trigger: Below $1.85

    SPONSORED

    Trade XRP with up to 100x leverage and maximize your profit potential

    Trade Now on Defx

    Expert Analysis and Market Sentiment

    CasiTrades, another prominent analyst, has identified the $2.25 range as a crucial support and resistance zone. This level has historically acted as a pivotal point since the $0.50 breakout, suggesting strong technical significance for future price action.

    FAQ: XRP Price Predictions

    Q: What technical indicators support the $22 price target?
    A: The yearly chart shows a strong Bullish Engulfing pattern and multiple support confirmations above key levels.

    Q: When could XRP reach these price targets?
    A: Analysts point to December 31, 2025, as a potential milestone date for significant price action.

    Q: What are the key risk factors?
    A: A close below $1.85 could invalidate the bullish scenario and trigger a bearish reversal.

    Current Market Status

    As of the latest market data, XRP is trading at $2.21, representing a 3% decrease over the past 24 hours. Despite this short-term pullback, the longer-term technical structure remains bullish, supported by increasing trading volume and institutional interest.

  • Cardano Price Target $10: 5 Major Catalysts Could Drive 1,300% ADA Rally

    A prominent Cardano staking pool operator has sparked intense discussion in the crypto community by outlining five major catalysts that could propel ADA’s price to $10 by 2025 – representing a potential 1,300% surge from current levels. Let’s analyze these game-changing developments and their implications for Cardano’s future.

    1. Cardano’s Integration with Bitcoin DeFi

    In a groundbreaking development at Bitcoin 2025, Input Output demonstrated live Bitcoin-to-Cardano bridging via BitVM technology. This positions Cardano to tap into Bitcoin’s massive $1 trillion market, potentially capturing significant DeFi market share. The ‘Cardinal’ protocol will enable BTC holders to participate in lending, borrowing, and staking activities within Cardano’s ecosystem. As seen at the Bitcoin 2025 conference in Vegas, this integration represents a major step forward for cross-chain interoperability.

    2. Strategic ‘Glacier Drop’ Airdrop Campaign

    Cardano’s upcoming Midnight privacy sidechain will distribute NIGHT and DUST tokens to 37 million wallets across eight blockchains. This massive airdrop, notably excluding venture capitalists, could significantly expand Cardano’s user base and drive network adoption.

    SPONSORED

    Trade ADA with up to 100x leverage on perpetual contracts

    Trade Now on Defx

    3. Potential Spot ETF Approval

    NYSE Arca’s application to convert the Grayscale Cardano Trust into a spot ETF could be a watershed moment for institutional adoption. With recent regulatory breakthroughs in crypto, ADA’s transparent staking mechanics and manipulation resistance strengthen its case for approval.

    4. U.S. Strategic Reserve Inclusion

    The inclusion of ADA in the U.S. Digital Asset Stockpile marks a significant legitimization of Cardano. Following recent developments in government crypto reserves, this move could attract conservative institutional investors and boost market confidence.

    5. Ouroboros Leios Technical Upgrade

    The upcoming Leios upgrade promises to dramatically improve Cardano’s scalability, potentially enabling thousands of transactions per second without compromising decentralization. This technical advancement could position Cardano as a leading platform for enterprise-scale applications.

    Price Analysis and Market Impact

    Currently trading at $0.70, ADA’s potential surge to $10 would result in a $350 billion market cap. While ambitious, this target becomes more plausible when considering the convergence of these catalysts and broader market dynamics.

    FAQ Section

    When is the Cardano spot ETF decision expected?

    The SEC’s final decision deadline is October 22, 2025, with an initial review milestone on July 15, 2025.

    How many tokens will the Midnight airdrop distribute?

    The exact number hasn’t been disclosed, but the airdrop will target 37 million wallets across eight major blockchain networks.

    What transaction speed improvements can Leios deliver?

    According to simulations, the Leios upgrade could enable tens of thousands of transactions per second while maintaining decentralization.