Tag: Cryptocurrency Analysis

  • Toncoin (TON) Surges 10%: Key Resistance at $4.34 Signals Bullish Momentum

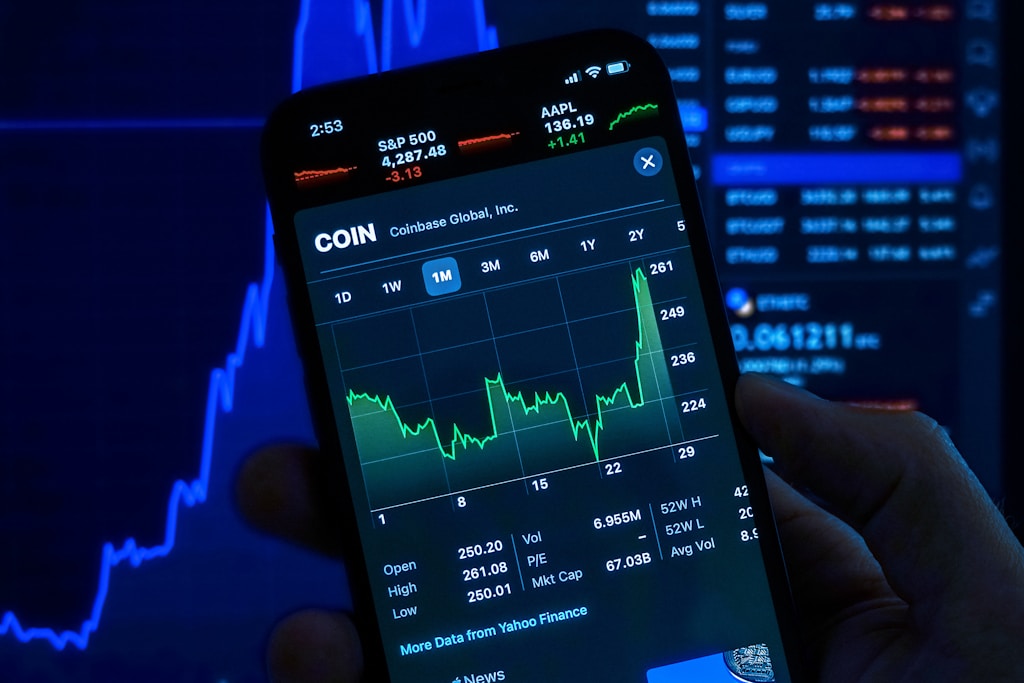
    Toncoin (TON) has demonstrated remarkable strength in recent market action, posting a steady climb from its $2.36 support level. This upward momentum reflects growing investor confidence and suggests a potential shift in market sentiment for the Telegram-backed cryptocurrency. Unlike the volatile swings common in the crypto market, TON’s measured ascent indicates robust underlying demand and sustainable growth patterns.

    Technical Analysis Points to Continued Strength

    The cryptocurrency is currently approaching a critical technical junction at the $4.34 resistance level, coinciding with the 100-day Simple Moving Average (SMA). This convergence of technical indicators has caught the attention of market analysts, who note that similar bullish patterns have emerged across major cryptocurrencies, suggesting a broader market recovery could be underway.

    SPONSORED

    Trade TON with up to 100x leverage on perpetual contracts

    Trade Now on Defx

    Key Price Levels and Trading Volume

    Trading volume has seen a significant 10% increase, validating the current price action. Key resistance levels to watch include:

    • Immediate resistance: $4.34
    • Secondary target: $6.13
    • All-time high target: $7.29

    Risk Assessment and Support Levels

    While the overall trend remains bullish, traders should monitor the $2.36 support level carefully. A breakdown below this threshold could trigger increased selling pressure and potentially lead to a deeper correction. However, current market dynamics suggest strong buyer interest at these levels.

    FAQ Section

    What is driving Toncoin’s current price surge?

    The surge is primarily driven by increased trading volume, strong technical indicators, and growing institutional interest in the TON ecosystem.

    What are the key resistance levels for TON?

    The immediate resistance is at $4.34, followed by $6.13, with the ultimate target being the all-time high of $7.29.

    Is TON a good investment at current levels?

    While technical indicators suggest bullish momentum, investors should conduct thorough research and consider their risk tolerance before making investment decisions.

  • XRP Network Activity Hits 11-Month High: Price Eyes $3 Breakout

    XRP Network Activity Hits 11-Month High: Price Eyes $3 Breakout

    XRP’s network metrics are flashing major bullish signals as active addresses surge to levels not seen since April 2023, potentially setting the stage for significant price action. The cryptocurrency has demonstrated remarkable resilience amid broader market turbulence, maintaining crucial support levels while its network activity suggests growing adoption.

    According to recent Glassnode data, XRP has recorded nearly 627,000 active addresses – marking an 11-month high that coincides with growing institutional interest in XRP products. This surge in network participation comes at a critical time as the token trades above key support levels despite market-wide selling pressure.

    SPONSORED

    Trade XRP with up to 100x leverage on perpetual contracts

    Trade Now on Defx

    Network Fundamentals Signal Growing Adoption

    The spike in active addresses represents a significant milestone for XRP, suggesting increased user engagement and potential accumulation. Historical data shows that such network activity often precedes major price movements, as it indicates genuine user adoption rather than speculative trading.

    This surge in network activity aligns with recent technical analysis projecting significant upside potential for XRP. The token currently trades at $2.41, having bounced strongly from recent lows of $1.89 – a 33% recovery that demonstrates robust buyer interest.

    Technical Analysis: Key Support and Resistance Levels

    XRP’s price structure shows several critical levels that traders should monitor:

    • Current Support: $2.30
    • Major Resistance: $3.00
    • Secondary Support: $2.00
    • Previous Low: $1.89

    Market Outlook and Price Projections

    The combination of strong network metrics and technical support levels suggests XRP could be positioning for a significant move higher. The $3.00 level represents the next major psychological and technical resistance, with a breakthrough potentially opening the path to new highs.

    FAQ Section

    What does the surge in active addresses mean for XRP?

    Increased active addresses typically indicate growing network adoption and usage, which often correlates with positive price action.

    What are the key price levels to watch?

    The critical support level is $2.30, while $3.00 represents the next major resistance target.

    How does XRP’s performance compare to other cryptocurrencies?

    XRP has shown superior resilience compared to many altcoins, maintaining stronger support levels during recent market volatility.

  • XRP Price Target Hits $38: Technical Analysis Reveals Massive Rally Potential

    XRP Price Target Hits $38: Technical Analysis Reveals Massive Rally Potential

    The cryptocurrency market is witnessing a significant development as XRP shows strong bullish momentum, with a respected analyst projecting an ambitious price target of $38. This analysis comes at a crucial time, following recent whale accumulation of $2.5B in XRP and the SEC’s decision to drop their appeal.

    Technical Analysis Points to Major XRP Breakout

    Crypto analyst Gert van Lagen has presented compelling technical evidence supporting a potential surge to $38 for XRP. The analysis is based on two powerful bullish patterns:

    • A 7-year Double Bottom formation (2014-2020)
    • An emerging Ascending Triangle pattern

    This forecast aligns with Ripple’s strategic reserve plans, though it presents a significantly more bullish outlook.

    SPONSORED

    Trade XRP with up to 100x leverage on perpetual contracts

    Trade Now on Defx

    Key Technical Indicators Supporting the Rally

    The Double Bottom pattern, spanning from 2014 to 2020, previously triggered two significant price movements:

    • Initial breakout to $0.28 (Wave 1)
    • Secondary surge to $2.5 (Wave 2)

    The current Ascending Triangle formation suggests a continuation of this bullish trend, with potential for exponential growth.

    Market Sentiment and Regulatory Environment

    The bullish outlook is further supported by:

    • Resolution of SEC legal challenges
    • Increased institutional interest
    • Growing market liquidity

    FAQ: XRP Price Projection

    Why is $38 considered a conservative target?

    Historical data shows XRP’s previous rallies exceeded parabolic targets by 2x, suggesting potential for even higher prices.

    What are the key resistance levels to watch?

    Primary resistance stands at $3 (previous ATH), followed by psychological levels at $5, $10, and $20.

    How does the SEC case resolution impact price potential?

    The regulatory clarity removes a major barrier to institutional adoption and market growth.

    As the crypto market continues to evolve, XRP’s position as a major altcoin, combined with strong technical indicators and positive market sentiment, creates a compelling case for significant price appreciation. Investors should maintain proper risk management while monitoring these developing patterns.

  • FET Price Surges After $0.452 Support: Key Levels to Watch

    FET Price Surges After $0.452 Support: Key Levels to Watch

    Fetch.AI (FET) is demonstrating remarkable strength as the token stages a significant recovery from its crucial $0.452 support level. This technical analysis examines the key factors driving FET’s price action and potential targets ahead.

    FET Price Action Analysis: Support Holds Strong

    The $0.452 level has emerged as a pivotal support zone for FET, successfully halting the recent downward pressure and catalyzing a notable rebound. This price point’s significance is amplified by the substantial buying volume that materialized, indicating strong institutional and retail interest at these levels.

    Technical indicators paint an increasingly bullish picture for FET:

    • The 4-hour Simple Moving Average (SMA) is on the verge of a bullish crossover
    • Trading volume has seen a significant uptick, confirming buyer conviction
    • Price action is forming a clear upward channel pattern

    SPONSORED

    Trade FET with up to 100x leverage on perpetual contracts

    Trade Now on Defx

    Key Price Targets and Resistance Levels

    As FET continues its upward trajectory, several critical price levels demand attention:

    Price Level Significance
    $0.80 Primary resistance target
    $1.09 Major psychological resistance
    $0.452 Current support level

    Risk Factors and Market Considerations

    While the current momentum appears strong, traders should consider several risk factors:

    • Broader market volatility could impact FET’s recovery
    • Resistance at $0.80 may trigger profit-taking
    • Technical indicators suggest potential short-term overbought conditions

    Frequently Asked Questions

    What caused FET’s recent price rebound?

    The strong support at $0.452 combined with increased buying pressure and positive technical indicators contributed to FET’s recovery.

    What are the key resistance levels for FET?

    The primary resistance levels are $0.80 and $1.09, with the former acting as an immediate target for bulls.

    Is FET’s current rally sustainable?

    The increased trading volume and technical indicators suggest potential for sustained upward movement, though market conditions remain volatile.

    Time to read: 4 minutes

  • Ethereum Price Set for $2,600 Breakout as CLS Signals Major Rally

    Ethereum (ETH) is showing strong technical signals for an imminent price surge, with multiple indicators suggesting a potential rally to $2,600 and beyond. Leading crypto analysts have identified a confluence of bullish patterns that could drive significant upside in the coming weeks.

    CLS Analysis Points to Major Ethereum Price Movement

    Renowned crypto analyst David Perk has published comprehensive research highlighting how Ethereum’s Continuous Linked Settlement (CLS) patterns indicate an approaching breakout. The analysis shows ETH’s daily and monthly CLS metrics aligning in a historically bullish formation, with $2,055 acting as a key interim target before a potential move above $2,600.

    CLS, which processes over $6.5 trillion in daily volume from institutional players, serves as a crucial indicator of “smart money” movements in the market. This settlement system, widely used in traditional forex markets, has become increasingly relevant for predicting major cryptocurrency price shifts.

    SPONSORED

    Trade Ethereum with up to 100x leverage on perpetual contracts

    Trade Now on Defx

    Technical Patterns Confirm Bullish Outlook

    Adding weight to the bullish thesis, crypto analyst Marzell has identified a clear breakout from a Falling Wedge pattern, a classic bullish reversal signal. The pattern completion at $1,991 suggests a potential surge to $2,821, representing a 41.69% increase from current levels.

    This technical analysis aligns with broader market sentiment, as recent data shows Ethereum ETFs experiencing capital outflows, potentially indicating a rotation back into spot ETH positions ahead of the anticipated rally.

    Key Price Levels to Watch

    • Current Price: $2,008
    • Initial Resistance: $2,055 (Monthly CLS)
    • Major Target: $2,600
    • Extended Target: $2,821 (Wedge Pattern Projection)

    FAQ

    What is CLS and why does it matter for Ethereum?
    CLS (Continuous Linked Settlement) is a global settlement system used by major financial institutions that processes trillions in daily volume. For Ethereum, it helps predict institutional money flows and potential price movements.

    What makes the current setup particularly bullish?
    The combination of positive CLS metrics, a confirmed Falling Wedge breakout, and strong support at current levels creates a robust foundation for upward price movement.

    What could invalidate this bullish scenario?
    A daily close below $1,991 would invalidate the Falling Wedge breakout and could signal a potential trend reversal.

  • XRP Price Alert: $2.66 Level Critical for Wave 4 Breakout Target

    The XRP market stands at a crucial technical junction, with the $2.66 price level emerging as a decisive factor for the token’s next major move. Recent analysis following the SEC’s lawsuit withdrawal suggests this specific price point could determine whether XRP continues its upward trajectory or faces a corrective wave.

    Critical Price Levels for XRP’s Next Move

    According to prominent crypto analyst Egrag Crypto, XRP must maintain prices above $2.66 to avoid a potential corrective phase. The analysis indicates several key price levels that traders should monitor:

    • Primary resistance: $2.65-$2.70 range
    • Secondary confirmation level: $2.97
    • Major breakout point: $3.40 (current ATH)
    • Potential downside risk: $1.70 if support fails

    SPONSORED

    Trade XRP with up to 100x leverage on perpetual contracts

    Trade Now on Defx

    Wave Analysis and Price Projections

    Multiple analysts have weighed in on XRP’s potential trajectory. Dark Defender projects a rally to $5, outlining a specific wave pattern:

    • Wave 3: Initial surge to $4.40
    • Wave 4: Correction to $3.70
    • Wave 5: Final push to $5.60

    SEC Lawsuit Resolution Impact

    The recent resolution of the SEC lawsuit against Ripple has created a fundamentally bullish backdrop for XRP. This development coincides with broader market strength that has pushed XRP up 12% following the SEC resolution.

    FAQ Section

    What is the current XRP price?

    XRP is currently trading at $2.45, showing a 7% increase in the last 24 hours.

    What are the key resistance levels for XRP?

    The critical resistance levels are $2.66, $2.97, and $3.40 (ATH).

    What is the potential downside risk?

    If support levels fail, XRP could potentially drop to $1.70 before resuming its upward trajectory.

    Current market indicators suggest XRP is at a pivotal moment, with technical analysis pointing to significant potential movement in either direction. Traders should closely monitor the identified price levels while considering both technical and fundamental factors in their trading decisions.

  • XRP Price Target $6 After SEC Drops Ripple Lawsuit – Full Analysis

    XRP Price Target $6 After SEC Drops Ripple Lawsuit – Full Analysis

    In a landmark development for the cryptocurrency industry, the SEC has announced it will discontinue proceedings against Ripple in the long-running XRP lawsuit. This decision, confirmed by Ripple CEO Brad Garlinghouse, marks a decisive victory that could propel XRP to new heights. As previously reported, XRP’s initial surge to $2.59 following the SEC announcement may just be the beginning of a larger rally.

    Breaking Down the SEC’s Decision

    After more than four years of legal battles, the SEC’s withdrawal represents a watershed moment for both Ripple and the broader crypto industry. Attorney Jeremy Hogan has outlined four potential scenarios moving forward:

    • Continued appeal by Ripple for precedent-setting ruling
    • Appeal withdrawal with trial court judgment amendments
    • Mutual agreement without judgment modifications
    • Simple $125 million settlement payment

    SPONSORED

    Trade XRP with up to 100x leverage and maximize your profit potential

    Trade Now on Defx

    Technical Analysis Points to $6 Target

    Crypto analyst Dark Defender’s Elliott Wave analysis suggests a powerful upward trajectory for XRP. This aligns with previous predictions of a potential 75% rally targeting the $4 level, though the latest analysis suggests even higher targets:

    • Wave 3 target: $3.94 (161.8% Fibonacci extension)
    • Wave 4 correction zone: $3.78-$3.94
    • Final Wave 5 target: $4.92 (361.8% Fibonacci level)
    • Ultimate price target: $6+

    Market Implications and Trading Outlook

    The breakthrough above the descending trendline at $2.47 signals strong bullish momentum. Key support levels have been established at:

    • $2.30 (61.8% Fibonacci level)
    • $2.22 (70.2% Fibonacci level)
    • $1.79 (recent local low)

    FAQ Section

    Q: When will XRP reach $6?
    A: Based on current Elliott Wave projections, XRP could reach $6 following the completion of Wave 5, though specific timing depends on market conditions.

    Q: What are the key resistance levels?
    A: Primary resistance levels are at $3.94, $4.50, and $4.92, with $6 as the ultimate target.

    Q: How does the SEC decision affect XRP’s future?
    A: The SEC’s withdrawal removes a major regulatory obstacle, potentially allowing for broader institutional adoption and exchange relisting.

  • Solana’s $135 Battle: Critical Price Level Looms

    Solana’s $135 Battle: Critical Price Level Looms

    Market Overview

    Solana (SOL) finds itself at a crucial juncture as on-chain data reveals a major test at the $135 price level. The cryptocurrency has experienced a dramatic 60% decline since January, with current price action suggesting more volatility ahead. Recent market data shows SOL lagging behind Bitcoin’s momentum, raising concerns among investors.

    Technical Analysis Deep Dive

    According to renowned analyst Ali Martinez, the UTXO Realized Price Distribution (URPD) indicator has identified $135 as the most significant resistance level for SOL. This metric, which tracks historical transaction volumes at specific price points, suggests that a substantial amount of SOL previously changed hands at this level.

    Current Market Position

    Trading at $126, SOL sits precariously close to critical support levels. The weekly demand zone near $120 represents the last line of defense before potential further downside to $100. Market participants are closely monitoring volume profiles and order book data for signs of accumulation or distribution.

    SPONSORED

    Trade Solana with up to 100x leverage on perpetual contracts

    Trade Now on Defx

    Market Implications

    The battle for $135 represents more than just a technical level – it could determine SOL’s trajectory for the coming months. A successful break above this resistance could trigger a relief rally toward $150, while failure to reclaim it might accelerate selling pressure toward the psychological $100 mark.

    Expert Outlook

    Market analysts remain divided on SOL’s near-term prospects. While some point to oversold conditions and potential accumulation at current levels, others warn of broader market uncertainty affecting recovery attempts. The coming weeks will be crucial for determining whether bulls can defend current support levels and mount a meaningful recovery.

  • Altcoin Bloodbath: CZ’s Warning Rocks Markets! 📉

    The cryptocurrency market faces a stark reality check as Binance founder Changpeng Zhao (CZ) delivers a sobering assessment of the altcoin market, suggesting the highly anticipated ‘Altseason’ remains elusive despite growing speculation.

    CoinMarketCap’s New Metric Reveals Harsh Truth

    According to CZ’s analysis of CoinMarketCap’s newly introduced “Altcoin Season Index,” only 14 out of the top 100 altcoins have managed to outperform Bitcoin in the past quarter. This represents a mere 14% success rate against the benchmark cryptocurrency, falling significantly short of the 75% threshold typically associated with an Altseason.

    Market Performance Breakdown

    • Leading 2024 cryptocurrencies (SUI, SOL): 37-41% decline
    • Popular memecoins (WIF, PEPE, FLOKI, BONK): 70-80% losses
    • Top performers: Monero, Hyperliquid, Pi, Mantra, Berachain

    Expert Perspectives on Market Bottom

    While the current market presents a challenging landscape, several industry experts offer divergent views on the path forward. Analyst Michaël van de Poppe highlights the persistent negative performance across higher timeframes, while Altcoin Sherpa suggests the market bottom could be near, drawing parallels to the Summer 2024 retrace.

    In a significant development, Trump’s recent announcement of a Strategic Bitcoin Reserve briefly sparked hope across the crypto market, though the subsequent clarification by White House AI and Crypto Czar David Sacks tempered expectations.

    The New Paradigm: Volume Over Dominance

    CryptoQuant’s CEO Ki Young Ju presents a contrarian view, suggesting that the traditional metrics for measuring Altseason may no longer apply. According to Ju, trading volume, rather than Bitcoin dominance, will be the key indicator for this cycle’s altcoin performance.

    SPONSORED

    Trade meme coins with up to 100x leverage on Defx

    Trade Now on Defx

    Market Implications

    The current market structure suggests a selective and challenging environment ahead for altcoins. Investors should focus on projects with strong fundamentals and clear use cases, as the traditional “rising tide lifts all boats” scenario appears increasingly unlikely.

  • Solana Bulls Eye $211: Key Support Holds – Rally Next?

    Solana Bulls Eye $211: Key Support Holds – Rally Next?

    Market Analysis: Solana Shows Signs of Recovery

    Solana (SOL) is displaying renewed strength in the cryptocurrency market, with bulls defending the critical $137 support level. This price action has sparked optimism among traders and analysts, particularly as recent market volatility had previously tested SOL’s resilience.

    Technical Indicators Signal Potential Uptrend

    The current market structure shows several bullish indicators:

    • Strong support established at $137
    • Price targeting $164 resistance level
    • 100-day SMA acting as a critical technical barrier
    • MACD showing potential bullish crossover
    • Increasing buying pressure confirmed by volume analysis

    Key Price Levels to Watch

    Traders should monitor these crucial price zones:

    • Support: $137 – Currently holding as strong foundation
    • First Resistance: $164 – Immediate target for bulls
    • Major Resistance: $211 – Key level for confirming trend reversal
    • Fallback Support: $118 – Secondary support if current levels fail

    SPONSORED

    Trade Solana with up to 100x leverage on perpetual contracts

    Trade Now on Defx

    Market Implications and Risk Assessment

    While the immediate outlook appears positive, traders should remain cautious of potential bearish scenarios. A failure to maintain momentum above $137 could trigger a cascade of selling pressure, potentially pushing prices toward the $118 support zone. Trading volume will be crucial in confirming the sustainability of any upward movement.

    Expert Outlook

    Technical analyst Sarah Chen from CryptoView states, ‘The current price action suggests a potential trend reversal, but SOL needs to decisively break above $164 to confirm bullish momentum.’

    Source: NewsbtC