Solana, XRP, Dogecoin Prices Slump as Market Sentiment Weakens
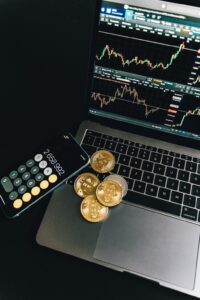
Leading altcoins Solana (SOL), XRP, and Dogecoin (DOGE) have experienced significant downward pressure this week, underperforming Bitcoin amid growing trade...
Leading altcoins Solana (SOL), XRP, and Dogecoin (DOGE) have experienced significant downward pressure this week, underperforming Bitcoin amid growing trade...
Paris Saint-Germain's fan token (PSG) demonstrated the growing intersection of sports and cryptocurrency markets today, surging 18% following the club's...
Ethereum (ETH) could be on the verge of a massive price surge, with multiple prominent crypto analysts aligning on an...
Bitcoin's price action remains surprisingly muted despite unprecedented institutional interest and record-breaking conference attendance, suggesting a potential disconnect between market...
Bitcoin's recent surge to an all-time high of $111,000 may not be the bullish signal many investors believe it to...

In a significant move that reinforces institutional confidence in Bitcoin, Strategy has expanded its position as the largest corporate Bitcoin...
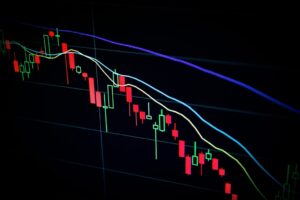
Bitcoin's price trajectory has taken a bearish turn following its recent all-time high of $111,000, with analysts now eyeing crucial...
Time to Read: 8 minutes Bitcoin achieved a significant milestone last week, reaching a new all-time high (ATH) during the...
The US spot Bitcoin ETF market has experienced its first significant setback of 2025, recording $157 million in net outflows...
In a groundbreaking development for cryptocurrency adoption, U.S. Senator JD Vance's recent endorsement of Bitcoin has coincided with the digital...


