Tag: Cryptocurrency Trading

  • XRP Price Consolidates at $2.16: Technical Analysis Points to Major Breakout

    XRP, Ripple’s native cryptocurrency, is showing signs of a potential breakout as it consolidates around the $2.16 mark. This technical analysis explores key support levels, trading patterns, and potential price targets for XRP in the coming days.

    Current XRP Market Status

    As of March 30, 2025, XRP is trading at $2.16, demonstrating the following key metrics:

    • Market Capitalization: $125 billion
    • 24-hour Trading Volume: $2.76 billion
    • Intraday Trading Range: $2.09 – $2.21
    • Distance from All-Time High: -36.4%

    This consolidation phase follows recent price struggles at the $2 level, suggesting a potential shift in market momentum.

    Technical Analysis Breakdown

    The 1-hour chart analysis reveals several critical patterns:

    • Formation of a tight consolidation range between $2.09 and $2.21
    • Emergence of minor green candlesticks indicating buying pressure
    • Decreasing trading volume suggesting accumulation phase

    Key Support and Resistance Levels

    Level Type Price Point Significance
    Major Support $2.09 Current consolidation bottom
    Minor Support $2.12 Intraday pivot point
    Resistance $2.21 Upper consolidation range

    SPONSORED

    Trade XRP with up to 100x leverage on perpetual contracts

    Trade Now on Defx

    Potential Breakout Scenarios

    Recent analysis suggests a possible bullish pattern targeting $3.90 in the medium term. Key scenarios include:

    Bullish Case

    • Break above $2.21 could trigger rapid movement to $2.35
    • Volume increase above average would confirm breakout
    • RSI showing potential for upward momentum

    Bearish Case

    • Break below $2.09 might lead to retest of $2.00
    • Increased selling pressure could invalidate consolidation

    FAQ Section

    What is causing XRP’s current consolidation?

    The consolidation appears to be driven by a balance between institutional accumulation and retail profit-taking following recent price movements.

    When can we expect the breakout to occur?

    Technical indicators suggest a resolution of the current pattern within the next 24-48 hours, though exact timing remains uncertain.

    What are the key levels to watch?

    Traders should monitor the $2.21 resistance and $2.09 support levels for potential breakout signals.

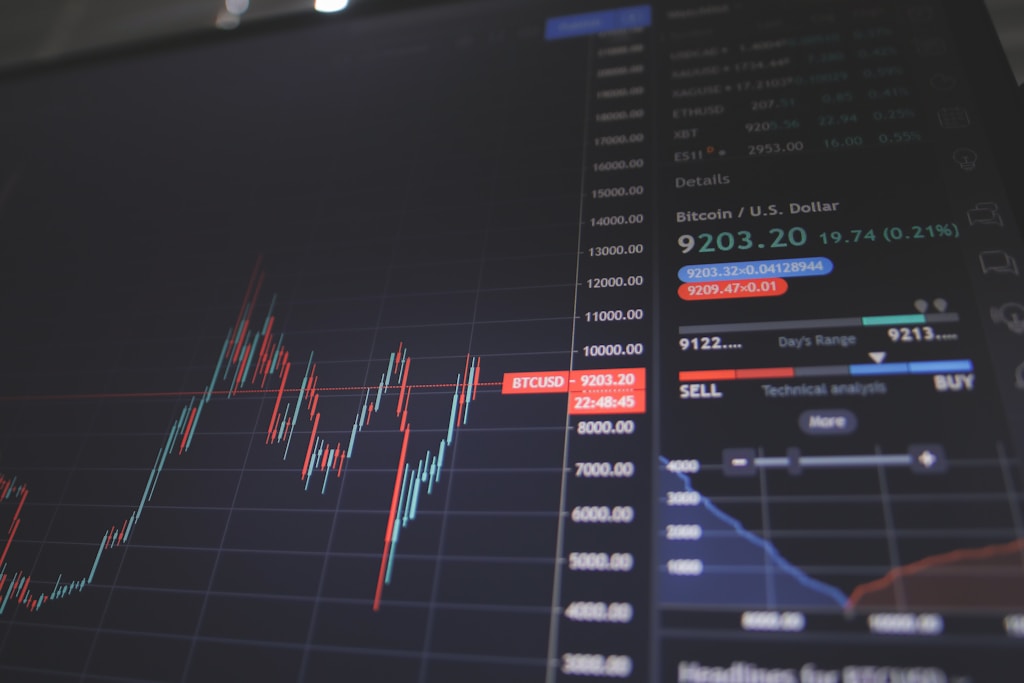
  • Bitcoin Defies Trump Tariffs: 3 New Crypto Projects Set to Surge

    Arthur Hayes, former BitMEX CEO and current CIO of Maelstrom, has delivered a powerful message about Bitcoin’s resilience in the face of mounting trade tensions. As de-dollarization concerns grow, Hayes argues that new tariffs on Canadian, Mexican, and Chinese goods will actually fuel Bitcoin’s ascent rather than hinder it.

    Why Tariffs Could Accelerate Bitcoin’s Growth

    Hayes presents a compelling case: trade restrictions lead to higher prices and increased money printing, creating the perfect storm for Bitcoin adoption. This aligns with recent market data showing Bitcoin exchange outflows reaching 2025 highs, suggesting growing institutional confidence despite macro headwinds.

    SPONSORED

    Trade Bitcoin with up to 100x leverage and maximize your profit potential

    Trade Now on Defx

    Three Emerging Projects Positioned for Growth

    1. BTC Bull Token ($BTCBULL)

    This innovative project directly leverages Bitcoin’s momentum through milestone-based airdrops. With a current presale price of $0.002435 and $4.2M already raised, it offers a unique way to gain Bitcoin exposure without the high entry costs.

    2. Meme Index ($MEMEX)

    A first-of-its-kind index token providing broad exposure to the meme coin sector, complete with staking rewards up to 535%. The project has raised $4.3M in presale funding and features four specialized indices tracking different segments of the meme coin market.

    3. Notcoin ($NOT)

    A viral Telegram-based project transitioning to The Open Network (TON), Notcoin represents the convergence of gaming and crypto. Its democratic distribution model and massive user base position it well for mainstream adoption.

    Expert Analysis and Market Outlook

    Hayes’s thesis suggests that trade restrictions will accelerate rather than impede crypto adoption. This view is supported by recent market data showing reduced selling pressure in Bitcoin markets.

    FAQ Section

    How do tariffs affect Bitcoin price?

    Tariffs typically lead to inflation and currency devaluation, making Bitcoin more attractive as a store of value.

    Are these new crypto projects safe investments?

    All crypto investments carry risk. Always conduct thorough research and never invest more than you can afford to lose.

    What’s the best way to gain Bitcoin exposure in 2025?

    Options include direct Bitcoin purchases, Bitcoin-linked tokens like $BTCBULL, or regulated Bitcoin ETFs.

    Disclaimer: This article is for informational purposes only and should not be considered financial advice. Always conduct your own research before making any investment decisions.

  • XRP Price Alert: Inverse H&S Pattern Signals Potential $3.90 Surge

    XRP Price Alert: Inverse H&S Pattern Signals Potential $3.90 Surge

    XRP’s price action has entered a critical phase as the fourth-largest cryptocurrency shows signs of a potential bullish reversal despite recent market turbulence. Technical analysis reveals a developing inverse head and shoulders pattern that could propel XRP towards the $3.90 mark, representing a significant opportunity for traders and investors. As XRP continues to test key support levels, understanding the technical setup becomes crucial for market participants.

    Current Market Status and Technical Formation

    XRP has experienced considerable selling pressure over the past week, recording a 10.51% decline and touching lows of $2.06. However, prominent analyst Egrag Crypto has identified a potentially game-changing technical formation that could reverse this downward trajectory.

    Key price levels to monitor:

    • Current Price: $2.18 (+0.91% 24h)
    • Critical Support: $2.00
    • Neckline Resistance: $2.65
    • Major Resistance: $3.00
    • Target Zones: $3.70-$3.90, potential extension to $4.60

    Understanding the Inverse Head and Shoulders Pattern

    The inverse head and shoulders pattern currently forming on XRP’s daily chart is a powerful bullish reversal indicator. This technical formation consists of:

    • Left Shoulder: Initial price low followed by recovery
    • Head: Deeper price low marking the bottom
    • Right Shoulder: Higher low compared to the head

    SPONSORED

    Trade XRP with up to 100x leverage on perpetual contracts

    Trade Now on Defx

    Critical Price Levels and Breakout Scenarios

    For the bullish scenario to materialize, several key conditions must be met:

    1. Maintain price above $2.00 support
    2. Break above $2.65 neckline resistance
    3. Clear the psychological $3.00 barrier
    4. Confirm breakout above $3.20-$3.40 zone

    Regulatory Catalyst: SEC Case Resolution

    Adding to the bullish outlook, the SEC’s long-running case against Ripple is expected to conclude in May 2025. This regulatory clarity could remove a significant overhang from XRP’s price action and potentially accelerate the technical breakout scenario.

    Trading Volume Analysis

    Current market data shows:

    • 24h Trading Volume: -10.28%
    • Decreasing selling pressure
    • Signs of price stabilization

    FAQ Section

    When will the inverse head and shoulders pattern expire?

    According to analyst Egrag Crypto, the pattern remains valid until April 20, 2025.

    What could invalidate this bullish setup?

    A daily close below $2.00 would invalidate the current bullish formation.

    What is the highest potential price target?

    While the conservative target sits at $3.90, extended projections suggest XRP could reach $4.60 before experiencing significant resistance.

    Traders should maintain strict risk management practices and consider multiple scenarios when planning their positions. As always, technical analysis should be combined with fundamental research and market sentiment for comprehensive trading decisions.

  • Bitcoin Price Faces Critical $73,919 Support After Rising Wedge Break

    Bitcoin Price Faces Critical $73,919 Support After Rising Wedge Break

    Bitcoin’s price trajectory has taken a bearish turn as a rising wedge pattern breakdown threatens to push BTC toward crucial support at $73,919. This technical development comes amid increasing market uncertainty, with recent price action showing significant pressure on key support levels.

    Technical Analysis: Rising Wedge Breakdown Signals Bearish Momentum

    The cryptocurrency market’s flagship asset has confirmed a bearish rising wedge pattern breakdown, traditionally a reliable reversal signal. This technical formation suggests that Bitcoin’s recent upward momentum is losing steam, potentially setting the stage for a deeper correction.

    Key technical indicators supporting the bearish case include:

    • MACD crossing below the signal line
    • Price breaking below the 100-day SMA
    • Multiple failed attempts to reclaim lost support levels
    • Formation of consecutive red candles indicating sustained selling pressure

    Critical Support Level: Will $73,919 Hold?

    The immediate focus is on the $73,919 support level, which could determine Bitcoin’s short-term direction. A breakdown below this critical zone could trigger further selling pressure, potentially leading to tests of lower support levels at $65,082 and $60,152.

    SPONSORED

    Trade Bitcoin with up to 100x leverage and maximize your profit potential

    Trade Now on Defx

    Market Implications and Trading Considerations

    Traders should consider several factors when positioning themselves:

    • Volume analysis shows increasing selling pressure
    • Risk management is crucial near the $73,919 support
    • Watch for potential bounce attempts from this level
    • Monitor whale activity for possible accumulation signals

    Frequently Asked Questions

    What caused Bitcoin’s rising wedge breakdown?

    The breakdown resulted from weakening buying pressure and increased selling activity, particularly after Bitcoin failed to maintain momentum above key moving averages.

    Could Bitcoin recover from current levels?

    While possible, Bitcoin needs to reclaim and hold above $73,919 to signal a potential trend reversal. Strong buying volume would be necessary for a sustainable recovery.

    What are the next major support levels below $73,919?

    If the $73,919 support fails, Bitcoin could test lower support levels at $65,082 and $60,152, which represent previous areas of significant buying interest.

  • Ethereum RSI Hits 2018 Low: Major Price Reversal Incoming?

    Ethereum RSI Hits 2018 Low: Major Price Reversal Incoming?

    Ethereum’s monthly Relative Strength Index (RSI) has reached levels not seen since the 2018 bear market bottom, potentially signaling a major trend reversal ahead. This technical development comes as ETH continues to show bearish pressure below crucial support levels, currently trading at $1,880.

    Key Technical Developments for Ethereum

    According to Chartered Market Technician Tony Severino, Ethereum’s monthly RSI has dropped to critical levels that historically preceded significant price rallies. The last time ETH’s RSI reached these levels in 2018, the cryptocurrency surged nearly 4,000%, climbing from $120 to its all-time high of $4,878.

    SPONSORED

    Trade Ethereum with up to 100x leverage and maximize your profit potential

    Trade Now on Defx

    Historical Context and Price Implications

    The current RSI reading carries significant weight in technical analysis:

    • 2018 Bottom: 94% drop from ATH before reversal
    • 2022 Bottom: Similar RSI levels led to substantial recovery
    • Current Situation: 56% drop from local high
    • 63% below all-time high of $4,878

    Market Factors Affecting Ethereum’s Price

    Several key factors are currently influencing ETH’s price action:

    • Recent U.S. inflation data impact
    • Loss of psychological $2,000 support level
    • Broader crypto market correlation
    • Technical indicator convergence

    Expert Analysis and Price Targets

    While the RSI suggests a potential bottom formation, traders should consider multiple scenarios:

    Scenario Price Target Probability
    Bullish Case $4,000+ High if RSI pattern holds
    Neutral Case $2,000-$2,500 Medium-term consolidation
    Bearish Case $1,500-$1,800 Further downside possible

    FAQ Section

    What does the current RSI level mean for Ethereum?

    The current RSI level suggests extreme oversold conditions, historically preceding significant price recoveries.

    Could Ethereum drop further from current levels?

    While the RSI indicates oversold conditions, the current 56% drawdown is less severe than the 94% drop in 2018, suggesting potential for additional downside.

    What are the key resistance levels to watch?

    Primary resistance levels include $2,000 (psychological), $2,160 (recent rejection), and $2,500 (major technical resistance).

    Investors should maintain proper risk management and consider multiple technical and fundamental factors before making trading decisions.

  • Ethereum Price Fails $2,160 Breakout: Key Support Levels Revealed

    Ethereum Price Fails $2,160 Breakout: Key Support Levels Revealed

    Ethereum (ETH) bulls faced disappointment today as the leading smart contract platform failed to breach the critical $2,160 resistance level, signaling potential further downside ahead. This technical analysis examines the key levels traders should watch and what this failed breakout means for ETH’s near-term trajectory.

    Failed Breakout Signals Bearish Control

    The rejection at $2,160 marks a significant technical failure for Ethereum, as this level has acted as a major resistance zone throughout March. The inability to push through this barrier suggests bears maintain firm control of price action, with several technical indicators now flashing warning signs.

    Key technical factors contributing to the bearish outlook include:

    • Weak trading volume during the recovery attempt
    • RSI breakdown below key support levels
    • MACD showing increasing bearish momentum
    • Failure to hold above the 20-day moving average

    SPONSORED

    Trade ETH with up to 100x leverage on perpetual contracts

    Trade Now on Defx

    Critical Support Levels to Watch

    With bearish pressure mounting, traders should monitor these key support levels:

    Support Level Significance
    $1,523 Primary support zone & previous demand area
    $902 Major psychological support & historical reaction point

    Technical Indicator Analysis

    The Relative Strength Index (RSI) has broken down below key thresholds, currently showing readings consistent with weakening bullish momentum. This technical deterioration suggests that buying pressure is fading rapidly, making it increasingly difficult for ETH to mount a sustained recovery.

    Additionally, the Moving Average Convergence Divergence (MACD) has turned bearish, with the indicator crossing below its signal line. This bearish crossover typically precedes extended downside moves, adding to the concerning technical picture.

    Trading Volume Analysis

    One of the most concerning aspects of the recent price action has been the lack of significant buying volume during attempted recoveries. Healthy breakouts require strong volume confirmation, and the absence of this crucial element suggests that the current price structure remains vulnerable.

    Frequently Asked Questions

    What caused Ethereum’s failed breakout at $2,160?

    The rejection was primarily due to weak buying volume and strong selling pressure at the resistance level, indicating insufficient bullish momentum to overcome established resistance.

    What are the next major support levels for ETH?

    The first major support lies at $1,523, followed by a crucial psychological level at $902. These levels represent potential areas where buyers might step in.

    Could ETH still recover from current levels?

    While possible, a recovery would require significantly increased buying volume and a clear break above the $2,160 resistance level with strong momentum.

    Traders should maintain strict risk management practices given the current technical weakness in ETH’s price structure. While long-term fundamentals remain strong, the short-term picture suggests caution is warranted.

  • XRP Price Forms Bullish Pattern: $3.90 Target Within 120 Days

    XRP’s price action is showing promising signs of a major bullish reversal, with technical analysis revealing a potentially lucrative setup for investors. Despite a recent 4.7% decline pushing the price to $2.12, a powerful inverse head and shoulders pattern is forming that could catapult XRP to new heights.

    Technical Analysis Reveals Bullish Setup

    Renowned crypto analyst Egrag Crypto has identified an inverse head and shoulders pattern on XRP’s daily timeframe, a formation historically associated with significant price reversals. This technical setup, which has been developing since early March, suggests a potential surge to the $3.70-$3.90 range upon completion.

    The pattern is particularly significant given XRP’s recent price action, which saw a decline from $2.47 and a 13.8% drop over three days. However, this retracement may be the final piece needed to complete the pattern’s right shoulder, setting the stage for a powerful breakout.

    SPONSORED

    Trade XRP with up to 100x leverage on perpetual contracts

    Trade Now on Defx

    RSI Analysis Supports Bullish Thesis

    The bullish case is further strengthened by XRP’s Relative Strength Index (RSI) patterns. Historical data shows a consistent trend where XRP experiences two distinct RSI peaks during bull cycles, separated by 90-120 days. The first peak of this cycle reached 85.17 in late 2024, suggesting a second peak could materialize around June 2025.

    This timing aligns perfectly with recent technical analysis showing XRP’s golden pocket pattern, adding another layer of confirmation to the bullish outlook.

    Key Price Levels to Watch

    For traders looking to capitalize on this setup, several critical price levels demand attention:

    • Current Support: $2.10
    • Pattern Neckline: $2.47
    • First Target: $3.70
    • Maximum Target: $3.90

    Market Implications and Trading Strategy

    The confluence of technical indicators suggests XRP is positioning for a significant move upward. Traders should watch for:

    • Completion of the right shoulder formation
    • Break above the neckline at $2.47
    • Increasing volume during breakout
    • RSI momentum confirmation

    FAQ Section

    Q: When is the inverse head and shoulders pattern expected to complete?
    A: Based on current formation, completion is anticipated within the next 2-3 weeks.

    Q: What could invalidate this bullish setup?
    A: A decisive break below $2.00 would likely invalidate the pattern.

    Q: How reliable are inverse head and shoulders patterns?
    A: These patterns have a historical success rate of approximately 75% in crypto markets when accompanied by strong volume.

    At the time of writing, XRP trades at $2.12, with technical indicators suggesting accumulation at these levels could prove profitable for patient investors targeting the $3.90 price objective.

  • Bitcoin Price Dips Below $84K: Critical Support Levels Revealed

    Bitcoin’s price has entered a critical phase after dropping below $84,000, following one of its strongest weekly performances that saw the cryptocurrency reach $88,000. The latest market movement, triggered by February’s core inflation data, has left investors questioning the strength of key support levels.

    As Bitcoin continues testing crucial support zones, on-chain data from Glassnode provides essential insights into potential price floors that could determine BTC’s next major move.

    Understanding Bitcoin’s Current Support Structure

    Glassnode’s cost basis distribution analysis reveals several critical support levels that could influence Bitcoin’s price trajectory:

    • $84,100: 40,000 BTC accumulated
    • $82,090: 50,000 BTC accumulated
    • $80,920: 20,000 BTC accumulated

    SPONSORED

    Trade Bitcoin with up to 100x leverage and maximize your profit potential

    Trade Now on Defx

    Deeper Support Zones and Risk Analysis

    The analysis identifies additional support levels that could become crucial if current levels fail:

    • $74,000: Strong support with 49,000 BTC accumulated
    • $71,000: Major accumulation zone with 41,000 BTC

    Notably, the previously strong $78,000 support level has weakened following recent sell-offs, potentially creating vulnerability in the short term.

    Market Impact and Trading Implications

    The current 4% decline brings several key considerations for traders:

    • Short-term volatility expected around $84,000
    • Increased trading volume at support levels
    • Potential for quick rebounds from accumulation zones

    Frequently Asked Questions

    What caused Bitcoin’s recent price drop?

    The decline was primarily triggered by February’s core inflation data release and subsequent market reactions.

    Where is the strongest support level for Bitcoin?

    According to Glassnode data, the $82,090 level shows the strongest support with 50,000 BTC accumulated.

    Could Bitcoin fall to $71,000?

    While possible, multiple strong support levels would need to break first, with $74,000 serving as a major buffer zone.

    As the market continues to digest these developments, traders should maintain close attention to these key support levels and corresponding volume patterns for potential entry and exit points.

  • XRP Price Struggles at $2: Key Support Levels Signal Potential Reversal

    XRP Price Struggles at $2: Key Support Levels Signal Potential Reversal

    Key Takeaways:

    • XRP currently trading between $2.11-$2.13
    • Market cap stands at $123 billion
    • 24-hour trading volume reaches $3.39 billion
    • Price range: $2.06-$2.22

    XRP’s price action has entered a critical phase as the digital asset struggles to maintain its position near the $2 mark. As recent analysis suggested a $3 breakout target would be needed to invalidate the bearish pattern, traders are closely monitoring key support levels for potential reversal signals.

    Current Market Conditions

    The cryptocurrency is experiencing significant pressure from sellers, with price action confined to a narrow range between $2.11 and $2.13. With a substantial market capitalization of $123 billion, XRP remains one of the top cryptocurrencies by value, though recent price action suggests mounting bearish pressure.

    Technical Analysis

    The hourly chart reveals several critical support and resistance levels:

    • Immediate Support: $2.06
    • Key Resistance: $2.22
    • Volume Profile: $3.39 billion in 24-hour trading volume indicates active market participation

    Trading Volume Analysis

    The current trading volume of $3.39 billion suggests significant market interest, though the price compression indicates potential accumulation at these levels. Traders should watch for volume spikes as potential indicators of trend direction.

    SPONSORED

    Trade XRP with up to 100x leverage on perpetual contracts

    Trade Now on Defx

    FAQ

    Q: What’s causing XRP’s current price struggle?
    A: Technical indicators suggest a combination of profit-taking and broader market uncertainty are contributing to the current price action.

    Q: What are the key levels to watch?
    A: Traders should monitor the $2.06 support and $2.22 resistance levels for potential breakout signals.

    Q: Could XRP reverse its current trend?
    A: While bearish pressure remains dominant, increased buying volume above $2.22 could signal a potential trend reversal.

  • Bitcoin Price Shows Recovery Signs as Taker-Driven Selling Cools Off

    Bitcoin Price Shows Recovery Signs as Taker-Driven Selling Cools Off

    Bitcoin’s price action is showing early signs of stabilization after a period of intense selling pressure that pushed the leading cryptocurrency below $84,000. Recent on-chain data suggests the heavy taker-driven dumps that dominated market activity may be losing momentum, potentially setting the stage for a recovery phase.

    This analysis comes as Bitcoin tests critical support levels around $83,000, with market participants closely monitoring whether current price levels can hold against bearish pressure.

    Market Structure Analysis

    The recent price action has been characterized by three significant taker-driven dumps that culminated in a low of $83,600. However, according to renowned analyst Maartunn, these aggressive selling spikes are showing signs of exhaustion, potentially indicating a shift in short-term market dynamics.

    SPONSORED

    Trade Bitcoin with up to 100x leverage on perpetual contracts

    Trade Now on Defx

    Technical Overview

    Key technical levels to watch:

    • Current Price: $84,000
    • Critical Resistance: $90,000
    • Key Support: $81,000
    • 4H 200 MA: $87,000

    On-Chain Metrics

    CryptoQuant’s Net Taker Volume metric reveals:

    • Declining sell-side pressure
    • Early signs of accumulation
    • Reduced aggressive selling activity

    Market Outlook

    While the immediate trend remains bearish below $90,000, several factors suggest a potential shift in momentum:

    • Exhaustion of aggressive sellers
    • Stabilizing price action near support
    • Improving market sentiment

    FAQ Section

    What caused the recent Bitcoin price drop?

    The decline was primarily driven by aggressive taker-driven selling on major exchanges, combined with broader market uncertainty and resistance at the $90,000 level.

    What are the key levels to watch?

    Traders should monitor the $87,000 level (4H 200 MA) as immediate resistance and $81,000 as crucial support. A break above $90,000 would signal renewed bullish momentum.

    Is this a good time to buy Bitcoin?

    While early recovery signs are emerging, investors should consider their risk tolerance and watch for confirmation of trend reversal before making investment decisions.