Tag: Cryptocurrency Trading

  • XRP Price Targets $2.90 as Golden Pocket Pattern Emerges

    XRP’s price action is showing strong bullish momentum as a critical technical pattern emerges, pointing to a potential 20% surge in the near term. Technical analyst TehThomas has identified a Golden Pocket formation that could propel XRP towards the $2.90 mark, representing a significant opportunity for traders.

    This analysis comes at an interesting time, following recent warnings about XRP needing to break $3.00 to invalidate bearish patterns. The current technical setup suggests this critical level may soon be tested.

    Golden Pocket Formation Signals Bullish Momentum

    The cryptocurrency is currently trading within a well-defined Ascending Channel pattern, with the Golden Pocket formation appearing between the 0.618 – 0.65 Fibonacci retracement levels. This technical confluence presents a strong case for continued upward momentum.

    SPONSORED

    Trade XRP with up to 100x leverage on perpetual contracts

    Trade Now on Defx

    Key Technical Levels to Watch

    • Current Price: $2.20
    • Immediate Resistance: $2.50
    • Target Range: $2.80 – $2.90
    • Critical Support: 0.618 Fibonacci level

    Short-term Risks and Considerations

    While the overall outlook remains bullish, traders should note potential short-term resistance at the current imbalance zone. A rejection at this level could trigger a temporary pullback before the next leg up. The 1-hour timeframe shows increasing selling pressure that needs to be monitored.

    Trading Strategy and Risk Management

    For traders looking to capitalize on this setup, key entry points align with the Golden Pocket support zone. Stop losses should be placed below the lower boundary of the Ascending Channel to protect against potential bearish reversals.

    Frequently Asked Questions

    What is a Golden Pocket in technical analysis?

    A Golden Pocket is a specific Fibonacci retracement zone between the 0.618 and 0.65 levels, often considered a strong support/resistance area for price action.

    How reliable is the current XRP price pattern?

    The pattern shows historical reliability with two previous successful reactions from this level, suggesting strong buyer support.

    What could invalidate this bullish scenario?

    A break below the Ascending Channel support or failure to hold the Golden Pocket level could invalidate the bullish outlook.

  • Bitcoin Price Plunges Below $84K as Inflation Fears Grip Markets

    Bitcoin’s price took a significant hit on Friday, dropping to $83,544 amid growing inflation concerns and market turbulence triggered by Trump’s proposed pharmaceutical tariffs. This 4.14% decline highlights the increasing correlation between traditional markets and cryptocurrency valuations in 2025.

    Market Turbulence: A Perfect Storm

    The latest price action comes as inflation fears continue to dominate market sentiment, with March’s consumer sentiment data revealing the highest long-term inflation expectations in more than 30 years. This bearish pressure has been amplified by former President Trump’s announcement of potential tariffs on pharmaceutical companies, sending shockwaves through both traditional and crypto markets.

    Key Market Indicators

    • Bitcoin Price: $83,544 (⬇️ 4.14%)
    • 24-hour Trading Volume: $47.2B
    • Market Dominance: 51.2%
    • Total Crypto Market Cap Decline: -4.14%

    SPONSORED

    Navigate market volatility with up to 100x leverage on perpetual contracts

    Trade Now on Defx

    Technical Analysis and Market Outlook

    The current price action has established several critical support levels that traders should monitor:

    Support Level Price Point Significance
    Primary Support $82,500 Previous resistance turned support
    Secondary Support $80,000 Psychological level
    Critical Support $78,500 200-day moving average

    Impact of Macroeconomic Factors

    The correlation between Bitcoin and traditional markets has strengthened in 2025, with several factors contributing to the current downturn:

    • Rising inflation expectations
    • Proposed pharmaceutical tariffs
    • Global trade tensions
    • Stock market volatility

    Expert Insights

    Market analysts remain divided on Bitcoin’s short-term prospects. According to cryptocurrency strategist Michael van de Poppe, “The current pullback represents a healthy correction in an otherwise strong bull market. Key support at $82,500 needs to hold to maintain bullish momentum.”

    Frequently Asked Questions

    What caused Bitcoin’s price drop below $84K?

    The decline was primarily triggered by inflation fears and market turbulence following Trump’s proposed pharmaceutical tariffs, combined with bearish sentiment in traditional markets.

    Will Bitcoin recover from this dip?

    Technical indicators suggest strong support at $82,500, but market recovery will largely depend on broader economic conditions and inflation data in the coming weeks.

    How does this affect the overall crypto market?

    The total cryptocurrency market cap has declined by 4.14%, indicating a market-wide impact of the current bearish sentiment.

    This is a developing story. Stay tuned for updates as the market situation evolves.

  • Shiba Inu Price Pattern Signals 91% Rally Potential: Key Levels Ahead

    Shiba Inu (SHIB) could be on the verge of a major price surge, according to fresh technical analysis that draws striking parallels with historical patterns. Similar to patterns currently forming in Dogecoin’s price action, SHIB’s chart is showing promising technical formations that could trigger significant upside movement.

    Technical Analysis Reveals Multi-Stage Bullish Setup

    A comprehensive TradingView analysis has identified a four-stage pattern sequence in SHIB’s price action that mirrors successful rallies from 2024. The analysis highlights:

    • Stage 1: Completed falling wedge pattern (classic bullish reversal)
    • Stage 2: Emerging cup-and-handle formation
    • Stage 3: Potential W-shaped pattern development
    • Stage 4: Expected inverted head-and-shoulders pattern

    SPONSORED

    Trade SHIB with up to 100x leverage on perpetual contracts

    Trade Now on Defx

    Price Targets and Key Levels

    Current analysis suggests a potential 91% rally from current levels:

    Metric Value
    Current Price $0.00001340
    Target Price $0.0000335
    Key Resistance $0.00003000
    100-day MA $0.00001380

    Risk Factors to Consider

    Despite the bullish technical setup, several risk factors warrant attention:

    • Recent 7.3% price decline in 24 hours
    • Loss of 100-day moving average support
    • Increased market volatility affecting pattern reliability

    Frequently Asked Questions

    What is causing the potential SHIB price rally?

    Technical analysis suggests a combination of bullish patterns, including a falling wedge and cup-and-handle formation, similar to patterns that preceded previous rallies.

    What is the predicted timeframe for the 91% rally?

    While exact timing is difficult to predict, historical pattern completion suggests a 3-6 week window for the full pattern to develop.

    What are the key price levels to watch?

    The critical resistance level at $0.00003 and the 100-day moving average at $0.00001380 are the most important technical levels to monitor.

    Traders should maintain strict risk management practices and consider broader market conditions before making investment decisions based on technical analysis alone.

  • XRP Price Alert: Head & Shoulders Pattern Signals Potential Drop to $1.07

    XRP Price Alert: Head & Shoulders Pattern Signals Potential Drop to $1.07

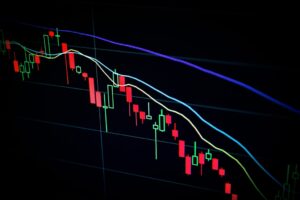
    Leading cryptocurrency analyst Peter Brandt has identified a bearish head-and-shoulders pattern in XRP’s price action, suggesting a potential decline below the critical $2 support level. This technical analysis comes amid increased market volatility and growing concerns about XRP’s short-term trajectory.

    As recent price movements have shown, XRP has been experiencing significant pressure near its support levels, with technical indicators pointing to possible bearish momentum.

    Technical Analysis Reveals Bearish Pattern

    According to Brandt’s analysis shared on X (formerly Twitter), XRP is displaying a textbook head-and-shoulders formation, typically considered a bearish reversal pattern. The pattern projects a potential price decline to $1.07, representing a significant drop from current levels.

    SPONSORED

    Trade XRP with up to 100x leverage and maximize your profit potential

    Trade Now on Defx

    Key Support Levels to Watch

    Multiple analysts have weighed in on crucial support levels:

    • $2.25 – Current immediate support
    • $1.90 – Secondary support level
    • $1.54 – Potential breakdown target identified by CasiTrades
    • $1.07 – Ultimate bearish target according to Brandt

    Bullish Scenario and Invalidation Points

    Despite the bearish outlook, analyst Ali Martinez suggests that a break above $3 would invalidate the head-and-shoulders pattern, potentially triggering a bullish reversal. Additionally, Dark Defender maintains an optimistic long-term view, projecting potential targets as high as $23.20 through wave analysis.

    FAQ Section

    What is a head-and-shoulders pattern?

    A head-and-shoulders pattern is a technical chart formation consisting of three peaks, with the middle peak (head) being higher than the two outer peaks (shoulders). It’s typically considered a bearish reversal pattern.

    What could invalidate the bearish scenario?

    A decisive break above $3 would invalidate the bearish pattern and could trigger a bullish reversal.

    What’s the current XRP price?

    XRP is currently trading at $2.25, showing a 4% decline in the last 24 hours according to CoinMarketCap data.

  • Ethereum Price Faces Critical Test at $2,100 Resistance Level

    Ethereum (ETH) is showing signs of weakness as the leading smart contract platform struggles to overcome the crucial $2,100 resistance level. The cryptocurrency has lost its grip on the psychologically important $2,000 mark, sparking concerns of a potential deeper correction in the near term.

    Since March 19, ETH has managed to maintain support above $1,930, but recent market action suggests mounting selling pressure could push prices below the critical $1,900 threshold. The current price action has caught the attention of prominent analysts, including Carl Runefelt, who warns of growing downside risks.

    SPONSORED

    Trade Ethereum with up to 100x leverage on perpetual contracts

    Trade Now on Defx

    Technical Analysis Points to Growing Bearish Pressure

    The technical outlook for Ethereum appears increasingly bearish as the asset continues to face rejection at the $2,100 resistance level. As noted in recent analysis of Ethereum’s key support levels for March 2025, the current market structure suggests potential for further downside.

    Key price levels to watch:

    • Immediate Support: $1,900
    • Critical Support: $1,880
    • Major Resistance: $2,100
    • Secondary Resistance: $2,300

    Macro Factors Weighing on Ethereum

    The broader cryptocurrency market faces significant headwinds from macroeconomic uncertainty, including:

    • Rising recession fears in the United States
    • Persistent inflation concerns
    • Global trade tensions
    • Unstable monetary policy outlook

    Expert Outlook and Trading Implications

    According to Runefelt, Ethereum’s repeated failure to breach $2,100 could trigger a cascade of selling that might push prices toward the previous local low of $1,750. This technical weakness comes at a crucial time when the broader crypto market shows signs of vulnerability.

    FAQ Section

    What are the key support levels for Ethereum?

    The immediate support lies at $1,900, with critical support at $1,880. A break below these levels could trigger a move toward $1,750.

    What needs to happen for Ethereum to turn bullish?

    ETH needs to reclaim and hold above $2,000, followed by a decisive break above the $2,100 resistance level.

    How does Bitcoin’s performance affect Ethereum?

    As the leading cryptocurrency, Bitcoin’s price action often influences Ethereum’s movements, with significant BTC corrections typically leading to larger percentage drops in ETH.

    Traders should maintain strict risk management practices given the current market conditions and watch for potential breakdown below key support levels. The next few days will be crucial in determining whether Ethereum can defend its current price range or if a deeper correction is imminent.

  • Dogecoin Price Eyes $1 Target: Analysts Spot Rare Buy Signal

    The cryptocurrency market is witnessing a potential game-changing moment for Dogecoin (DOGE) as multiple analysts align on a bullish trajectory toward the $1 mark. This analysis comes as DOGE tests critical support levels while showing promising technical indicators.

    Technical Analysis Points to Major Dogecoin Rally

    Crypto analyst Investing Scope has identified a rare buying opportunity for Dogecoin, highlighting the 1.618 Fibonacci extension on the higher high trendline as a key indicator. The analysis suggests that DOGE’s current price action mirrors historical patterns that preceded significant rallies.

    SPONSORED

    Trade Dogecoin with up to 100x leverage on perpetual contracts

    Trade Now on Defx

    Key Price Levels and Market Indicators

    According to analyst Ali Martinez, crucial support and resistance levels for DOGE are established at:

    • Support: $0.177
    • Resistance: $0.207
    • Breakout target: $0.21 (SuperTrend indicator)

    Market Sentiment and Trading Activity

    Current market data reveals strong bullish sentiment:

    • 76.65% of Binance futures traders are long on DOGE
    • Current price: $0.18 (down 6% in 24 hours)
    • Testing 1-week MA50 for first time in three weeks

    Expert Price Predictions

    Multiple analysts have provided ambitious price targets:

    • Master Kenobi: $1 by June 2025
    • Trader Tardigrade: Potential $8 target in current market cycle
    • Investing Scope: $1 based on Fibonacci extension analysis

    FAQ Section

    What is driving Dogecoin’s potential price increase?

    Technical indicators, historical pattern similarities to the 2017 bull run, and strong market sentiment are key drivers.

    When could Dogecoin reach $1?

    Analysts project a potential $1 price target by June 2025, though market conditions remain volatile.

    What are the key risk factors?

    Investors should consider market volatility, regulatory changes, and overall crypto market conditions before making investment decisions.

  • Uniswap Price Crashes Below $6.7: Technical Analysis Points to Further Decline

    Uniswap (UNI) has entered bearish territory as its price plummeted below the critical $6.7 support level, triggering concerns across the DeFi market. This technical breakdown, accompanied by increasing selling pressure, suggests the leading DEX token could face additional downside in the coming days.

    Technical Analysis Shows Mounting Bearish Pressure

    The recent price action reveals several concerning signals for UNI holders:

    • Break below the crucial $6.7 support level
    • Price trading under the 100-day Simple Moving Average (SMA)
    • Bearish MACD crossover confirming downward momentum
    • Declining trading volume indicating lack of buyer interest

    Similar to the broader DeFi market weakness highlighted in recent analysis of DeFi TVL trends, Uniswap’s technical deterioration suggests potential further losses ahead.

    SPONSORED

    Trade UNI with up to 100x leverage on perpetual contracts

    Trade Now on Defx

    Key Support Levels to Watch

    With the breakdown below $6.7, traders should monitor these critical support zones:

    Support Level Technical Significance
    $5.50 Previous consolidation zone
    $4.80 Major historical support

    Potential Recovery Scenarios

    For bulls to regain control, UNI needs to:

    • Reclaim $6.7 with strong buying volume
    • Break above the 100-day SMA
    • Show increased trading activity supporting upward momentum

    Frequently Asked Questions

    What caused Uniswap’s recent price drop?

    The decline appears primarily technical, triggered by the breakdown below key support levels and exacerbated by declining trading volume.

    Can Uniswap recover from this downturn?

    Recovery is possible if buyers step in and push the price back above $6.7, but significant volume will be needed to reverse the current bearish trend.

    What are the next price targets for UNI?

    If selling pressure continues, UNI could test support at $5.50, with $4.80 serving as the next major support level.

  • Bitcoin Price Dips 2.5% as Trump Tariffs Spark Market Selloff

    Bitcoin Price Dips 2.5% as Trump Tariffs Spark Market Selloff

    The cryptocurrency market is experiencing significant downward pressure as Bitcoin (BTC) dropped 2.5% amid growing concerns over President Donald Trump’s upcoming reciprocal tariffs and crucial macroeconomic data releases. The leading cryptocurrency is currently trading at $85,266.30, with the broader digital asset market showing even steeper declines.

    This market movement coincides with recent liquidations in the Bitcoin market, suggesting a continuation of the bearish trend as key support levels are tested.

    Market Impact and Alternative Assets

    While Bitcoin’s decline appears relatively contained, altcoins are bearing the brunt of the market correction:

    • Ethereum (ETH): -6% (trading at $1,911.49)
    • XRP: -5.5%
    • Dogecoin (DOGE): -7%
    • CoinDesk 20 Index: -4.65%

    SPONSORED

    Protect your portfolio with up to 100x leverage on perpetual contracts

    Trade Now on Defx

    Key Market Factors

    Several significant factors are contributing to the current market conditions:

    1. Trump Tariffs

    Set to take effect on April 2, the new tariffs include a 25% levy on imported automobiles and certain car parts, creating uncertainty in global markets.

    2. Options Expiry

    A record-breaking $12.2 billion in BTC options are expiring on Deribit today, with a max pain point at $85,000. However, market analysts suggest limited impact due to relatively small options open interest compared to spot trading volume.

    3. ETF Flows

    Despite market turbulence, spot Bitcoin ETFs continue showing strength with:

    • $89 million in daily net inflows
    • $36.42 billion in cumulative net flows
    • Total BTC holdings reaching 1,122 million

    Expert Analysis

    According to Wintermute OTC trader Jake O., “These expirations are yet to consistently move markets, largely because BTC options open interest remains small relative to spot activity. The $12B in options is dwarfed by $28B in spot volume traded over the past 24 hours.”

    Looking Ahead

    Traders should monitor several key events:

    • PCE report release (March 28)
    • Trump tariffs implementation (April 2)
    • Technical support at $85,000

    Frequently Asked Questions

    What is causing the current crypto market decline?

    The decline is primarily driven by concerns over Trump’s upcoming tariffs, pending macroeconomic data, and general risk-off sentiment in global markets.

    Will the Bitcoin options expiry impact prices?

    Analysts suggest limited impact due to the relatively small size of options open interest compared to spot trading volume.

    How are institutional investors responding?

    Institutional interest remains strong, evidenced by continued inflows into spot Bitcoin ETFs despite market volatility.

  • Dogecoin Price Faces Critical $0.205 Test: Key Support at $0.180

    Dogecoin Price Faces Critical $0.205 Test: Key Support at $0.180

    Dogecoin (DOGE) has entered a crucial phase as the popular meme coin faces significant downward pressure after failing to breach the $0.205 resistance level. Technical analysis reveals multiple support zones that could determine DOGE’s next major move.

    As recent URPD data suggested, DOGE is now testing critical support levels that could define its short-term trajectory. The latest price action shows bears gaining momentum as key technical indicators flash warning signals.

    Technical Breakdown of DOGE’s Current Position

    The cryptocurrency has broken below several important technical levels:

    • Initial breakdown under $0.1980 support
    • Secondary support at $0.1920 breached
    • Key bullish trendline violated at $0.1950
    • Currently holding above 100-hour moving average

    SPONSORED

    Trade DOGE with up to 100x leverage on perpetual contracts

    Trade Now on Defx

    Critical Support and Resistance Levels

    Support Levels Resistance Levels
    $0.1860 $0.1920
    $0.1820 $0.1980
    $0.1750 $0.2050

    Market Indicators and Analysis

    The technical indicators paint a cautious picture:

    • MACD showing weakening bullish momentum
    • RSI dropped below 50, indicating bearish pressure
    • 23.6% Fibonacci retracement level breached

    Potential Scenarios and Price Targets

    Two primary scenarios are emerging:

    Bullish Case

    • Reclaim of $0.1920 could trigger recovery
    • Break above $0.2050 targets $0.2150
    • Maximum upside potential at $0.2350

    Bearish Case

    • Failure at $0.1920 risks further decline
    • Support break at $0.1750 targets $0.1650
    • 50% Fibonacci retracement level at $0.1860

    Frequently Asked Questions

    What’s causing DOGE’s current price decline?

    The decline is primarily technical, following a failure to break above $0.2050 resistance and broader market correlation with Bitcoin and Ethereum movements.

    Where is the strongest support level for DOGE?

    The $0.1750 level represents the strongest support, with significant buyer interest historically accumulated at this price point.

    What could trigger a DOGE recovery?

    A clear break above $0.1920 with increased volume could signal a trend reversal and potential recovery toward $0.2050.

    Traders should maintain strict risk management practices given the current market volatility. The next 24-48 hours will be crucial in determining whether DOGE can maintain its position above key support levels or if further downside is likely.

  • Ethereum Price Struggles at $2,040: Key Support Levels for March 2025

    Ethereum Price Struggles at $2,040: Key Support Levels for March 2025

    Ethereum (ETH) continues to face significant resistance at the $2,040 level, with technical indicators suggesting potential bearish momentum in the short term. As previous analysis indicated potential resistance at $2,160, the second-largest cryptocurrency by market cap is showing signs of weakness below crucial technical levels.

    Current Market Position and Technical Analysis

    ETH price action reveals several critical developments:

    • Price currently consolidating below $2,020 and the 100-hourly SMA
    • Formation of a bearish trend line with resistance at $2,040
    • Critical support established at $1,980 with recent low at $1,982
    • 50% Fibonacci retracement level tested from $2,098 high to $1,982 low

    Key Resistance Levels to Watch

    Multiple resistance zones could impact ETH’s near-term trajectory:

    • Immediate resistance: $2,040
    • Secondary resistance: $2,050 (61.8% Fibonacci level)
    • Major resistance: $2,095
    • Extended targets: $2,150, $2,250, and $2,320

    SPONSORED

    Trade Ethereum with up to 100x leverage and maximize your profit potential

    Trade Now on Defx

    Support Zones and Downside Risks

    If bearish pressure continues, these support levels become crucial:

    • Primary support: $1,980
    • Secondary support: $1,880
    • Critical support: $1,820
    • Major support floor: $1,750

    Technical Indicators Signal Caution

    Current technical readings suggest increased bearish pressure:

    • MACD: Losing momentum in bearish zone
    • RSI: Trading below 50, indicating bearish sentiment
    • Moving Averages: Price below 100-hourly SMA

    Frequently Asked Questions

    What is the immediate price target for Ethereum?

    The immediate resistance target is $2,040, with potential for movement to $2,150 if this level is breached successfully.

    What are the key support levels to monitor?

    The primary support level is at $1,980, followed by $1,880 and $1,820 as secondary support zones.

    Could Ethereum break down further?

    If ETH fails to maintain support at $1,980, a decline toward $1,880 or even $1,750 becomes possible.

    Traders should maintain strict risk management practices given the current market volatility and watch for clear breakout signals above $2,040 or breakdown below $1,980 for confirmation of the next major move.